Original Research Article
A study on prevalence of cardiovascular disease related risk factors
among tribal population in a block of West Bengal
Sutanuka Santra
1*, Prabha Shrivastava
2INTRODUCTION
The World is now in the stage of epidemiological transition and the non-communicable diseases are overtaking the communicable diseases. This phenomenon is not only seen in the developed countries but also evident in the developing countries like India. Among the major non-communicable diseases, cardiovascular diseases (CVDs) are recognized as major public health problems by World Health Organization (WHO).1
Currently, non-communicable diseases (NCDs) kill more than 36 million people each year. Nearly 80% of NCD deaths - 29 million - occur in low and middle-income countries. More than nine million of all deaths attributed to NCDs occur before the age of 60 years. Out of all "premature" deaths 90% occurred in low- and middle-income countries. Cardiovascular diseases (CVDs) account for most NCD deaths i.e. 17.3 million people annually.2 So considerable part of the morbidity and mortality results from cardiovascular diseases (CVDs). In 2011 total 4,99,638 cases of non-communicable diseases
ABSTRACT
Background: Non communicable diseases (NCDs) refer to chronic diseases of long duration and generally with slow progression. NCDs are affecting Indian population, both in urban and rural areas. Cardiovascular disease (CVD), one of the major NCDs is the leading cause of death worldwide. The rising prevalence of behavioral and anthropometric risk factors for these lifestyle diseases is postulated to be the cause for the alarming increase of NCDs including CVD. Prevalence of cardiovascular diseases is also increasing in tribal population. Objective of this study was to assess the prevalence of risk factors associated with cardiovascular diseases among the tribal population aged 18 years and above.
Methods: A community based, observational, descriptive study was conducted at Kharagpur-II block of Paschim Medinipur district, West Bengal from August 2013 to July 2014 among 540 tribal population aged 18 years and above selected by cluster random sampling method.
Results: About 64% individuals were addicted to tobacco product. Prevalence of current smoking and tobacco chewing was 9.1% and 60.2% respectively. Prevalence of current alcohol consumption was 48.9%. About 91% individuals took extra salt with meal. Prevalence of overweight and obesity was 7.8% and 3.5% only according to WHO recommended classification for Asian population. However, higher level of physical activity was found among the study population.
Conclusions: The study revealed high prevalence of extra salt intake, tobacco and alcohol consumption among the study population which may endanger their life by increasing the risk of cardiovascular disease.
Keywords: Cardiovascular, Prevalence, Tribal, West Bengal
1Health Officer, Kharagpur Municipality, Paschim Medinipur, West Bengal, India 2Department of Community Medicine, Burdwan Medical College, West Bengal, India
Received: 17 October 2019
Revised: 20 November 2019
Accepted: 21 November 2019
*Correspondence:
Dr. Sutanuka Santra,
E-mail: [email protected]
Copyright: © the author(s), publisher and licensee Medip Academy. This is an open-access article distributed under the terms of the Creative Commons Attribution Non-Commercial License, which permits unrestricted non-commercial use, distribution, and reproduction in any medium, provided the original work is properly cited.
(NCDs) were detected in West Bengal, which included cardio-vascular diseases, stroke, cancers, diabetes, chronic respiratory disorders, etc. Total number of deaths registered was 11,787.3
In spite of incredible world-wide progress in the field of medicines, curative and preventive health measures, still there is huge population living in isolation in natural and unpolluted surroundings far away from modern civilization with their traditional values, customs, beliefs and myths intact. They are commonly known as “tribals” and are considered to be the autochthonous people of the land.4 Studies carried out worldwide, on indigenous tribes who are on the process of acculturation and prevalence of non-communicable disease is increasing among them especially cardiovascular disease. Till recent past, control and prevention of only communicable diseases was emphasized upon. At present, attention has been extended to control and prevention of non-communicable diseases including stroke and coronary artery disease at the national level in view of the rising trends. Though several studies have been carried out among different population with sedentary lifestyle to assess the risk factors for NCD, but very few studies have been carried out among tribal population especially in West Bengal.5,6 One argument towards this can be non-exposure to risk factors like decreased physical activity and obesity among the tribal by virtue of their lifestyle but other side of the coin suggests that the risk factors like smoking and alcohol consumption is widely prevalent among the tribal community.
In the light of the foregoing, the present study was undertaken to determine the prevalence of risk factors associated with cardiovascular diseases among the tribal population of Kharagpur II block, Paschim Medinipur district, West Bengal.
Objective of this study was to assess the prevalence of risk factors associated with cardiovascular diseases among the tribal population aged 18 years and above.
METHODS
The ethical clearance was obtained from Institutional Ethical Committee (IEC).
Study type and design
The study was a community based observational, descriptive study with a cross-sectional design.
Study area
Kharagpur II block of Paschim Medinipur district, West Bengal.
Duration of study
One year from August 2013 to July 2014.
Study population
The study population consisted of all tribal residents of the study area who were aged 18 years and above.
Sample size
Hypertension is an important risk factor for cardiovascular disease. The prevalence of 22.8% hypertension was found in a community-based study conducted by Sachdev et al. among nomad tribe groups of Rajasthan.4 This prevalence was taken for sample size calculation. With 95% confidence limit and 5% absolute error, the sample size was 270 by using the formula Z2PQ/ L2 [where Z=1.96, P=22.8, Q=(100-P)=77.2, L=5]. As 30 clusters random sampling method of data collection was planned, the design effect of 2 was considered. Then, the total sample size was 540. So, the study subjects per cluster was (540/30)=18.
Sampling design
In West Bengal more than half of the total tribal population is concentrated in Paschim Medinipur, Jalpaiguri, Purulia, and Burdwan districts. Kharagpur II block of Paschim Medinipur district has more than 25% tribal population (2011 census). In this block, villages containing more than 25% tribal inhabitants were considered as “tribal village”. According to census data (2011), 150 villages could be considered for the study. The 30 clusters were selected by cluster sampling technique. From each cluster 18 consecutive subjects, aged 18 years and above who gave informed consent were studied.
Study tools
Data was collected using predesigned and pretested schedule, stethoscope, aneroid sphygmomanometer standardized weighing machine (bathroom scale), non-elastic measuring tape. The first section of the schedule was meant to collect information regarding socio-demographic characteristics like age, sex, religion, education, occupation, marital status etc. The second section of the schedule consisted of questions based on the WHO STEP wise approach to non-communicable disease risk factor surveillance.
Data collection procedure
A predesigned and pretested schedule was applied for data collection. After pretesting necessary modifications were made in the schedule. The data collection was done by house to house visit of the study subjects. Each study subject was briefed about the purpose of the study. The subjects were assured of confidentiality and an informed consent was sought from each of them before initiating the interview.
Study variables
Age, gender, educational status, occupational status, family type, socio-economic status (according to modified B. G. Prasad‟s classification, 2013) and risk factors for cardiovascular disease [Hypertension (based on JNC-VII criteria), smoking, tobacco chewing, alcohol intake, physical inactivity and obesity, past history or family history of cardiovascular disease, type of diet, history of extra salt intake, etc].
Parameters related to physical activity
Vigorous intensity activity: 'vigorous-intensity activities' are activities that require hard physical effort and cause large increases in breathing or heart rate. History was taken regarding performance of vigorous activity both during work e.g., carrying or lifting heavy loads, digging or construction work and during performance of strenuous sports e.g., playing football, running etc.6
Moderate intensity activity
'Moderate-intensity activities' are activities that require moderate physical effort and cause small increases in breathing or heart rate e.g., brisk walking, carrying light load.6 Gardening, domestic work, general building tasks like roofing, thatching, etc. were also considered as moderate intensity work.
Active transport
It was defined as physical activity like walking, cycling, etc. undertaken as a means of transport.
Metabolic equivalent
Metabolic equivalent (MET) was used to express the intensity of physical activities. MET was the ratio of a person's working metabolic rate relative to their resting metabolic rate. One MET was defined as the energy cost of sitting quietly and was equivalent to a caloric consumption of 1 kcal/kg/hour. It was estimated that compared with sitting quietly, a person's caloric consumption was three to six times higher when being moderately active (3-6 METs) and more than six times higher when being vigorously active (>6 METs). Therefore, when calculating a person's overall energy expenditure, 4 METs got assigned to the time spent in
moderate activities, and 8 METs to the time spent in vigorous activities.8
Parameters related to addiction
Smoking
A current smoker was a person who smoked any tobacco product either daily or occasionally for at least six months from study period i.e., current smokers could be either daily or occasional smokers.9
A daily smoker was a person, who smoked any tobacco product at least once a day (except that people who smoked every day, but not on days of religious fasting, were still classified as daily smokers).10
An occasional smoker was a person, who smoked, but not every day.10
A non-smoker was a person who did not smoke any tobacco product at all for at least six months from study period.10
Current drinker
Those who consumed 1 or more drinks of any type of alcohol in the year preceding the survey.7
Parameters related to obesity
BMI was classified according to WHO adopted BMI classification for the Asian population.10 Cut-off level for Waist Circumference for abdominal obesity was taken as 90 cm and 80 cm for males and females as per the cut-off values for Asian population. Cut-off level of Waist/Hip Ratio for abdominal obesity was taken as a waist- hip ratio above 0.9 for males and above 0.8 for females, according to the cut-off values for Asian population.11
Statistical analysis
The data were analysed using SPSS version 16. The results were expressed mostly in frequencies, proportions, mean and median. Associations between some variables were tested using Chi square statistical tests.
RESULTS
Most of the individuals were santals (90.7%).
A total of 179 individuals were hypertensive (systolic BP ≥140 and/or diastolic BP ≥90 mm of Hg) i.e., prevalence of hypertension was 33.1% in the study subjects which included cases detected during the study (27%) and known hypertensive individuals (6.1%).
Table 1: Socio-demographic characteristics of study subjects (n=540).
Variables Frequency (%) Age groups (in years)
<30 184 (34.1)
30-40 105 (19.4)
40-50 94 (17.4)
50-60 74 (13.7)
≥60 83 (15.4)
Gender
Male 229 (42.4)
Female 311 (57.6)
Occupation
Labourer 435 (80.6)
Homemaker 31 (5.7)
Student 9 (1.7)
At home 60 (11.1)
Others 5 (0.9)
Education
Illiterate 361 (66.9) Class (I-IV) 117 (21.7) Class (V-X) 53 (9.6) Above Class X 10 (1.9)
Marital status
Married 476 (88.1)
Widowed 42 (7.8)
Separated 5 (0.9)
Unmarried 17 (3.1)
Socio economic status (modified B. G. Prasad scale)
Class I 1 (0.2)
Class II 3 (0.5)
Class III 0 (0.0)
Class IV 36 (6.7)
Class V 500 (92.6)
Type of family
Nuclear 277 (51.3)
Joint 263 (48.7)
Figure 1: Distribution of study subjects according to ethnic groups (n=540).
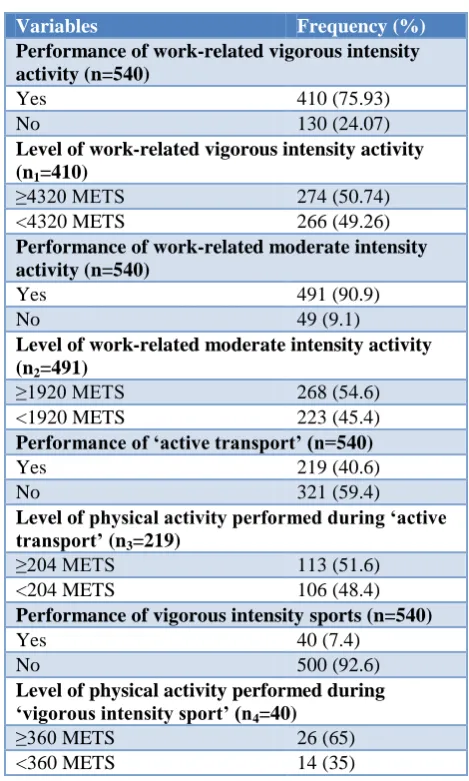
Table 2: Distribution of study subjects according to performance of physical activity.
Variables Frequency (%) Performance of work-related vigorous intensity activity (n=540)
Yes 410 (75.93)
No 130 (24.07)
Level of work-related vigorous intensity activity (n1=410)
≥4320 METS 274 (50.74) <4320 METS 266 (49.26)
Performance of work-related moderate intensity activity (n=540)
Yes 491 (90.9)
No 49 (9.1)
Level of work-related moderate intensity activity (n2=491)
≥1920 METS 268 (54.6)
<1920 METS 223 (45.4)
Performance of ‘active transport’ (n=540)
Yes 219 (40.6)
No 321 (59.4)
Level of physical activity performed during ‘active transport’ (n3=219)
≥204 METS 113 (51.6)
<204 METS 106 (48.4)
Performance of vigorous intensity sports (n=540)
Yes 40 (7.4)
No 500 (92.6)
Level of physical activity performed during ‘vigorous intensity sport’ (n4=40)
≥360 METS 26 (65)
<360 METS 14 (35)
Around 3/4th (410) of the study participants performed vigorous activity for at least 10 minutes continuously during work. Among the 410 individuals the median level of vigorous activity performed per week was 4320 METS and 274 (66.8%) performed ≥4320 METS physical activity per week. Around 91% (491) of the individuals performed work related moderate intensity activity for at least 10 minutes continuously. Among the 491 individuals the median level of moderate intensity activity performed per week was 1920 METS and 268 (54.6%) performed ≥1920 METS physical activity per week. Around 60% (219) individuals performed “active transport” for at least 10 minutes continuously. Among those 219 individuals the median level of physical activity during “active transport” performed per week was 204 METS and 113 (51.6%) performed ≥204 METS physical activity per week. Only 7.4% individuals performed vigorous intensity sports.
Overall 63.5% study participants were addicted to at least one tobacco product (smoking or chewing tobacco). 90.7%
2.6% 6.7%
Santal
Bhumij
Figure 2: Distribution of study subjects according to current smoking (n=540).
Out of total 540 study subjects 49 (9.1%) were current smokers i.e., prevalence of current smoking was 9.1%.
Table 3: Distribution of study participants according to addiction to smoking.
Variables Frequency (%) ‘Daily’ smoking (n=540)
Yes 46 (8.5)
No 494 (91.5)
Age of initiation of ‘daily’ smoking (in years) (n1=46)
<18 17 (37.0)
≥18 29 (63.0)
Duration of ‘daily’ smoking (in years) (n1=46)
<18 24 (52.2)
≥18 22 (47.8)
Number of ‘bidis’ smoked per day among ‘daily’ smokers (n1=46)
<5 25 (54.3)
≥5 21 (45.7)
Figure 3: Distribution of study subjects according to current tobacco chewing (n=540).
Among 49 current smokers 46 were daily smokers and 3 were occasional smokers. Prevalence daily smoking was 8.5%. All smokers were male. Among daily smokers the
median duration of smoking was 18 years and 22 (47.8%) smoked for ≥18 years. It was observed that 37% daily smokers started smoking before the age of 18 years i.e. before the permitted age for buying tobacco products. All the smokers smoked “bidi”. The median number of “bidis” smoked per day was 5 and 21 (45.7%) smoked ≥5 “bidi” per day.
Table 4: Distribution of study participants according to addiction to smoking.
Variables Frequency (%) ‘Daily’ tobacco chewing (n=540)
Yes 323 (59.8)
No 217 (40.2)
Age of initiation of ‘daily’ tobacco chewing (in years) (n1=323)
<18 155 (48.0)
≥18 168 (52.0)
Duration of ‘daily’ tobacco chewing (in years) (n1=323)
<21 156 (48.3)
≥21 167 (51.7)
Frequency of tobacco chewing per day (n1=323)
<5 151 (46.7)
≥5 172 (53.3)
Among the “current non-smokers” 6 (1.2%) were smokers and rest were never smokers. All of the ex-smokers were daily ex-ex-smokers and 50% of them stopped smoking after the age of 60 years and smoked for more than 35 years before quitting.
Prevalence of current tobacco chewing was 60.2%. Among the 325 current tobacco chewers 323 chewed tobacco daily and two chewed occasionally.
Prevalence of daily tobacco chewing was 59.8%. Amongst male‟s daily tobacco chewers were 73.4% compared to 26.6% daily tobacco chewers amongst tribal females and this difference was statistically significant (χ2=30.36, df=1, p=0.000). Among 323 daily tobacco chewers the median duration of tobacco chewing was 21 years and 167 (51.7%) chewed tobacco for ≥21 years. About half of the daily tobacco chewers (48%) started tobacco chewing before the age of 18 years i.e. before the permitted age for buying tobacco products. Among 323 daily tobacco chewers the median frequency of tobacco chewed per day was 5 times and 172 (53.3%) chewed tobacco for 5 times or more per day.
Among the 215 current “non tobacco chewers” 15 (7%) were ex-tobacco chewers. Among them 14 (93.3%) chewed tobacco daily. Out of total 15 ex-tobacco chewers 8 (53.3%) stopped chewing after the age of 60 years but chewed tobacco for more than 40 years before quitting and 10 (66.7%) had stopped tobacco chewing for more than 2 years prior to the date of study.
0 20 40 60 80 100
Yes No
90.9%
9.1%
Yes
No
0 10 20 30 40 50 60 70
Yes No
39.8% 60.2%
Yes
Table 5: Distribution of study subjects according to addiction to alcohol.
Variables Frequency (%) Current alcohol consumption (n=540)
Yes 264 (48.9)
No 276 (51.1)
Age of initiation of alcohol consumption (in years) (n1=264)
<21 136 (51.5)
≥21 128 (48.5)
Duration of alcohol consumption (in years) (n1=264)
<20 120 (45.5)
≥20 144 (54.5)
Frequency of alcohol consumption (n1=264)
Less than once a month 20 (7.6)
Once a month 52 (19.7)
2-3 times a month 53 (20.1)
Once a week 32 (12.1)
More than once a week but not daily 43 (16.3)
Once daily 34 (12.8)
Several times a day 30 (11.4) Prevalence of current alcohol consumption was 49%. Among males 64.2% were current alcohol consumers whereas among females it was 37.6% and this difference was found statistically significant (χ2=37.27, df=1, p=0.000). Among the current drinkers 51.5% started drinking before the age of 21years i.e., before the legal age for drinking in West Bengal. Among 264 „current drinkers‟ the median duration of alcohol consumption was 20 years and 144 (54.5%) consumed alcohol for 20 years or more. Out of 264 individuals 34 (12.8%) individuals consumed alcohol once daily while 30 (11.4%) consumed several times a day. Among the 276 individuals who currently did not drink, 27 (9.8%) were former drinkers and rest were life time abstainers.
Only 2 persons were vegetarian. All consumed vegetables daily. None of the individuals took fruit at least once a week. The proportion of fish, chicken and milk intake for at least once a week was also very much less i.e., 8.9%, 3.3% and 2.9% respectively. All used mustard oil for cooking. The mean per capita oil intake per month was 361±53.78 ml. Out of 540 individuals 51 (9.4%) did not take extra salt with meal.
Out of 540 individuals 69 (12.8%) had family history of cardiovascular diseases.
Mean weight, BMI and waist circumference among males increased with increasing age and reached a peak in the age group 40-50 years and after that decreased with advancing age. However, waist hip ratio varied between 0.85-0.87 in different age groups among males. Overall mean BMI, waist circumference and waist hip ratios
among males were 19.94±2.49 kg/m2, 75.92±9.19 cm, 0.86±0.04 respectively.
Mean weight, BMI, and waist circumference among females increased with increasing age and reached a peak in the age group 40-50 years and after that decreased with advancing age. Mean BMI in ≥60 years age group was 18.28 i.e., in the range of chronic energy deficiency. However, waist hip ratio was 0.78 in <30 years age group and 0.79 among the rest. Overall mean BMI, waist circumference and waist hip ratios among females were 19.23±2.79 kg/m2, 68.55±7.68 cm, 0.79±0.03 respectively.
Table 6: Distribution of study subjects according to BMI grades (n=540).
BMI (in kg/m2) Frequency (%)
<18.5 202 (37.4)
18.5-22.9 277 (51.3)
23-24.9 42 (7.8)
≥25 19 (3.5)
Total 540 (100.0)
Majority of the study subjects (51.3%) had normal BMI according to the WHO adopted BMI classification for the Asian population. Prevalence of chronic energy deficiency (CED) i.e., BMI <18.5 was 37.4% whereas prevalence of overweight (BMI 23-24.9 kg/m2) and obesity (BMI ≥25 kg/m2) was 7.8% and 3.5% respectively.
Prevalence of overweight including obesity (BMI ≥23 kg/m2) was 7.1% among those aged <30 years and it increased with increasing age and reached a peak at 40-50 years of age. Then prevalence began to decrease and reached to 7.2% among those aged ≥60 years. This difference was statistically significant (χ2=14.18, df=4, p=0.007).
Prevalence of overweight or obesity was more among males (12.7%) compared to female (10.3%). But this difference was not statistically significant (χ2=0.74, df=1, p=0.39).
Only 24 (10.5%) males had abdominal adiposity according to waist circumference criteria (WC ≥90 cm). Out of 311 females 36 (11.6%) had abdominal adiposity according to waist circumference criteria (WC ≥80 cm). Out of 229 male study subjects 38 (16.6%) had abdominal adiposity according to waist hip ratio criteria (WHR ≥0.9) and out of 311 females 42 (13.5%) had abdominal adiposity according to waist hip ratio criteria (WHR ≥0.8).
DISCUSSION
overall prevalence rate of hypertension was 22.8% amongst nomad tribe groups of Rajasthan.4 Yadav et al showed that the prevalence of hypertension was 32.2 per cent.14 This finding was comparable to this study. Around 3/4th of the study participants performed work related vigorous activity for at least 10 minutes continuously. Level of vigorous activity performed by them had been found above the recommended level i.e., 75 minutes or 600 METS per week. Around 91% of the individuals performed work related moderate intensity activity for at least 10 minutes continuously. Performed level of moderate intensity activity had been found above the recommended level i.e. 150 minutes or 600 METS per week. Mandal et al reported that moderate intensity activity is performed by only 44.7% individuals.12 Around 60% individuals performed „active transport‟ for at least 10 minutes continuously. Only 7.4% individuals participated in strenuous sports. A total of 63.5% individuals were addicted to any form of tobacco (smoking/tobacco chewing). Manimunda et al reported that among Nicobarese tribes 88 % individuals were addicted to tobacco.13 In our study prevalence of current smoking was only 9.1%. Around 20% of tribal males were daily smokers. There was no female smoker in the present study. Among the daily smokers, 37% started smoking before the age of 18 years i.e., before the permitted age for buying tobacco products. Yadav et al reported that overall prevalence of smoking was 10.2%; among males it was 20.3% and no female admitted to smoking.14 This is comparable to the present study. NNMB report revealed that prevalence of smoking was 35.9% among males, which is higher compared to this present study.11 About 60% individuals chewed tobacco. Around 73% of males were tobacco chewers whereas in case of females it was about 50%. There was significant association between tobacco chewing and gender (p<0.001). About half of the daily tobacco chewers (48%) started tobacco chewing before the age of 18 years i.e., before the permitted age for buying tobacco products. NNMB report showed that prevalence of tobacco chewing was 38% among males and 23% in females, which is much lower compared to this present study.11 About 49% individuals were current alcohol consumers. Around 64% of males were current alcohol consumers whereas in case of females it was about 38%. This difference was found statistically significant (p<0.001). Among the current drinkers 136 (51.5%) started drinking before the age of 21 years i.e. before the legal age for drinking in West Bengal.
About 91% individuals took extra salt with meals. None of the individuals took fruit at least once a week. The proportion of fish, chicken and milk intake for at least once a week was also very low i.e., 8.9%, 3.3% and 2.9% respectively. According to BMI grading only 7.8% individuals were overweight, only 3.5% were obese and 37.4% were chronic energy deficient (BMI <18.5). Madhukumar et al showed that 51.96% individuals were thin (BMI <18).16 Mean BMI of the male study
participants was 19.94±2.49 and that of female was 19.22±2.79. Krishnan et al reported mean BMI among males is 20.4 and among female it was 21 i.e. mean BMI of female was more than male.15 But in the present study mean BMI of male was more than female. In the present study mean WC of the male study participants was 75.92±9.19 and that of female was 68.55±7.68. Krishnan et al reported mean WC among males is 77.4 and among female it was 74.3 i.e., mean WC of male was more than female.15 This is comparable to the present study. According to waist circumference criteria, prevalence of abdominal adiposity was 10.5% and 11.6% among males and females respectively. Whereas, according to waist hip ratio criteria, abdominal adiposity was present in 16.6% males and 13.5% females respectively.
CONCLUSION
The study revealed high prevalence of risk factors of cardiovascular diseases among tribal population of the region. Tobacco chewing and alcohol consumption were highly prevalent in this study. Prevalence of extra salt intake was also higher which could be a significant risk factor of cardiovascular disease. Maximum individuals were within normal BMI range. Physical activity level was higher among the study participants which could have protective effects against development of cardiovascular diseases.
So, there is need for strengthening health education programs to promote adoption of preventive measures against chronic non-communicable diseases especially cardiovascular diseases among the tribal population. Identification of community specific risk factors might help in implementation of health programmes at grass root level for reduction of incidence of cardiovascular diseases among the tribal population.
Funding: No funding sources Conflict of interest: None declared
Ethical approval: The study was approved by the Institutional Ethics Committee
REFERENCES
1. WHO. Integrated NCD management and prevention. Available at: http:// www.who.int. Accessed on 6th October 2014.
2. WHO. Noncommunicable diseases. Updated March 2013. Available at: http://www.who.int/ mediacentre / factsheets/fs355/en/. Accessed on 6 October 2014. 3. Health on the March 2011-2012; State Bureau of
Health Intelligence, Directorate of Health Services, Government of West Bengal.
4. Sachdev B. Prevalence of hypertension and associated risk factors among Nomad Tribe groups. Antrocom Online J Anthropol. 2011;7(2):181-9. 5. Das SK, Sanyal K, Basu A. Study of urban
prevalence of hypertension in a developing country. Int J Med Sci. 2005;2(2):70-8.
6. Momin M, Desai V, Kavishwar A. A study on effect of life style risk factors on prevalence of hypertension among white collar job people of Surat. Int J Occu Health. 2009;1(1):1-13.
7. WHO. The WHO step wise approach to noncommunicable disease risk factor surveillance (STEPS). Instrument v.3.0. Available at: http://www.who.int/chp/steps/instrument/STEPS_In strument_V3.1.pdf?ua=1. Accessed on 1 October 2018.
8. WHO. Global Physical Activity Questionnaire (GPAQ) Analysis Guide. Available at: http://www.who.int/chp/steps/resources/GPAQ_Ana lysis_ Guide.pdf Last accessed on 1 November 2018.
9. Sagare SM, Rajderkar SS, Girigosavi BS. Certain modifiable risk factors in essential hypertension: a casecontrol study. Nat J Comm Med. 2011;2(1):9-13.
10. Smoking. Available at: www.thl.fi/publications/ ehrm/product1/ section7.htm. Accessed on 1 November 2018.
11. Diet and Nutritional status of tribal population and prevalence of hypertension among adults, National Nutrition Monitoring Bureau Technical Report No. 25. Hyderabad: National Institute of Nutrition; 2009. 12. Mandal PK, Sinha Roy AK, Chatterjee C, Mallik S, Manna N, Sardar JC, et al. Burden of Hypertension
and its risk factors in an urban community of India: Are we aware and concerned? Sudanese J Public Health. 2010;5(3):130-5.
13. Manimunda SP, Sugunan AP, Benegal V, Balakrishna N, Rao MV, Pesala KS. Association of hypertension with risk factors and hypertension related behaviour among the aboriginal Nicobarese tribe living in Car Nicobar Island, India. Ind J Med Res. 2011;133(3):287-93.
14. Yadav S, Boddula R, Genitta G, Bhatia V, Bansal B, Kongara S, et al. Prevalence and risk factors of pre-hypertension and pre-hypertension in an affluent north Indian population. Indian J Med Res. 2008;128:712-20.
15. Krishnan A, Shah B, Lal V, Shukla DK, Paul E, Kapoor SK. Prevalence of risk factors for non-communicable disease in a rural area of Faridabad District of Haryana. Indian J Pub Health. 2008;52(3):117-24.
16. Madhukumar S, Gaikwad V, Sudeepa D. An epidemiological study of hypertension and its risk factors in rural population of Bangalore rural district. Al Ameen J Med Sci. 2012;5(3):264-70.