www.ijaera.org 2015, IJAERA - All Rights Reserved 264
Multi-objective Optimization of Hard Milling
Process using Evolutionary Computation
Techniques
A.Tamilarasan1*, D.Rajamani2
1Department of Mechanical Engineering, Sri Chandrasekharendra Saraswathi Vishwa Mahavidyalaya, Kanchipuram- 631 561, Tamilnadu, India
2Department of Mechanical Engineering, QIS College of Engineering and Technology, Ongole-523 272, Andhra Pradesh, India
* Corresponding author E-mail: [email protected]
Abstract: This paper focuses on determination of optimum cutting conditions for the efficient hard milling performance of the selected process parameters using hybrid method of response surface methodology and evolutionary computing approaches. A central composite rotatable design is used to design the experimentations. The responses of cutting temperature, tool wear and metal removal rate are measured and analysed the data to develop the mathematical models. The adequacies of the models are tested at 95% confidence level. To achieve the set goal of this study, genetic and simulated annealing algorithms are used for predicting and optimizing the process parameters. The result shows that the simulated annealing algorithm is effectively produced better optimal solutions than the genetic algorithm. The actual experimental results were in agreement with the prediction.
Keywords: Hard milling, central composite rotatable design, cutting temperature, tool wear, metal removal rate, optimization, genetic and simulated annealing algorithms
I.
INTRODUCTION
www.ijaera.org 2015, IJAERA - All Rights Reserved 265
of cutting temperature, tool wear and metal removal rate. A Central Composite Rotatable Design (CCRD) was used to design the experimentations. Design-expert version 6.0.8 package was used to analyze the data and to develop the models. The adequacy of the model was tested at 95% confidence level. Further, the developed models were employed with Genetic Algorithm (GA) and Simulated annealing Algorithm (SA) to determine the optimal process parameters resulting in minimum cutting temperature, tool wear and maximum metal removal rate. The evolutionary approaches widely applied to solve single and/or multi-objective problems in various fields [6-23].
II.
MODELING AND OPTIMIZATION OF HARD MILLING PROCESS
A. Response Surface Methodology
Response Surface Methodology (RSM) is a combination of statistical experimental design fundamentals, regression modeling techniques, and optimization methods [24]. The main advantage of RSM is the reduced number of experimental runs needed to provide sufficient information for statistically acceptable results. It is a faster and less expensive method for gathering research results than the classical method. The CCRD design is one of the most important experimental design used in process optimization studies. This design was applied in the present work with the objective to develop an empirical model of the process and to obtain a more precise estimate of the optimum operating conditions for the factors involved. The data obtained from the CCRD design was fitted with a second order polynomial equation to evaluate the parametric influences on the various hard milling criteria as follows
i j i j
ij i k i ii i k i
iX X X X
y 2
1 1
0 (1)
where y denotes the predicted response of the process, Xi refers to the coded levels of the factors, β0, βi, βii, and βij are the regression coefficients, and ε is the statistical error.The adequacy of the model was determined by evaluating the lack of fit, coefficient of regression (R2) and the Fisher test value (F-value) obtained from the analysis of variance (ANOVA).Statistical significance of the model and model variables was determined at the 5% probability level (p < 0.05). The software uses the quadratic model equation shown above to build response surfaces.
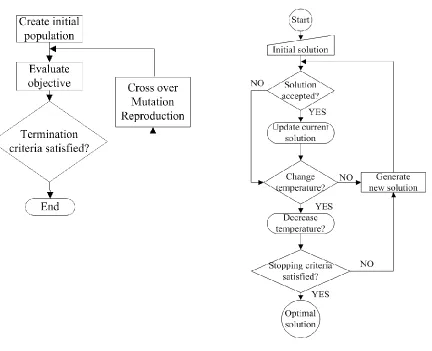
B. Genetic Algorithm
www.ijaera.org 2015, IJAERA - All Rights Reserved 266
Figure 1: GA and SA flow chart
C. Simulated Annealing Algorithm
www.ijaera.org 2015, IJAERA - All Rights Reserved 267
III. HARD MILLING EXPERIMENTS
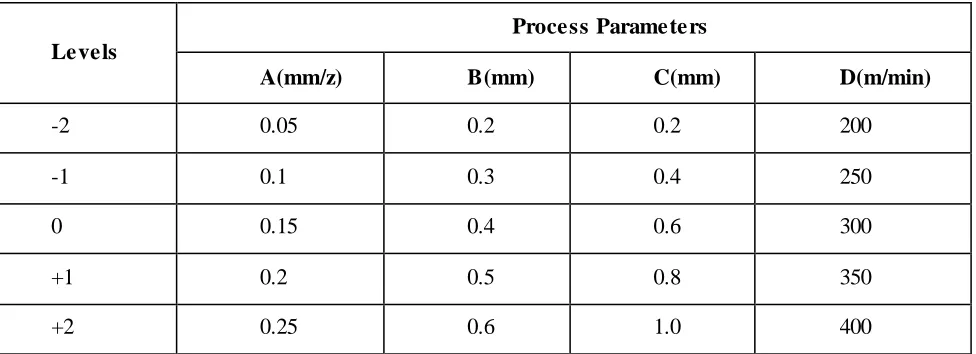
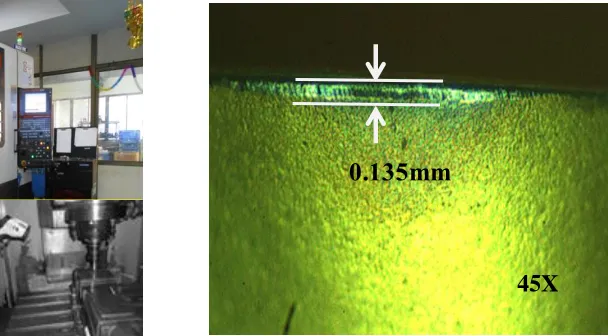
A CCRD was used to investigate the effects of four independent variables, feed per tooth (A), radial depth of cut(B), axial depth of cut(C) and cutting speed(D), on the dependent variables, CT,TW and MRR. The factors and levels used during the milling experiments are listed in Table I. Typical hardened and tempered 100MnCrW4 (AISI O1) tool steel (50HRC) was taken for analysis. The main applications are making molds, dies, gauges and bushings etc. All the specimens were in the form of 150 mm×150mm×25mm blocks. A series of 30 experiments with three replications was performed on CNC Mazak-Nexus 510C-II machine equipped with 12000rpm and 25KW power drive motor is used. A photograph of experimental setup is shown in Fig.2.
Table 1: Parameters and levels
Levels
Process Parameters
A(mm/z) B(mm) C(mm) D(m/min)
-2 0.05 0.2 0.2 200
-1 0.1 0.3 0.4 250
0 0.15 0.4 0.6 300
+1 0.2 0.5 0.8 350
+2 0.25 0.6 1.0 400
www.ijaera.org 2015, IJAERA - All Rights Reserved 268
Figure -2: Mazak VMC and cutting zone Figure-3- Tool wear for 4th Experiment
IV. RESULTS AND DISCUSSIONS
A. Empirical Regression Equations
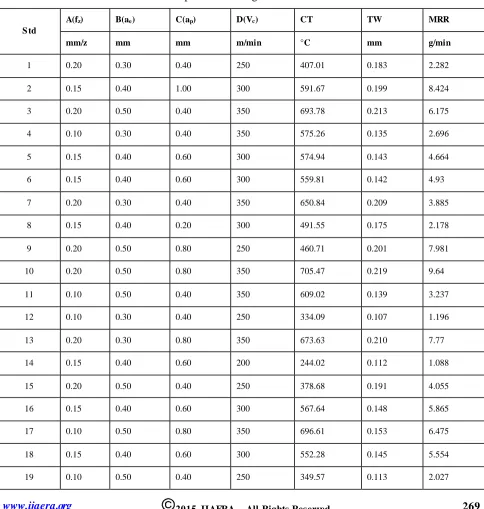
The Table II summarizes experimental design matrix with the results. A second order quadratic model has been intended to develop which will take into account the quadratic and interactive effects beside the individual factors. With the help of Design Expert software, the final mathematical models of the actual values of the CT in °C, TW in mm and MRR in g/min obtained at 95% confidence interval as follows:
CT(°C)=1207.1727+1996.746429×A+55.7226×B+529.527×C+6.51711×D-849.125×AC+2.2335×BD-0.897375×CD-3289.571429×A2-744.2678571×B2-0.00739×D2
(R2=0.9896) (2)
TW(mm)=+0.06604+0.1275×A-0.635833×B-0.21645×C+0.0010575×D-0.175×AC-0.0001625×CD+2.358×A2+0.8395×B2+0.266145833×C2-0.0000012×D2(R2=0.9975) (3)
MRR(g/min)=-26.331+25.3575×A+1.5279×B-5.3404×C+0.14648×D+41.675 ×AC
+15.19375×BC-77.725×A2-0.000213475×D2 (R2=0.9697) (4)
The goodness of the fit was expressed by the coefficient of determination (R2), which was 0.9896, 0.9975 and 0.9697 for CT, TW and MRR respectively. This indicates that 98.96%, 99.75% and 96.97% of variability in the each response could be explained by the model. This shows that the second-order model contains both quadratic and interaction terms and, thus, is more accurate.
B. Single Objective Optimization with GA and SA
Regression models are as a fitness function in both algorithms and so, the accuracy of these models is very vital in the performance of standard optimization. The GA and SA optimization of the hard milling process of regression models was simulated using a matlab codes. In both optimization procedures, the lower bound values and upper bound values are used as LB= [0.05 0.2 0.2 200] and UB= [0.25 0.6 1.0 400] respectively. The iteration in GA begins with a population of random strings
0.135mm
www.ijaera.org 2015, IJAERA - All Rights Reserved 269
representing the design or decision variables. Thereafter, each string is evaluated to find fitness value. The critical parameters in GA are the population size number of generations, mutation rate, etc. In case of SA, the parameters are varied one at a time randomly to obtain a new set of parameters. With each set of parameters, the objective function was determined and the difference in the objective function (Δf) with the old and new sets of parameters was calculated. If the new set of values improved the objective function, the move was accepted. Otherwise, the move was accepted with a probability of exp (Δf/T), where T is the simulated annealing temperature, a dummy variable that is used to control the acceptance of uphill moves. Initially, T was fixed at a higher value and periodically annealed by a proportional cooling schedule in the outer loop.
Table 2: Experimental design matrix with results
S td
A(fz) B(ae) C(ap) D(Vc) CT TW MRR
mm/z mm mm m/min °C mm g/min
1 0.20 0.30 0.40 250 407.01 0.183 2.282
2 0.15 0.40 1.00 300 591.67 0.199 8.424
3 0.20 0.50 0.40 350 693.78 0.213 6.175
4 0.10 0.30 0.40 350 575.26 0.135 2.696
5 0.15 0.40 0.60 300 574.94 0.143 4.664
6 0.15 0.40 0.60 300 559.81 0.142 4.93
7 0.20 0.30 0.40 350 650.84 0.209 3.885
8 0.15 0.40 0.20 300 491.55 0.175 2.178
9 0.20 0.50 0.80 250 460.71 0.201 7.981
10 0.20 0.50 0.80 350 705.47 0.219 9.64
11 0.10 0.50 0.40 350 609.02 0.139 3.237
12 0.10 0.30 0.40 250 334.09 0.107 1.196
13 0.20 0.30 0.80 350 673.63 0.210 7.77
14 0.15 0.40 0.60 200 244.02 0.112 1.088
15 0.20 0.50 0.40 250 378.68 0.191 4.055
16 0.15 0.40 0.60 300 567.64 0.148 5.865
17 0.10 0.50 0.80 350 696.61 0.153 6.475
18 0.15 0.40 0.60 300 552.28 0.145 5.554
www.ijaera.org 2015, IJAERA - All Rights Reserved 270 20 0.15 0.20 0.60 300 505.2 0.169 2.674
21 0.25 0.40 0.60 300 575.46 0.243 7.348
22 0.10 0.50 0.80 250 438.82 0.129 4.355
23 0.15 0.40 0.60 300 560.73 0.148 5.038
24 0.20 0.30 0.80 250 441.52 0.195 4.866
25 0.05 0.40 0.60 300 469.66 0.093 1.696
26 0.15 0.40 0.60 400 719.09 0.152 5.241
27 0.15 0.40 0.60 300 568.37 0.142 5.839
28 0.10 0.30 0.80 250 419.04 0.125 2.433
29 0.15 0.60 0.60 300 546.17 0.187 7.581
30 0.10 0.30 0.80 350 600.35 0.144 3.085
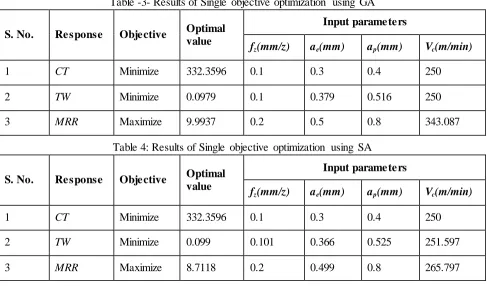
At any specific temperature, the parameters were randomly varied a number of times in the inner loop. Thus, the optimum parameter values were obtained after T reached a desired lower value. The results of single objective optimization of the responses are presented in Table 3 and 4. From the Tables 3 and 4, it is observed that different combinations of the optimal hard milling process parameters are attained by GA and SA for individual response.
Table -3- Results of Single objective optimization using GA
S. No. Response Objective Optimal value
Input parameters
fz(mm/z) ae(mm) ap(mm) Vc(m/min)
1 CT Minimize 332.3596 0.1 0.3 0.4 250
2 TW Minimize 0.0979 0.1 0.379 0.516 250
3 MRR Maximize 9.9937 0.2 0.5 0.8 343.087
Table 4: Results of Single objective optimization using SA
S. No. Response Objective Optimal value
Input parameters
fz(mm/z) ae(mm) ap(mm) Vc(m/min)
1 CT Minimize 332.3596 0.1 0.3 0.4 250
2 TW Minimize 0.099 0.101 0.366 0.525 251.597
www.ijaera.org 2015, IJAERA - All Rights Reserved 271
C. Multi-objective optimization with GA and SA
The CT, TW and MRR have been expressed separately as the non-linear functions of input variables, such as fz, ae, ap and Vc. Now, the goal was to minimize CT, TW and maximize MRR simultaneously, in the hard milling process. In order to find the set of input variables to satisfy both the above criteria, the problem formulation becomes a multi-objective optimization by considering three objective functions. The following combined objective function (i.e. minimization problem) is developed. max ) ( 1 min ) ( 2 min ) ( 1 ) 1 ( MRR MRR u Y w TW TW u Y w CT CT u Y w Z
Min
(5)
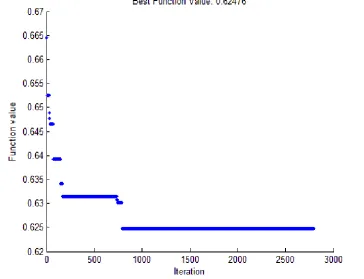
Where W1, W2 and W3 are the weight values assigned to CT, TW and MRR respectively, and CTmin and TWmin are the minimum values of CT and TW respectively, and MRRmax is the maximum value of MRR. The minimum and maximum values of the responses are obtained from the single objective optimization results in both GA and SA. In this present optimization study, for each response the equal priority was considered, i.e. W1=W2=W3=0.333. The convergence history of the GA is illustrated in Fig.4.
It is clear from the figure that no substantial change in the fitness value is observed after 38 generations. This indicates that, the parameters have reached the optimum values, ensuring minimum cutting temperature, tool wear and maximum material removal rate. The suitable parameters for GA computations as population size, number of generations, scattered crossover, uniform mutation and selection are 160, 90, 0.75, 0.20 and tournament selection respectively. Similarly, the convergence history of the SA is illustrated in Fig.5. The best fitness attained during each iteration of the simulated annealing algorithm optimization decreased till it became relatively constant after 750 generations. In case of SA computations, the parameters are annealing function, annealing interval, initial temperature and data type set as Boltzmann annealing, 100,100 and double respectively. The desired optimal values for GA and SA are shown in Table 5. The objective solution of SA is better than GA was observed in Table 5.
D. Verification
www.ijaera.org 2015, IJAERA - All Rights Reserved 272
Figure 4: Best fitness (lowest MSE value) versus generation during the optimization procedure of GA
www.ijaera.org 2015, IJAERA - All Rights Reserved 273
Table 5: Multi-objective optimization results using GA and SA
Optimization
method Z
Optimal values Input parameters
CT TW MRR fz ae ap Vc
°C mm g/min mm/z mm mm m/min
GA 0.63695 362.238 0.10145 2.1169 0.1 0.438 0.495 250
SA 0.62476 367.916 0.10541 2.58054 0.1 0.469 0.523 250.412
Table 6: Optimal conditions and confirmation runs of two different approaches
Optimization method
Optimal values Input parameters
fz ae ap Vc
CT(°C) TW(mm) MRR(g/min)
Pred./Exp. Pred./Exp. Pred./Exp.
GA 0.1 0.438 0.495 250 362.237/361.543 0.101/0.093 2.116/2.104
SA 0.1 0.469 0.523 250.4 367.915/365.647 0.105/0.089 2.58/2.234
V.
CONCLUSION
The present article investigates multi-objective optimization of process parameters in hard milling of 100MnCrW4 (Type O1) cold work tool steel using evolutionary algorithms. Following conclusions can be drawn on the basis of results obtained:
1. A central composite rotatable design was effectively used for experiments and to develop the regression models.
2. The predicted values match the experimental values reasonably well, with R2 of 0.9896 for CT, R2 of 0.9975 for TW and R2 of 0.9697for MRR.
3. The GA and SA offer simple and effective tools for searching the optimal cutting conditions effectively.
4. The objective solution of SA is better than GA was obtained.
5. The validity of the optimized results was checked by conducting conformity test, and the error is less than ±5% achieved.
6. The selection of optimum values is essential for the process automation and implementation of a computer-integrated manufacturing system.
REFERENCES
www.ijaera.org 2015, IJAERA - All Rights Reserved 274
[2] Gopalsamy, B.M.; Mondal, B.; Ghosh, S.; Arntz, K.; Klocke, F. (2009). Investigations on hard machining of Impax Hi Hard tool steel, International Journal of Material forming, Vol.2, pp.145-165.
[3] Ding, T.; Zhang, S.; Wang, Y.; Zhu, X. (2010). Empirical models and optimal cutting parameters for cutting forces and surface roughness in hard milling of AISI H13 steel, International Journal of Advanced Manufacturing Technology, Vol.51, pp.45-55.
[4] Okada, M.;Hosokawa, A.; Tanaka R.; Ueda, T. (2011). Cutting performance of PVD-coated carbide and CBN tools in hard milling, International Journal of Machine Tools & Manufacture, Vol. 51, pp.127-132. [5] Çalışkan, H.; Kurbanoğlu, C.; Panjan, P.; Kramar, D.(2012). Investigation of the performance of carbide
cutting tools with hard coatings in hard milling based on the response surface methodology, International Journal of Advanced Manufacturing Technology, Vol.66, Nos. 5-8, pp.883-893.
[6] Sivasakthivel, P.S.; R. Sudhakaran,R. (2013). Optimization of machining parameters on temperature rise in end milling of Al 6063 using response surface methodology and genetic algorithm, International Journal of Advanced Manufacturing Technology, Vol.67, pp.2313-2323.
[7] Suresh Kumar Reddy, N.; VenkateswaraRao,P. (2006). Selection of an optimal parametric combination for achieving a better surface finish in dry milling using genetic algorithms, International Journal of Advanced Manufacturing Technology, Vol.28, pp.463-473.
[8] Zain, A, M.; Haron, H.; Sharif, S. (2010). Application of GA to optimize cutting conditions for minimizing surface roughness in end milling machining process, Expert Systems with Applications,Vol.37,pp.4650-4659.
[9] Senthilkumar, N.;Tamizharasan, T.; Anandakrishnan, V. (2013). An ANN approach for predicting the cutting inserts performances of different geometries in hard turning, Advances in Production Engineering &Management, Vol. 8, no. 4, pp.231-241.
[10]JaliliSaffar, R.; Razfar, M.R.(2010). Simulation of end milling operation for predicting cutting forces to minimize tool deflection by genetic algorithm, Machining Science and Technology: An International Journal, Vol.14, no.1, pp.81-101.
[11] Zain, A, M.; Haron, H.;Sharif, S. (2010). Simulated annealing to estimate the optimal cutting conditions for minimizing surface roughness in end milling Ti-6Al-4V, Machining Science and Technology: An International Journal, Vol.14, no.1, pp.43-62.
[12] Hrelja, M.; Klancnik, S.; Balic, J.; Brezocnik, M. (2014). Modelling of a turning process using the Gravitational Search Algorithm, International Journal of Simulation Modelling, Vol. 13, No. 1, 30-41. [13] Oktem, H. (2009). An integrated study of surface roughness for modeling and optimization of cutting
parameters during end milling operation, International Journal of Advanced Manufacturing Technology, Vol.43, pp.852–861.
[14] Gaitonde, V.N.; Karnik, S. R.; Davim, J.P. (2012). Optimal MQL and cutting conditions determination for desired surface roughness in turning of brass using genetic algorithms, Machining Science and Technology: An International Journal, Vol.16, no.2, pp.304-320.
[15]Colak, O. (2014). Optimization of machining performance in high-pressure assisted turning of Ti6Al4V alloy, Strojniski vestnik – Journal of Mechanical Engineering, Vol. 60, no. 10, pp.675-681.
[16] Kuruvila, N.; Ravindra H.V. (2011). Parametric influence and optimization of wire EDM of hot die steel, Machining Science and Technology: An International Journal, Vol.15, no.1, pp.47-75.
www.ijaera.org 2015, IJAERA - All Rights Reserved 275
[18] Zain, A, M.; Haron, H.; Sharif, S. (2011). Integration of simulated annealing and genetic algorithm to estimate optimal solutions for minimising surface roughness in end milling Ti-6AL-4V, International Journal of Computer Integrated Manufacturing, Vol.24, no.6, pp.574-592.
[19] Suresh, P.;Venkatesan, R.; Sekar, T.; Elango, N.;Sathiyamoorthy, V. (2014). Optimization of intervening variables in micro EDM of SS 316L using a Genetic Algorithm and Response-Surface Methodology, Strojniski vestnik – Journal of Mechanical Engineering, Vol. 60, no. 10, 656-66.
[20] Yang, S.H;, Srinivas, J.; Mohan, S.; Lee, D.M.;Balaji, S.(2009). Optimization of electric discharge machining using simulated annealing, Journal of Materials Processing Technology, Vol.209, pp.4471-4475.
[21] Zain, A, M.; Haron, H.; Sharif, S. (2011). Optimization of process parameters in the abrasive water jet machining using integrated SA–GA, Applied Soft Computing, Vol.11, pp. 5350-5359.
[22] Palanisamy, P.; Rajendran, I.; Shanmugasundaram, S. (2007).Optimization of machining parameters using genetic algorithm and experimental validation for end-milling operations, International Journal of Advanced Manufacturing Technology, Vol.32, pp.644-655.
[23] Liao, H.T.; Chen, Z.W. (2011). A study on fiber laser micro-spot welding of thin stainless steel using response surface methodology and simulated annealing approach, International Journal of Advanced Manufacturing Technology, Vol.11, pp.5350-5359.
[24] Montgomery, D. C. (2005).Design and analysis of experiments, 6th edition, John Wiley and Sons,