Original Research Article
Low serum vitamin D associated with prediabetes
Recep Ayhan
1, Betül Çavuşoğlu Türker
2, Süleyman Ahbab
2,
Fatih Türker
3, Hayriye Esra Ataoğlu
2INTRODUCTION
Prediabetes is the important predisposition to the development of type 2 diabetes mellitus. It is associated with increased cardiovascular risk and mortality. Prevention of prediabetes is important for protection from microvascular and macrovascular complications. According to Turkey Diabetes, Hypertension, Obesity
and Endocrinological Diseases Prevalence Study (TURDEP-II) data, the incidence of prediabetes in Turkish adult population has reached 30,4%.1 The incidence of prediabetes increases because of obesity, physical inactivity and metabolic syndrome. Up to 70% of prediabetic patients will develop diabetes mellitus in time.2 Impaired fasting glucose (IFG) defined as fasting glucose levels between 100 and 125 mg/dl and impaired
ABSTRACT
Background: This study is performed to evaluate vitamin D levels and metabolic parameters in patients with prediabetes, compared to healthy controls.
Methods: This study was conducted between October and December 2013 in İstanbul Haseki Training and Research Hospital, internal medicine department. We enrolled total 247 individuals, 122 prediabetic (PreDM) patients (79 female, 43 male) and 125 control healthy individuals (94 female, 31 male) between 20-65 ages who admitted randomizely to the outpatient clinic with non spesific complaints. FPG, urea, creatinine, calcium, phosphate, albumin, alkaline phosphatase, thyriod stimulan hormon (TSH), 25 hydroxy vitamin D (25[OH]D), parathormon (PTH), c-peptide, insulin were analyzed.
Results: Pre DM patients’ mean plasma 25[OH]D level (25.7±14.9 nmol/l) was statistically lower than the control group (31.4±17.8 nmol/l). Pre DM patients’ mean plasma insulin, c-peptide, calcium, PTH, HOMA-IR (10.8±8.7 IU/ml, 3.3±2.0 ng/ml, 9.7±0.4 mg/dl, 56.5±22.5 pg/ml, 3.0±2.68, respectively) levels were statistically higher than the control group’s (6.3±3.8 IU/ml, 2.4±1.0 ng/ml, 9.5±0.5 mg/dl, 44.0±16.0 pg/ml, 1.4±0.8, respectively) mean levels. There were negative correlations between 25[OH]D and BMI (r:- 0.13, p:0.03), FBG (r:- 0.14, p:0.02) and plasma insulin (r:-0.16, p:0.01) values. A multivariate logisitic regression model for prediabetes was performed and variables as female gender, age, HOMA-IR and lower 25[OH]D values were risk factors for pre DM.
Conclusions: Serumlow25[OH]D level correlated with insulin resistance and metabolic parameters in prediabetic patients. Also, it may play an important role in the development of type 2 diabetes.
Keywords: Serum 25[OH] vitamin D, Prediabetes, Metabolic syndrome
1Van Bahçesaray State Hospital, Internal Medicine Clinic, Van, Turkey 2
University of Health Sciences, Haseki Health Training and Research Hospital, Internal Medicine Clinic, Istanbul, Turkey
3Arnavutköy State Hospital, Internal Medicine Clinic, İstanbul, Turkey
Received: 22 June 2018
Revised: 26 July 2018
Accepted: 27 July 2018
*Correspondence:
Dr. Betül Çavuşoğlu Türker,
E-mail: [email protected]
Copyright: © the author(s), publisher and licensee Medip Academy. This is an open-access article distributed under the terms of the Creative Commons Attribution Non-Commercial License, which permits unrestricted non-commercial use, distribution, and reproduction in any medium, provided the original work is properly cited.
glucose tolerance (IGT) as 2nd hour plasma glucose after 75 grams OGTT levels between 140 and 199 mg/dl. Vitamin D deficiency can increase the risk of developing prediabetes, osteopenia, osteoporosis, cancer, hypertension, dementia and metabolic syndrome.3-5 Moreover, vitamin D is a risk factor for progression from prediabetes to diabetes.6 There are several hypothesis for vitamin D in pancreatic beta-cell function and regulation of insulin secretion. Regulation of insulin secretion by vitamin D is associated with calcium concentration because vitamin D effects indirectly regulation of calcium flux through the beta cells.7 Vitamin D stimulates the expression of insulin receptors and provides insulin sensitivity.8 Vitamin D deficiency can cause to glucose intolerance, decrease insulin secretion via inflammation.9 There is a strict relationship between serum vitamin D concentrations, diabetes and metabolic syndrome.10 The aim of this study was to evaluate vitamin D levels and metabolic parameters in patients with prediabetes, compared to healthy controls.
METHODS
Study participants
This study was conducted between October and December 2013 in Istanbul Haseki Training and Research Hospital, internal medicine department. We enrolled total 247 individuals, 122 prediabetic (PreDM) patients (79 female, 43 male) and 125 control healthy individuals (94 female, 31 male) between 20-65 ages who admitted randomizely to the outpatient clinic with non spesific complaints. Informed consent of patients and hospital’s local ethics commitee approvement were provided before the study. The American Diabetes Association (ADA) criteria for impaired fasting glucose were used to define PreDM as a fasting plasma glucose (FPG) level between 100 and 125 mg/dl. Individuals who had a chronic disease, infection, malabsorption, pregnants, drug addicts and smokers were excluded.
Anthropometric and laboratory measurements
Anthropometric measurements such as height (m), weight (kg), waist circumference (cm) were measured. Weight was measured with light clothing and without shoes. Waist circumference (WC) was measured between the lowest rib and the crista iliaca superior. Body mass index (BMI) was calculated as weight (kg) divided by height (m2). Systolic and diastolic blood pressure was measured twice with a mercury sphygmomanometer from the right arm of patients in a sitting position after 5 minutes of rest and average value was calculated. Blood sample parameters were analyzed after a 8 hours fasting in the morning for all participants. FPG, urea, creatinine, calcium, phosphate, albumin, alkaline phosphatase were measured by using Beckman Coulter AU-2700 analyzer, UK. Thyriod stimulan hormon (TSH), 25 hydroxy vitamin D (25[OH]D), parathormon (PTH), c-peptide, insulin were measured by using Beckman Coulter DxI
800 analyzer, UK. Serum 25[OH]D levels were classified as; >75 nmol/l vitamin D sufficiency; 50–75 nmol/l vitamin D insufficiency and <50 nmol/l vitamin D deficiency. Within the deficiency category serum levels of 25[OH]D were further classified as; 25-49 nmol/l deficiency, <25 nmol/l severe deficiency. The homeostasis model assessment for insulin resistance (HOMA-IR) was calculated with the following formula; fasting blood glucose (mg/dl) × fasting insulin (mU/ml)/ 405.
Statistical analysis
Statistical analysis was carried out by using SPSS for Windows version 17.0. Results were expressed as mean ± standard deviation. Kolmogorov Smirnov Z test was performed to determine the distribution of variables for each patients group. Regular variances were assessed with t test and irregulars with Mann-Whitney U test. The Pearson and the Spearman tests were performed to analyze the correlation between variables. Chi square test was used to evaluate categorical variables. A p value <0.05 was statistically significant.
RESULTS
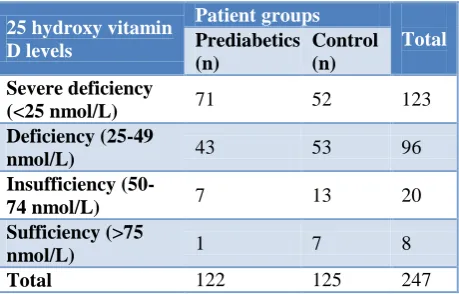
Participants were divided into four groups according to 25[OH]D and displayed a significant decrese in plasma 25[OH]D values (Table 1).
Table 1: Prediabetic patients and controls healthy groups’ 25 Hydroxy Vitamin D values.
25 hydroxy vitamin D levels Patient groups Total Prediabetics (n) Control (n) Severe deficiency
(<25 nmol/L) 71 52 123
Deficiency (25-49
nmol/L) 43 53 96
Insufficiency
(50-74 nmol/L) 7 13 20
Sufficiency (>75
nmol/L) 1 7 8
Total 122 125 247
significantly elevated in female and male patients with PreDM (Table 4 and 5). There were negative correlations between 25[OH]D and BMI (r: 0.13, p: 0.03), FBG (r: 0.14, p: 0.02) and plasma insulin (r: 0.16, p: 0.01) values
(Table 6). A multivariate logisitic regression model for prediabetes was performed and variables as female gender, age, HOMA-IR and lower serum 25[OH]D were risk factors for PreDM (Table 7).
Table 2: Comparison of age, anthropometric and blood pressure measurements to each groups.
Parameters Groups Mean value Std. deviation P value
Age (years) Control 33.3 8.0 <0.001
Prediabetics 39.9 8.8
SBP (mmHg) Control 106.0 6.4 <0.001
Prediabetics 123.8 12.4
DBP (mmHg) Control 67.2 6.2 <0.001
Prediabetics 76.8 9.5
WC (cm) Control 82.0 10.2 <0.001
Prediabetics 95.5 10.7
BMI Control 24.4 4.1 <0.001
Prediabetics 30.3 5.5
(SBP: systolic blood pressure, DBP: diastolic blood pressure, WC: waist circumference, BMI: body mass index, Std: standard)
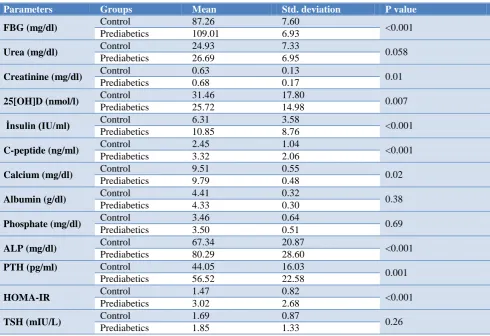
Table 3: Comparison of the laboratory parameters between each groups.
Parameters Groups Mean Std. deviation P value
FBG (mg/dl) Control 87.26 7.60 <0.001
Prediabetics 109.01 6.93
Urea (mg/dl) Control 24.93 7.33 0.058
Prediabetics 26.69 6.95
Creatinine (mg/dl) Control 0.63 0.13 0.01
Prediabetics 0.68 0.17
25[OH]D (nmol/l) Control 31.46 17.80 0.007
Prediabetics 25.72 14.98
İnsulin (IU/ml) Control 6.31 3.58 <0.001
Prediabetics 10.85 8.76
C-peptide (ng/ml) Control 2.45 1.04 <0.001
Prediabetics 3.32 2.06
Calcium (mg/dl) Control 9.51 0.55 0.02
Prediabetics 9.79 0.48
Albumin (g/dl) Control 4.41 0.32 0.38
Prediabetics 4.33 0.30
Phosphate (mg/dl) Control 3.46 0.64 0.69
Prediabetics 3.50 0.51
ALP (mg/dl) Control 67.34 20.87 <0.001
Prediabetics 80.29 28.60
PTH (pg/ml) Control 44.05 16.03
0.001
Prediabetics 56.52 22.58
HOMA-IR Control 1.47 0.82 <0.001
Prediabetics 3.02 2.68
TSH (mIU/L) Control 1.69 0.87 0.26
Prediabetics 1.85 1.33
(Std: Standard, FBG: fasting blood glucose, 25[OH]D: 25 hydroxy vitamin D, ALP: alkaline phosphatase, PTH: parathormon, HOMA-IR: homeostasis model assessment for insulin resistance, TSH: thyroid stimulating hormon).
Table 4. Comparison of parameters of female participants.
Parameters Groups Mean Std. deviation P value
FBG (mg/dl) Control 87.69 7.25 <0.001
Prediabetics 107.96 6.26
Urea (mg/dl) Control 23.22 6.68 0.36
Prediabetics 24.56 6.27
Parameters Groups Mean Std. deviation P value
Creatinine (mg/dl) Control 0.58 0.09 0.42
Prediabetics 0.58 0.10
25[OH]D (nmol/l) Control 28.34 16.07 0.002
Prediabetics 21.28 13.36
İnsulin (IU/ml) Control 6.23 3.04 <0.001
Prediabetics 10.96 7.78
C-peptide (ng/ml) Control 2.40 0.91 <0.001
Prediabetics 3.11 1.32
Calcium (mg/dl) Control 9.54 0.53 0.17
Prediabetics 9.66 0.42
Albumin (g/dl) Control 4.48 0.35 0.07
Prediabetics 4.35 0.30
Phosphate (mg/dl) Control 3.42 0.51 0.45
Prediabetics 3.52 0.54
ALP (mg/dl) Control 64.06 20.48 <0.001
Prediabetics 81.24 32.31
PTH (pg/ml) Control 45.13 16.63 <0.001
Prediabetics 59.30 21.15
Homa-ır Control 1.34 0.75 <0.001
Prediabetics 3.09 2.36
TSH (mıu/L) Control 1.70 0.87 0.06
Prediabetics 1.91 1.29
(Std: Standard, FBG: fasting blood glucose, 25[OH]D: 25 hydroxy vitamin D, ALP: alkaline phosphatase, PTH: parathormon, HOMA-IR: homeostasis model assessment for insulin resistance, TSH: thyroid stimulating hormon).
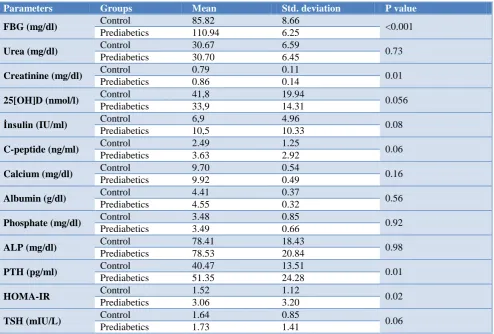
Table 5: Comparison of parameters of male participants.
Parameters Groups Mean Std. deviation P value
FBG (mg/dl) Control 85.82 8.66 <0.001
Prediabetics 110.94 6.25
Urea (mg/dl) Control 30.67 6.59 0.73
Prediabetics 30.70 6.45
Creatinine (mg/dl) Control 0.79 0.11 0.01
Prediabetics 0.86 0.14
25[OH]D (nmol/l) Control 41,8 19.94 0.056
Prediabetics 33,9 14.31
İnsulin (IU/ml) Control 6,9 4.96 0.08
Prediabetics 10,5 10.33
C-peptide (ng/ml) Control 2.49 1.25 0.06
Prediabetics 3.63 2.92
Calcium (mg/dl) Control 9.70 0.54 0.16
Prediabetics 9.92 0.49
Albumin (g/dl) Control 4.41 0.37 0.56
Prediabetics 4.55 0.32
Phosphate (mg/dl) Control 3.48 0.85 0.92
Prediabetics 3.49 0.66
ALP (mg/dl) Control 78.41 18.43 0.98
Prediabetics 78.53 20.84
PTH (pg/ml) Control 40.47 13.51 0.01
Prediabetics 51.35 24.28
HOMA-IR Control 1.52 1.12 0.02
Prediabetics 3.06 3.20
TSH (mIU/L) Control 1.64 0.85 0.06
Prediabetics 1.73 1.41
Table 6: Correlation between 25[OH]D and age with metabolic variables for all patients.
Age BMI WC FBG c-peptide Insulin
25[OH]D r -0.091 -0.135 0.022 -0.149 -0.120 -0.162
P 0.154 0.037 0.734 0.020 0.116 0.012
Table 7: A multivariate logistic regression analysis for prediabetes with associated risk factors for all patients.
P value OR 95% CI
Gender (female) 0.004 3.22 1.45 – 7.18
Age 0.0001 1.10 1.06 – 1.15
HOMA-IR 0.0001 3.51 2.26 – 5.45
25[OH] D 0.008 0.97 0.94 – 0.99
(OR: odds ratio, 95% CI: confidence interval, HOMA-IR: homeostasis model assessment for insulin resistance, 25[OH]D: 25 hydroxy vitamin D).
DISCUSSION
The frequency of diabetes mellitus increases rapidly due to industrial life and nutrition. Prediabetes is the predisposition to the development of type 2 diabetes mellitus. Recent studies have shown a relationship between vitamin D deficiency and development of type 2 diabetes mellitus (DM). Lower serum vitamin D levels may play role in the pathogenesis of prediabetes.11 Its protective effects perform through the immunological system and calcium metabolism.12 PTH levels were statistically higher in prediabetic patients and parathormone increases as negative feedback to low vitamin D level. Lower serum vitamin D levels effect glucose homeostasis and parathyroid hormone concentrations in patients with prediabetes.13,14 In this study, serum 25-OH vitamin D levels were sufficient in 5 patients (% 2.05), insufficient in 20 patients (% 8,2), deficient in 96 patients (% 39,36), severe deficient in 123 patients (%50,43). Plasma PTH, HOMA-IR, systolic and diastolic blood pressure, waist circumference and BMI values were statistically higher in PreDM patients compared to control group. There was an increase in the presence of metabolic parameters in patients with prediabetes. Gupta et al, suggested that 25[OH]D levels were lower in prediabetic patients and affected by age, sex and BMI.15 There were negative correlations between serum 25[OH]D level and BMI and fasting blood glucose in the study. Moreover, low serum 25[OH]D level was strictly correlated with elevated insulin level (r: 0.162, p: 0.012). The risk of insulin resistance was increased in patients with vitamin D deficiency. Forouhar et al demonstrated that there is negative correlation between insulin resistance and 25[OH]D level.16 In prediabetic patients, pancreatic early phase insulin release is impaired, together with increased serum insulin levels.17,18 This situation accelerates the development of insulin resistance and overt diabetes in prediabetic patients.19 In our study, the risk of developing insulin resistance in prediabetic subjects was found to be 3.5-fold increased. Female gender, age and 25[OH]D level were another additional risks for prediabetes.
CONCLUSION
Increase in serum vitamin D levels enhances the progression of prediabetes affecting insulin resistance. Low 25(OH)D levels might have contributed to the incidence of prediabetes.
Funding: No funding sources Conflict of interest: None declared
Ethical approval: The study was approved by the Institutional Ethics Committee
REFERENCES
1. Satman I, Omer B, Tutuncu Y, Kalaca S, Gedik S, Dinccag N, et al. Study Group twelve year trends in the prevalance and risk factors of diabetes and prediabetes in Turkish adults. Eur J Epidemiol. 2013;28(2):169-80.
2. Tabak AG, Herder C, Rathmann W, Brunner EJ, Kivimäki M. Prediabetes: A high-risk state for diabetes development. Lancet. 2012;379:2279–90. 3. Abbasi F, Blasey C, Feldman D, Caulfield MP,
Hantash FM, Reaven GM. Low circulating 25-hydroxyvitamin D concentrations are associated with defects in insulin action and insulin secretion in persons with prediabetes. J Nutr. 2015;145(4):714– 9.
4. Mansuri S, Badawi A, Kayaniyil S, Cole DE, Harris SB, Mamakeesick M, et al. Associations of circulating 25 (OH) D with cardiometabolic disorders underlying type 2 diabetes mellitus in an Aboriginal Canadian community. Diabetes Res Clin Pract. 2015;109(2):440–9.
5. Carlsson M,Wanby P, Brudin L, Lexne E, Mathold K, Nobin R, et al. Older swedish adults with high
self-perceived health show optimal
25-hydroxyvitamin D levels whereas vitamin D status is low in patients with high disease burden. Nutrients. 2016;8(11):717.
incidence of type 2diabetes in high-risk Asian subjects. Am J Clin Nutr. 2013;97:524–30.
7. Sergeev IN, Rhoten WB. 1,25-Dihydroxyvitamin D3 evokes oscillations ofintracellular calcium in a
pancreatic beta-cell line. Endocrinol.
1995;136(7):2852-61.
8. Gupta, AK, Brashear MM, Johnson WD.
Prediabetes and prehypertension in healthy adults are associated with low vitamin D levels. Diabetes Care. 2011;34(3):658-60.
9. Joergensen C, Gall MA, Schmedes A, Tarnow L, Parving HH, Rossing P. Vitamin D levels and mortality in type 2 diabetes. Diabetes Care. 2010;33:2238-43.
10. Ford ES, Ajani UA, McGuire LC, Liu S. Concentrations of serum vitamin D and the metabolic syndrome among U.S. adults. Diabetes Care. 2005;28:1228-30
11. Maestro B, Dávila N, Carranza MC, Calle C. Identification of a Vitamin D response element in the human insulinreceptor gene promoter. J Steroid Biochem Mol Biol. 2003;84(2-3):223-30.
12. Zhang M, Gao Y, Tian L, Zheng L, Wang X, Liu W, et al. Association of serum 25-hydroxyvitamin D3 with adipokines and inflammatory marker in personswith prediabetes mellitus. Clin Chim Acta. 2017;468:152-8.
13. Karras SN, Anagnostis P, Antonopoulou V, Tsekmekidou X, Koufakis T, Goulis DG, et al. The combined effect of vitamin D and parathyroid hormone concentrations on glucose homeostasis in
older patients with prediabetes: A cross-sectional study. Diab Vasc Dis Res. 2018;15(2):150-3. 14. Gandhe MB, Jain K, Gandhe SM. Evaluation of 25
(OH) vitamin D with reference to magnesium status and insulin resistance in T2DM. J Clin Diagn Res. 2013;7(11):2438-41.
15. Gupta AK, Brashear MM, Johnson WD. Low vitamin D levels, prediabetes and prehypertension in healthy African American adults. Nutr Metab Cardiovascul Dis. 2012;22(10):877-82.
16. Forouhi NG, Luan JE, Cooper A, Boucher BJ, Wareham NJ. Baseline serum 25-hydroxy vitamin D in the future glycemic status and insulin resistance medical research council ely prospective study 1990-2000. Diabetes. 2008;57(10):2619-25.
17. Khetan AK, Rajagopalan S. Prediabetes. Can J Cardiol. 2018;34(5):615-23.
18. Mitri J, Muraru MD, Pittas AG. Vitamin D and type 2 diabetes: a systematic review. Europ J Clin Nutr. 2011;65:1005–15.
19. Kim CH, Kim HK, Kim EH, Bae SJ, Choe J, Park JY. Longitudinal Changes in Insulin Resistance, Beta-Cell Function and Glucose Regulation Status in Prediabetes. Am J Med Sci. 2018;355(1):54-60.
![Table 6: Correlation between 25[OH]D and age with metabolic variables for all patients](https://thumb-us.123doks.com/thumbv2/123dok_us/1291975.1635953/5.595.49.552.165.229/table-correlation-oh-d-age-metabolic-variables-patients.webp)