Original Research Article
Prevalence and factors associated with overweight and obesity among
elderly people in a semi-urban area of Chennai
Rajkamal R.
1, Manikandan Seralathan
1, Jayakiruthiga S.
2INTRODUCTION
Obesity is a medical condition in which excess body fat has accumulated that increases the risk of many adverse health conditions.1 The main cause of obesity due to the
imbalance between calorie intake and energy
expenditure.Obesity being an risk factor facilitates the onset and severity of non communicable diseases. Body mass index (BMI) is widely used to determine whether a person is affected by excess weight or obesity. This is a measurement that accounts for a person weight and
height. As the BMI increases, the likelihood of being affected by obesity increases as well. It’s commonly known and scientifically proven that obesity predisposes to many diseases. In fact, the majority of organs and body systems are negatively affected by obesity. Diabetes, hypertension, high cholesterol, heart disease, physical disability and certain cancers are encountered in patients affected by obesity. According to WHO report 2016, more than 1.9 billion adults aged 18 years and above were overweight. Among them 650 million adults were obese. The prevalence of overweight was found to be
ABSTRACT
Background: Obesity is a medical condition in which excess body fat has accumulated that increases the risk of many adverse health conditions. Obesity being a risk factor facilitates the onset and severity of non-communicable diseases. The objectives of the study were to determine the prevalence of overweight and obesity among elderly people residing in a semi urban area of Chennai and to measure the association between selected factors associated with overweight and obesity among the study population.
Methods: A community-based cross-sectional study was carried out in Adayalampet and Nazrathpet, a semi urban area near Chennai, which comes under the field practice area of Department of Community Medicine ACS medical college, Chennai, Tamil Nadu India, during the month of November. Study population included 251 elderly aged 60 years and above. Data were collected by house-to-house survey using pre designed questionnaire and analyzed using SPSS software, version 16.0. Simple proportions were calculated, and chi square test was applied for statistical significance; p value <0.05 was considered as statistically significant.
Results: The prevalence of overweight was found to be 30.7% with a 95% CI (24.99-36.41) and obesity was 8.3% (4.89-11.71). Diet, alcohol consumption, physical activity gender, education are associated with overweight/obesity and were statistically significant.
Conclusions: The prevalence of overweight and obesity, among elderly people was moderate to high among our study population. Hence concerned efforts through behavior change communication intervention are required to reduce the burden of overweight/obesity among the community.
Keywords: Overweight/obesity, Elderly, Prevalence, Semi urban area
Department of Community Medicine, 1ACS Medical College; 2Sree Balaji Medical College and Hospital, Chennai, Tamil Nadu, India
Received: 28 July 2018
Revised: 13 August 2018
Accepted: 14 August 2018
*Correspondence:
Dr. Rajkamal R.,
E-mail: [email protected]
Copyright: © the author(s), publisher and licensee Medip Academy. This is an open-access article distributed under the terms of the Creative Commons Attribution Non-Commercial License, which permits unrestricted non-commercial use, distribution, and reproduction in any medium, provided the original work is properly cited.
almost equal among male and females and slightly higher prevalence of obesity (15%) among women than men (11%). The worldwide prevalence of obesity nearly tripled between 1975 and 2016.2 Non communicable risk factor survey conducted in many states of India between 2007-2008 showed high prevalence of overweight in all the age groups except in 15-24 years group, the prevalence of overweight was higher among females than males and in urban areas.3 According to the Indian Council of Medical Research, NCDs accounts for more than half of all the causes of mortality in India. The proportion of elderly population in India is increasing and projected to be 326 million by 2050.4 Overweight and obesity affects all age groups including elderly people. The risk of NCD which is higher among elderly further increases if the individual is obese or overweight. Obesity is a preventable condition with behavioural and lifestyle changes. Supportive environments and communities are fundamental in shaping people’s choices of healthy lifestyles. Only limited studies are conducted on overweight and obesity among elderly individuals in south India. Therefore this study was planned to find out the prevalence and associated factors with overweight and obesity among elderly people in our field practice area near Chennai.
Objectives
To determine the prevalence of overweight and obesity among elderly people residing in a semi urban area of Chennai.
To measure the association between selected factors associated with overweight and obesity among the study population.
METHODS
A community-based, cross-sectional study was carried out in (Adayalampattu and Nazrathpet) in November 2015. Elderly population aged 60 years and above who are residing in the study area were included in the study. Those people who are critically ill and mentally challenged i.e., not able to comprehend and give response to the survey were excluded from the study. The sample size was calculated based on the literature review, with the prevalence of overweight and obesity among elderly people (37%) from Singh, et al study done in Delhi, with 95% Confidence interval and 17% of relative precision, calculated sample size was 236.5 Sample size achieved was 251. In the study area, individuals were interviewed using a structured questionnaire. The questionnaire was designed by the research team. Face validity and Content validity of the questionnaire had been checked. Questionnaire captured data regarding socio demographic details of the study population, dietary behaviours, history of alcohol and smoking, physical measurements etc. Data was collected by trained interns (Provisional MBBS doctors in their internship periods). The first house in both the areas was selected randomly and the subsequent houses were visited till the required sample size was achieved. After getting their informed consent, investigator introduced themselves to the family
members, all information were obtained from them and then moved on to the next house. Anthropometric measurements such as height, weight were measured for each participants. Data was entered in MS Excel & analyzed by SPSS (Statistical Package for Social Science) 17.0 version. Descriptive statistics like proportions were calculated, Chi square test was used to compare the proportions between the groups. P value less than 0.05 was considered as statistically significant.
Ethical considerations
Informed written consent was obtained from all the study participants before the start of data collection. Data collected was kept confidential and used only for research purpose.
Operational definitions
Elderly people: According to Govt. Of India, those individuals who have attained the age of sixty years and above, are defined as elderly people.6
Educational status7
Illiterate: Those who cannot read and write or no formal education.
Primary school: Those who studied/passed up to class V.
Middle school: Those who studied/passed up to class VIII.
High school: Those who studied/passed up to class IX/ X.
Higher secondary: Those who studied/passed up to class XI/ XII.
Graduate: Those who passed BA, B Sc. degree or its equivalent.
Post-graduate: Those who passed MA, M Sc., MBA, MCA, M Phil, M Tech, MD, MS, MDS or its equivalent.
Nuclear family: It consists of the married couple and their children while they are still regarded as dependants.8
Joint family: It consists of a number of married couples and their children who live together in the same household. All the men are related by blood and the women of the household are their wives, unmarried girls and widows of the family kinsmen.
Three generation family: This tends to be a household where there are representatives of three generations.
Body mass index9
Table 1:BMI classification.
BMI Classification
Less than 18.5 Underweight
18.5-24.99 Normal
25-29.99 Overweight/pre-obese
≥30 Obesity
Vegetarian: Those who consume only vegetarian food.
Mixed: Those who consume both vegetarian and non-vegetarian food.
Physical activity:Person doing mild physical activity like walking, yoga etc. for at least 10 minutes continuously per day.10
RESULTS
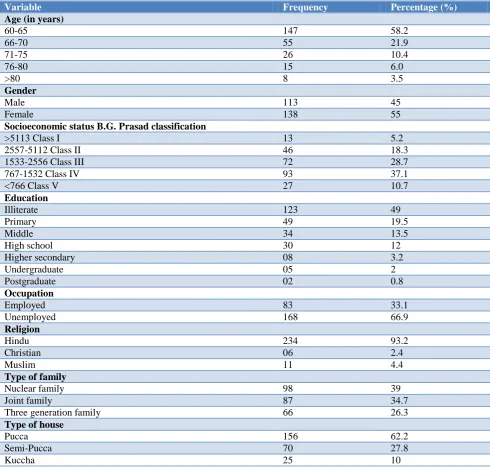
Out of 251 participants interviewed, majority of our study participants were in the age group of 60–65 years 147 (58.2) (Table 2) and most of study participants were females 138 (55%), according to modified B.G. Prasad classification (2014). Maximum of the study population belonged to Class 4 category of socio-economic status 93 (37.1%), about 123 (49%) of study participants were illiterates. Majority of study participants were unemployed 168 (66.9%). Maximum no of study participants were Hindus 234 (93.2%), majority of the participants are from nuclear family 98 (39%) and 156 (62.2%) are living in pucca house.
Table 2: Socio demographic profile of the study population.
Variable Frequency Percentage (%)
Age (in years)
60-65 147 58.2
66-70 55 21.9
71-75 26 10.4
76-80 15 6.0
>80 8 3.5
Gender
Male 113 45
Female 138 55
Socioeconomic status B.G. Prasad classification
>5113 Class I 13 5.2
2557-5112 Class II 46 18.3
1533-2556 Class III 72 28.7
767-1532 Class IV 93 37.1
<766 Class V 27 10.7
Education
Illiterate 123 49
Primary 49 19.5
Middle 34 13.5
High school 30 12
Higher secondary 08 3.2
Undergraduate 05 2
Postgraduate 02 0.8
Occupation
Employed 83 33.1
Unemployed 168 66.9
Religion
Hindu 234 93.2
Christian 06 2.4
Muslim 11 4.4
Type of family
Nuclear family 98 39
Joint family 87 34.7
Three generation family 66 26.3
Type of house
Pucca 156 62.2
Semi-Pucca 70 27.8
Table 3: Distribution of study respondents as per BMI.
BMI Frequency Percentage
Underweight 28 11.2
Normal 125 49.8
Overweight 77 30.7
Obesity 21 8.3
Total 251 100
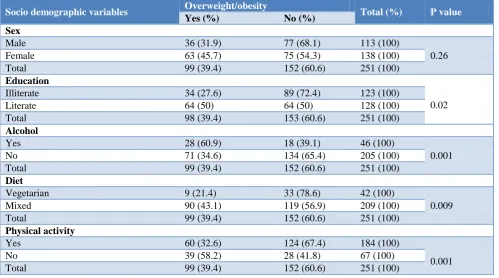
Table 4: Determinants of overweight/obesity.
Socio demographic variables Overweight/obesity Total (%) P value
Yes (%) No (%) Sex
Male 36 (31.9) 77 (68.1) 113 (100)
0.26
Female 63 (45.7) 75 (54.3) 138 (100)
Total 99 (39.4) 152 (60.6) 251 (100)
Education
0.02
Illiterate 34 (27.6) 89 (72.4) 123 (100)
Literate 64 (50) 64 (50) 128 (100)
Total 98 (39.4) 153 (60.6) 251 (100)
Alcohol
Yes 28 (60.9) 18 (39.1) 46 (100)
0.001
No 71 (34.6) 134 (65.4) 205 (100)
Total 99 (39.4) 152 (60.6) 251 (100)
Diet
Vegetarian 9 (21.4) 33 (78.6) 42 (100)
0.009
Mixed 90 (43.1) 119 (56.9) 209 (100)
Total 99 (39.4) 152 (60.6) 251 (100)
Physical activity
Yes 60 (32.6) 124 (67.4) 184 (100)
0.001
No 39 (58.2) 28 (41.8) 67 (100)
Total 99 (39.4) 152 (60.6) 251 (100)
Prevalence of overweight among study participants was 30.7% with a 95% CI (24.99-36.41) and obesity was 8.3% 95% CI (4.89-11.71) (Table 3).
Comparing gender, it was found that females are more
overweight/obesity (45.7%). than males (31.9%)
Association was found statistically significant.
Comparing literates and illiterates, it was found that literates are more overweight/obesity (50%) than illiterates (27.6%). Association was found statistically significant. Comparing alcoholic consumers and non-alcohol consumers it was found that persons who consume alcohol are more overweight and obese (60.9%) than non-consumers. Association was found statistically significant. It was found that those who consume mixed diet are more overweight and obese (43.1%) than who consume vegetarian diet (21.4%). Association was found statistically significant. It was found that those who are not engaging in physical activity are more overweight and obese (58.2%) than who are engaging in physical activity (32.6) Association was found statistically significant (Table 4).
DISCUSSION
may be due to the fact that women living as homemakers tend to remain indoors for most of the time thus having sedentary lifestyle. In this study we found that 60.9% of alcohol consumers and 39.4% of non-consumers were overweight/obese. Similarly Thankappan et al in a study in Kerala found that alcohol users have more risk to develop obesity compared to non-drinkers.14 In a study by Erem et al in Turkey found that among elderly people the prevalence of overweight was 47.3% among non-drinkers while among drinkers it was 38.3%.15 Kaplan et al from their study in Canada among elderly persons also stated that no role of alcohol as a risk factor for developing obesity.16 Since alcohol as a risk factor of obesity in elderly is not in consensus among studies done internationally, further extensive exploration is required in this regard. In our study we found that literates are more overweight/obesity 50% compared to illiterates, with a trend showing that the prevalence of overweight/obesity increasing with the level of education. Sugathan et al in Kerala also found that professionals are more overweight/obese 32% as compared to other educational groups.17 Persons with higher education in our country are usually involved in occupation which may require sedentary life style. On the other hand persons with lower educational qualification tend to be in occupation requiring either moderate or severe physical exertion. This may be the reason for the prevalence of overweight to be higher in persons with high education.
CONCLUSION
The prevalence of overweight and obesity, among elderly people was moderate to high among our study population. Hence concerned efforts through behavior change communication intervention are required to reduce the burden of overweight/obesity among the community.
ACKNOWLEDGEMENTS
The authors would like to thank all the, CRRIS, and paramedical staff of Health Centers, other faculty members for their guidance and support in conducting this study.
Funding: No funding sources Conflict of interest: None declared
Ethical approval: The study was approved by the Institutional Ethics Committee
REFERENCES
1. Obesity and overweight fact sheet No. 311 WHO, 2015.
2. WHO (2016), Obesity and overweight, fact sheet No.311, 2016.
3. Govt. of India (2011), National Health profile, 2011 Ministry of Health and Family welfare, New Delhi, 2011.
4. Bharati DR, Pal R, RekhaR, Yamuna TV, Kar S, Radjou AN, et al. Ageing in Puducherry, South
India: An overview of morbidity profile. J Pharm Bioallied Sci. 2011;3:537‑42.
5. Singh P, Kapil U, Dey A. Overweight and obesity
among elderly—Delhi. Indian J Med Sci.
2004;58:162–3
6. http://nhrc.nic.in/Documents/Publications/KYR%20
Elderly%20English%20Final.pdf
7. Kupuswamy’s Socio Economic Status Scale.
Available at: http://obgmadeeasy.files.wordpress. com/2011/10/kc-ccpdf.made
8. Verma SK, Nimesh RP. Health awareness problems
and culture of Balmiki families urban areas Jhansi city. 2013. Available at: http://hdl.handle.net/ 10603/10699. Accessed on 20 June 2018.
9. WHO, Tech, Rep.no. 916; 2003.
10. The WHO STEP wise Approach to Surveillance of Non-Communicable Diseases WHO/NMS/CCS/ 03.05.2003. World Health Organization. Available
at http://www.who.int/ncdsurveillance/en/.
Accessed on 14 April 2014.
11. Swami HM, Bhatia V, Gupta AK. An
epidemiological study of obesity among elderly in
Chandigarh. Indian J Community Med.
2005;30(1):1–5.
12. National Institute of Medical Statistics, Indian Council of Medical Research (ICMR), 2009, IDSP Non-Communicable Disease Risk Factors Survey, Phase-I States of India 2007-08.
13. Bhardwaj SD, Shewte MK, Bhatkule PR, Khadse
JR. Prevalence of risk factors for
non-communicable disease in a rural area of Nagpur district, Maharashtra– A WHO STEP wise approach. Int J Biol Medical Res. 2012;3(1):1413-8. 14. Thankappan KR, Shah B, Mathur P, Sarma PS, Srinivas G, Meena D, et al. Risk factor profile for chronic non- communicable diseases: Results of a community-based study in Kerala, India. Indian J Med Res. 2010;131:53-63.
15. Erem C, Arslan C, Hacihasanoglu A, Deger O, Topbas M¸ Ukinc K, et al. Prevalence of Obesity and Associated Risk Factors in a Turkish Population. Obesity Research. 2004;12(7):1117-27. 16. Kaplan M, Huguet N, Newsom JT, Mcfarland BH,
Lindsay J. Prevalence and correlates of overweight and obesity among older adults: findings from the Canadian national population health survey. J
Gerontol Biological Sci Med Sci.
2003;58(11):1018-30.
17. Sugathan TN, Soman CR, Sankaranarayan K,
Behaviour risk factors for non-communicable diseases among adults in Kerala, India. Indian J Med Res. 2008;127:555-63.