* To whom all correspondence should be addressed. E-mail: [email protected]
Rare Earth Elements and Their Ability to Capture
Changes in Borders of Hydrocarbon Saturation
in Development of Oil and Gas Deposits
K.S. Tsoi and V.E. Peshkov
Federal State Autonomous Higher Professional Education Institution “Tomsk National Research State University (TSU)” 36. Lenin ave., Tomsk, Russia, 634050.
doi: http://dx.doi.org/10.13005/bbra/1434
(Received: 27 September 2014; accepted: 10 October 2014)
Influence is shown of oil fluids redistribution in rare earth elements in the mineral agile complex of rocks in the section of a well by accounting shares - lanthanides balance of the mineral agile complex (MAC) related to rock embankment. Changes in concentration and redistribution of lanthanides in REE composition are considered from the perspective of the impact of oil fluids on the redox conditions in the reservoir and the change in thermodynamic conditions after start of oil and gas deposits development. The possibility has been considered of accumulating individual lanthanides in MAC and the deficit of Eu as a part of REE of an organic complex of rock in the deposit, the main reason of which is changing oxidation - and - reduction of environmental conditions and migration processes within the deposit and through its overlapping screen - top of collector. Also abnormal redistribution of individual lanthanides in REE composition is noted, the consequence of which is specifically the change in reservoir pressure and extraction of fluids from REE along with oil and gas hydrocarbons. Indicator possibilities of REE for establishing the boundaries of most oil-saturated, in fact, in the newly formed part of the deposit in the section of the exploration well have been justified by the behavior of individual lanthanides that are capable of changing valence and of accumulating or impoverishing at the borders of the reservoir deposits resulting from changes in the physico-chemical conditions in the deposit under the influence of technological processes.
Key words: oil saturation, migration,rare earth elements, complex formation and valence, ionic radius, differentiation in lanthanides behavior.
One of the objectives of the petroleum geology is detecting the most oil-saturated part in reservoir section. This problem was solved using geophysical (GIS) methods, and it was possible to solve it using geochemical methods - by the
behavior and distribution of rare earth elements in the rocks earthwork. Previously, identification of oil-saturated strata in well section was determined by concentration of abnormal content of europium (Eu) at the top and base related to the middle part of the reservoir and was identified as the boundaries of reservoir1. Then, for such purposes,
relative concentrations of (Eu*)2 were used as
of the rock:
Eu* = Eu / 0.5 (Sm + Gd) ...(1)
Use of these geochemical, quantitative parameters or criteria for determining oil-bearing capacity of rock is said to be valid for rocks of clastic complex3.
Indicator capabilities of such parameters are well manifested in the presence of petroleum fluids that determine the redox condition towards the recovery process in a closed system of the deposit, when it is viewed as a geometric body. With that, it was found that values (Eu/Sm) N of
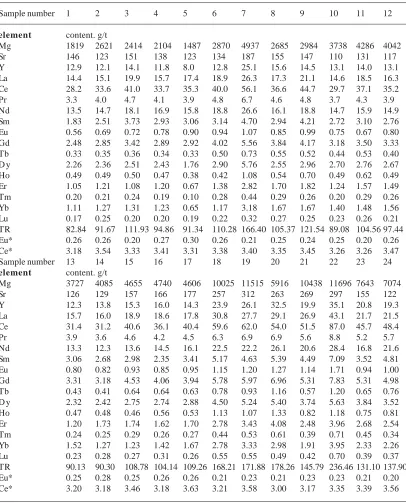
Table 1. Content of elements in deposit in rocks embankment. g/t
Sample number 1 2 3 4 5 6 7 8 9 10 11 12
element content. g/t
Mg 1819 2621 2414 2104 1487 2870 4937 2685 2984 3738 4286 4042 Sr 146 123 151 138 123 134 187 155 147 110 131 117 Y 12.9 12.1 14.1 11.8 8.0 12.8 25.1 15.6 14.5 13.1 14.0 13.1 La 14.4 15.1 19.9 15.7 17.4 18.9 26.3 17.3 21.1 14.6 18.5 16.3 Ce 28.2 33.6 41.0 33.7 35.3 40.0 56.1 36.6 44.7 29.7 37.1 35.2 Pr 3.3 4.0 4.7 4.1 3.9 4.8 6.7 4.6 4.8 3.7 4.3 3.9 Nd 13.5 14.7 18.1 16.9 15.8 18.8 26.6 16.1 18.8 14.7 15.9 14.9 Sm 1.83 2.51 3.73 2.93 3.06 3.14 4.70 2.94 4.21 2.72 3.10 2.76 Eu 0.56 0.69 0.72 0.78 0.90 0.94 1.07 0.85 0.99 0.75 0.67 0.80 Gd 2.48 2.85 3.42 2.89 2.92 4.02 5.56 3.84 4.17 3.18 3.50 3.33 Tb 0.33 0.35 0.36 0.34 0.33 0.50 0.73 0.55 0.52 0.44 0.53 0.40 D y 2.26 2.36 2.51 2.43 1.76 2.90 5.76 2.55 2.96 2.70 2.76 2.67 Ho 0.49 0.49 0.50 0.47 0.38 0.42 1.08 0.54 0.70 0.49 0.62 0.49 Er 1.05 1.21 1.08 1.20 0.67 1.38 2.82 1.70 1.82 1.24 1.57 1.49 Tm 0.20 0.21 0.24 0.19 0.10 0.28 0.44 0.29 0.26 0.20 0.29 0.26 Yb 1.11 1.27 1.31 1.23 0.65 1.17 3.18 1.67 1.67 1.40 1.48 1.56 Lu 0.17 0.25 0.20 0.20 0.19 0.22 0.32 0.27 0.25 0.23 0.26 0.21 TR 82.84 91.67 111.93 94.86 91.34 110.28 166.40 105.37 121.54 89.08 104.56 97.44 Eu* 0.26 0.26 0.20 0.27 0.30 0.26 0.21 0.25 0.24 0.25 0.20 0.26 Ce* 3.18 3.54 3.33 3.41 3.31 3.38 3.40 3.35 3.45 3.26 3.26 3.47 Sample number 13 14 15 16 17 18 19 20 21 22 23 24
element content. g/t
Table 2. Concentration in mineral agile complex (acid extract. 1.8% HCL) of rock samples from oil and gas deposit section. g/t
Sample number 1 2 3 4 5 6 7 8 9 10 11 12
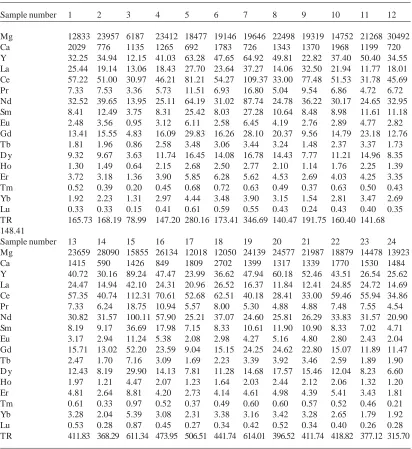
Mg 12833 23957 6187 23412 18477 19146 19646 22498 19319 14752 21268 30492 Ca 2029 776 1135 1265 692 1783 726 1343 1370 1968 1199 720 Y 32.25 34.94 12.15 41.03 63.28 47.65 64.92 49.81 22.82 37.40 50.40 34.55 La 25.44 19.14 13.06 18.43 27.70 23.64 37.27 14.06 32.50 21.94 11.77 18.01 Ce 57.22 51.00 30.97 46.21 81.21 54.27 109.37 33.00 77.48 51.53 31.78 45.69 Pr 7.33 7.53 3.36 5.73 11.51 6.93 16.80 5.04 9.54 6.86 4.72 6.72 Nd 32.52 39.65 13.95 25.11 64.19 31.02 87.74 24.78 36.22 30.17 24.65 32.95 Sm 8.41 12.49 3.75 8.31 25.42 8.03 27.28 10.64 8.48 8.98 11.61 11.18 Eu 2.48 3.56 0.95 3.12 6.11 2.58 6.45 4.19 2.76 2.89 4.77 2.82 Gd 13.41 15.55 4.83 16.09 29.83 16.26 28.10 20.37 9.56 14.79 23.18 12.76 Tb 1.81 1.96 0.86 2.58 3.48 3.06 3.44 3.24 1.48 2.37 3.37 1.73 D y 9.32 9.67 3.63 11.74 16.45 14.08 16.78 14.43 7.77 11.21 14.96 8.35 Ho 1.30 1.49 0.64 2.15 2.68 2.50 2.77 2.10 1.14 1.76 2.25 1.39 Er 3.72 3.18 1.36 3.90 5.85 6.28 5.62 4.53 2.69 4.03 4.25 3.35 Tm 0.52 0.39 0.20 0.45 0.68 0.72 0.63 0.49 0.37 0.63 0.50 0.43 Yb 1.92 2.23 1.31 2.97 4.44 3.48 3.90 3.15 1.54 2.81 3.47 2.69 Lu 0.33 0.33 0.15 0.41 0.61 0.59 0.55 0.43 0.24 0.43 0.40 0.35 TR 165.73 168.19 78.99 147.20 280.16 173.41 346.69 140.47 191.75 160.40 141.68 148.41
Sample number 13 14 15 16 17 18 19 20 21 22 23 24 Mg 23659 28090 15855 26134 12018 12050 24139 24577 21987 18879 14478 13923 Ca 1415 590 1426 849 1809 2702 1399 1317 1339 1770 1530 1484 Y 40.72 30.16 89.24 47.47 23.99 36.62 47.94 60.18 52.46 43.51 26.54 25.62 La 24.47 14.94 42.10 24.31 20.96 26.52 16.37 11.84 12.41 24.85 24.72 14.69 Ce 57.35 40.74 112.31 70.61 52.68 62.51 40.18 28.41 33.00 59.46 55.94 34.86 Pr 7.33 6.24 18.75 10.94 5.57 8.00 5.30 4.88 4.88 7.48 7.55 4.54 Nd 30.82 31.57 100.11 57.90 25.21 37.07 24.60 25.81 26.29 33.83 31.57 20.90 Sm 8.19 9.17 36.69 17.98 7.15 8.33 10.61 11.90 10.90 8.33 7.02 4.71 Eu 3.17 2.94 11.24 5.38 2.08 2.98 4.27 5.16 4.80 2.80 2.43 2.04 Gd 15.71 13.02 52.20 23.59 9.04 15.15 24.25 24.62 22.80 15.07 11.89 11.47 Tb 2.47 1.70 7.16 3.09 1.69 2.23 3.39 3.92 3.46 2.59 1.89 1.90 D y 12.43 8.19 29.90 14.13 7.81 11.28 14.68 17.57 15.46 12.04 8.23 6.60 Ho 1.97 1.21 4.47 2.07 1.23 1.64 2.03 2.44 2.12 2.06 1.32 1.20 Er 4.81 2.64 8.81 4.20 2.73 4.14 4.61 4.98 4.39 5.41 3.43 1.81 Tm 0.61 0.33 0.97 0.52 0.37 0.49 0.60 0.60 0.57 0.52 0.46 0.21 Yb 3.28 2.04 5.39 3.08 2.31 3.38 3.16 3.42 3.28 2.65 1.79 1.92 Lu 0.53 0.28 0.87 0.45 0.27 0.34 0.42 0.52 0.34 0.40 0.26 0.28 TR 411.83 368.29 611.34 473.95 506.51 441.74 614.01 396.52 411.74 418.82 377.12 315.70
the relation in organic complex (OC) of species may differ by 1-2 orders of magnitude from their values in the rocks containing oil reservoir4.
Additionally, in determining the oil-bearing capacity of rocks, one can use behavior of samarium ( Sm ) and ytterbium (Yb), that can, same as Eu2+,
be present and migrate in the form of Sm2+ and
Yb2+[4]. It should be emphasized that these
regularities persist until field development, when oil and gas deposit is not yet subject to the
Table 3. Share of REE faction (1.8% HC L) of the mineral agile complex relative to their concentrations to samples rock embankment of the oil and gas deposit. %
Sample 1 2 3 4 5 6 7 8 9 10 11 12
weighed quantity 0.0116 0.0955 0.0239 0.0272 0.0647 0.0168 0.0802 0.0337 0.0181 0.0142 0.0480 0.1543 Mg 8.18 10.60 2.97 12.91 14.42 7.74 4.62 9.72 7.51 4.58 5.76 8.75 Sr 16.17 7.32 8.71 10.67 6.52 15.48 4.52 10.06 10.79 20.66 10.62 7.16 Y 2.90 3.34 1.00 4.03 9.22 4.32 3.00 3.71 1.82 3.31 4.18 3.05 La 2.05 1.47 0.76 1.36 1.84 1.45 1.65 0.94 1.78 1.74 0.74 1.28 Ce 2.35 1.76 0.88 1.59 2.67 1.57 2.26 1.05 2.01 2.01 0.99 1.51 Pr 2.57 2.20 0.82 1.64 3.44 1.67 2.91 1.28 2.29 2.18 1.29 1.99 Nd 2.79 3.12 0.89 1.72 4.73 1.91 3.83 1.78 2.24 2.38 1.80 2.56 Sm 5.34 5.77 1.17 3.28 9.63 2.96 6.74 4.20 2.34 3.83 4.34 4.69 Eu 5.15 6.00 1.53 4.65 7.84 3.19 6.99 5.69 3.22 4.47 8.22 4.10 Gd 6.28 6.33 1.64 6.45 11.84 4.69 5.86 6.16 2.65 5.39 7.69 4.44 Tb 6.26 6.58 2.80 8.77 12.08 7.03 5.51 6.85 3.29 6.18 7.43 5.01 D y 4.79 4.76 1.68 5.61 10.86 5.62 3.38 6.57 3.04 4.82 6.28 3.63 Ho 3.04 3.55 1.48 5.37 8.09 6.92 2.98 4.51 1.89 4.19 4.21 3.26 Er 4.11 3.06 1.45 3.79 10.08 5.26 2.31 3.09 1.72 3.77 3.14 2.60 Tm 3.01 2.13 0.96 2.69 7.92 2.97 1.64 1.95 1.61 3.69 1.98 1.93 Yb 2.01 2.04 1.16 2.79 7.97 3.46 1.42 2.19 1.07 2.34 2.72 1.99 Lu 2.32 1.54 0.86 2.45 3.79 3.12 1.97 1.87 1.08 2.16 1.82 1.95 TR 54.96 53.67 19.07 56.19 111.99 56.16 52.44 51.84 32.06 52.46 56.81 44.00 Eu/Sm 0.96 1.04 1.31 1.42 0.81 1.08 1.04 1.36 1.38 1.17 1.89 0.88 La/Yb 1.02 0.72 0.66 0.49 0.23 0.42 1.16 0.43 1.67 0.75 0.27 0.64 Sample 13 14 15 16 17 18 19 20 21 22 23 24 weighed quantity 0.0214 0.1046 0.0209 0.0754 0.0165 0.0146 0.0253 0.0473 0.0434 0.0167 0.0176 0.0098 Mg 7.36 7.98 3.95 6.40 3.03 1.39 2.43 4.82 2.44 1.87 2.20 2.28 Sr 13.04 5.32 10.55 5.94 11.86 12.18 5.21 5.80 5.78 6.92 11.41 14.16 Y 3.85 2.54 6.78 3.43 1.95 1.78 2.13 2.15 3.05 1.44 1.48 1.54 La 1.81 1.08 2.58 1.52 1.37 1.00 0.68 0.47 0.54 0.67 1.32 0.79 Ce 2.12 1.52 3.21 2.27 1.51 1.22 0.75 0.61 0.74 0.79 1.42 0.84 Pr 2.17 2.00 4.77 3.06 1.45 1.47 0.89 0.82 1.01 0.98 1.68 0.92 Nd 2.69 2.99 8.52 4.65 1.81 1.92 1.28 1.15 1.48 1.38 2.17 1.12 Sm 3.10 3.97 14.30 8.87 2.43 1.87 2.66 2.56 2.82 1.36 2.31 1.14 Eu 4.60 4.18 14.06 7.38 2.55 3.01 4.13 4.72 4.87 1.89 2.99 2.36 Gd 5.51 4.75 13.38 6.75 2.66 3.04 4.72 4.11 4.98 2.23 2.60 2.67 Tb 6.68 4.83 13.07 5.64 3.13 3.34 4.25 3.91 7.00 2.50 3.38 2.90 D y 6.20 3.93 12.61 5.98 3.14 2.91 3.25 3.77 4.79 2.48 2.49 2.17 Ho 4.91 2.94 11.16 4.30 2.71 1.68 2.20 2.13 3.00 2.02 2.05 1.72 Er 4.67 1.77 5.88 3.01 1.86 1.73 1.56 1.42 2.05 1.59 1.49 0.83 Tm 2.98 1.52 3.89 2.31 1.57 1.30 1.32 1.14 1.69 0.85 1.18 0.73 Yb 2.50 1.86 5.06 2.51 1.60 1.41 1.10 1.33 1.99 0.78 0.89 0.98 Lu 2.69 1.18 3.72 1.67 1.22 0.71 0.88 1.23 0.94 0.67 0.78 0.88 TR 56.49 41.06 123.00 63.33 30.96 28.36 31.79 31.52 40.96 21.64 28.22 21.58 Eu/Sm 1.48 1.05 0.98 0.83 1.05 1.61 1.55 1.84 1.73 1.39 1.29 2.08 La/Yb 0.72 0.58 0.51 0.60 0.85 0.71 0.62 0.35 0.27 0.86 1.48 0.81
as the main factor of influence on REE behavioral nature. Here, except for Eu, Sm and Yb, as it will be shown later, the role of geochemical indicators will also appear in the behavior of Tb that is able to migrate from the hydrocarbons of oil and gas in
the form of Tb4+ and heavy REE in the trivalent
form with high complex-forming properties with sodium5. This is due to the fact that in transition of
Tb3+ into oxidized state Tb4+ the ionic radius
Table 4. Aggregated mean values from Tables 1.2.3
Average REE La Ce Pr Nd Sm Eu Gd Tb D y Ho Er Tm Yb Lu
Rocks
embankment. g\t 20.97 43.30 4.95 18.04 3.63 0.94 4.30 0.59 3.28 0.68 1.96 0.32 1.85 0.32 Concentration in
MAC. g/t 21.91 55.81 7.67 36.91 12.05 3.56 17.06 2.45 11.53 1.85 4.06 0.50 2.83 0.40 MAC share % 1.29 1.57 1.90 2.54 4.24 4.91 5.28 5.77 4.78 3.76 3.01 2.21 2.21 1.73 HO1.8% HCl, g/t 19.44 39.98 4.39 15.13 2.65 0.63 2.91 0.39 2.21 0.52 1.48 0.26 1.62 0.27
Table 5. Concentration of elements in an extraction of alcohol-benzene mixture of rocks in the section
of collector strata of the tested deposit. g/t
Element Row 1 Row 2 Row 3
Mg 202.1882 155.4561 266.3584 Ca 127.0095 106.0716 91.0105 Sr 1.0451 0.572 0.368 Ba 0.8588 1.3401 0.8274 La 0.0695 0.2363 0.0883 Ce 0.1687 0.5101 0.1844 Pr 0.019 0.0494 0.0208 Nd 0.0669 0.1761 0.0778 Sm 0.0169 0.0343 0.0138 Eu 0.0008 0.0027 0.0015
Gd 0.0214 0.0294 0.0134 Tb 0.004 0.0047 0.0018 D y 0.0272 0.0288 0.0108 Ho 0.0062 0.0055 0.0029 Er 0.0179 0.0163 0.0066 Tm 0.0032 0.0024 0.0011 Yb 0.0201 0.016 0.0058 Lu 0.003 0.0023 0.0009 TR 0.4448 1.1143 0.4299
Analysis results were obtained from the total of the following samples:
Row 1 - Samples No. 1 – 5, alcohol-benzene mixture fractions - 2.835%; Row 2 - samples No. 6-15 Yield of fractions - 4.9217%; Row 3 - samples No. 15-24, yield of fractions - 6.9972%
octanumerous coordination6 and approximates by
its size to heavy REE, obtaining their complex-forming properties. Therefore, its stability in changed conditions will be determined by the ability of hydrocarbons in oil and gas to act as a stabilizer (screen) against water for Tb4+ 7.
Otherwise, there is a difference in behaviors of separate lanthanides in the REE in the deposit before and during beginning of development of the deposit. With that, REE behavior obviously varies with the influence of technological
processes. Checking this version is the main objective of REE studies. In addition, the objective is to establish their ability to fixation of changing boundaries of deposit strata oil saturation and the degree of efficiency of using behavior of individual lanthanides as geochemical indicators in changing redox-and-environmental conditions.
In course of development of oil and gas deposits, also exist (or may arise) problems of determining the most oil-saturated part of the collector strata before the end of field
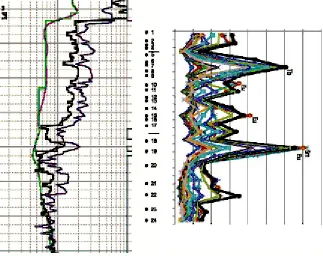
Fig.1. WGR, sampling points and distribution op contents La, TR and lanthanides that are able to change valence, in the embankment of the section of well in the studies deposit
Fig. 2. Variations of REE compositions in the rocks of the deposit under survey. Contents of lanthanides of the embankment of rocks are normalized to chondrite carbonaceous (C1) [11]
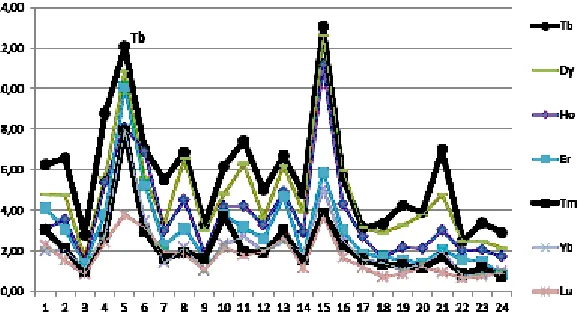
Fig. 5. Distribution of REE shares of the mineral agile complex in the deposit well section, %, from the bottom (sample 24) to the roof (sample 1) of the changed oil saturated part of the deposit
Fig. 5(b). Distribution of REE shares of the mineral agile complex in the well section for representative of heavy REEs, %, from Fig.5
Fig. 5(c). Distribution of REE shares of the mineral agile complex in the well section for representative of light REEs – La.Ce. Pr 8 Nd, %, from Fig.5
Fig. 6. Variations of REE compositions in the deposit’s organic complex of rocks. REE concentrations are normalized to chondrite carbonaceous (!1) [11]. Row 1 – samples 15 with output of the alcohol
-benzene mixture fraction – 2.835%1; Row 2 – samples 6 – 15 with fraction output – 4.9217%; Row 3 – samples 16 – 24 with fraction output 6.9972%. According to Table 5
Fig. 8. Comparison of results upon oilfield geophysics results (0); geochemical surveys of rare-earth elements (b), where the oil saturated part upon data “a” is defined within the range of 2744.51 - 2755.3 m (sampling
points 4.5 – 17.18), upon data “b” - within the range of 2745.33 – 2752.46 m (sampling points 5 – 15)
well as parameters of deposit physics (rock porosity and permeability. etc.) and. most important from the geochemical perspective, medium redox conditions. It is the behavior of lanthanides in these conditions that is used for REE study in this paper. Thus, solution of the problem of quantification of residual hydrocarbon reserves is reduced mainly to determining changes in the boundaries of oil saturationof rockin the test site and quantifying the degree of rocks saturation with petroleum fluid. Such a problem can probably be solved by the method of organic geochemistry, together with geochemical studies of REE behavior. Thus, respectively, on the one hand, to determine the quantitative potential of hydrocarbon of oil and gas, and on the other hand, changed boundaries of the oil-saturated part in the section of the deposit, as the main task. Thus, solution to the task consists of two components: the first one is quantitative determination of potential of the petroleum fluids in the rock in the whole, and release of fractions from petroleum using methods of organic geochemistry, the second one is defining changes in the boundaries of the oil saturated part
by the behavior of rare earth elements in course of deposit development.
Object of the research
As the object of study, oil and gas field was chosen with sandstone collector type, in the south-eastern part of Western Siberia. For reaching the set objectives for research, section with well geophysical research (WGR) data is presented as well as core material, lithology of the deposit section and interval of taking samples 1 - 24 at depths 2742.89 –2764.53 m. (fig. 1).
The mineral composition of unproductive sandstones of the studied area was also involved in research, and breakthrough A-934 is presented, which is characterized by high silica content (SiO2=93.67%) and low content of oxides - CaO (less than 0.1%) and MgO=0.05%). From the results of the analysis of a sample taken from the depth of 2711.0 m. made in GI KSC RAS, Apatity.
Methods of analysis
acid extracts, identified with mineral agile complex (MAC), was performed using hydrochloric acid (1.8%HCL) by analogy in works4-8, of organic
complex - by extracting alcohol - benzene mixture at a ratio of 1:1. Content of rare earth elements in the species and concentration in the fractions was determined using the ICP MS method. Rare earth elements in the organic phase were determined after preliminary concentration by evaporation of the extract until dry residue is obtained and disclosure by nitric acid (HNO3) before analysis on the content of the rare earth elements. In discussion of the results, the calculated balance was additionally used between REE mineral agile complex and rock embankment. The results are shown as fractions of individual MAC lanthanides relative to REE content in rocks embankment (table 1 - 3).
DISCUSSION
From the distribution of lanthanides in section of well and TR (figure 1) it can be seen that it is hard to solve the problem in terms of setting the boundaries of the oil saturated strata. By REE distribution one can only assume location of deposit borders within the boundaries of small peaks in the well section. With that, the used distribution of lanthanides that are able to change valence depending on the redox conditions. By the analysis of rocks embankment did not provide any substantial results for establishing changes in oil saturation. Usually the use of relative maximum distribution and behavior of individual lanthanides in the section of well are well interpreted with the boundaries of oil-bearing strata in clastic rocks1-4 .
These lanthanides include Eu, Sm and Yb in their transition to the divalent state in the form of Eu2+.
Sm2+ and Yb2+ in sharply reducing environment4.
Indicator capabilities have been defined as well for other lanthanides that can participate in geochemical processes in oxidized form. These include Ce4+. Pr4+ and Tb4+. The most interesting
in the geochemical context is Tb4+ and its
differentiated behavior from other lanthanides in
REE fractions of rocks described in work3.
Additionally, in Figure 1 for comparison on the background of the WGR. The distribution is shown La that has the largest ionic radius of all trivalent REEs. As it turned out, use of results of distributing
all lanthanides in the rock embankment in well section make it impossible to solve this problem. So far behavior of rare earth elements was considered in study of oil and gas deposits by core material selected from the exploratory drilling, i.e. of objects (oil and gas deposits) without violating initial thermodynamic conditions. So in this paper, an effort was made to solve the task based on conventional chemical properties of REEs by involving the balance of rare-earth elements of the mineral agile complex (MAC) related to rock embankment and lanthanides distribution variations within REEs of the mineral complex of the rock. For comparative analysis and solution of the task, we make a comparative analysis of the REE content variations of oil and gas deposit rocks upon the well section given in Figure 2.
It can be seen from Fig. 2 that spectrums normalized values of lanthanides have almost no differences from sedimentary rocks (Table 4 – average for rock embankment). We do not see any significant deviations in the behavior of individual lanthanides, which is emphasized by visual absence of any fractioning effect among REEs. More informative connection of REEs with rock components of the deposit were obtained in the result of the REE content analysis for the mineral agile complex (MAC).
Normalized concentration of MAC REEs towards North American slates NASG9 (Fig.3) or
clays of the Russian platform RP10 (Fig.4) show
lanthanides and to increase their complex-forming properties from La to Lu5. This option will be
considered upon the analysis of REEs of the mineral agile complex (MAC) related to rock embankment. Hence, we can suppose that the main reason for such unusual fractioning is forced migration of REEs with oil fluids during their extraction under the action of technological processes. It can be reasonably assumed that impact of technological processes on initial thermodynamic and physical and chemical conditions in the oil-field as well as significant impact on the change of geochemical environment at the oil deposit development site. Such changes shall affect the REE behavior as well, especially on MAC REEs as some REEs are already removed during the operation of the deposit. Hence, we find a further solution of our task – determining and locating of boundary REE abnormalities in the well section and presentation of arguments for the vertical migration of lanthanides with oil fluids. Let’s consider the balance of lanthanides shares of the mineral agile complex in relation to the rock embankment upon the well section (Table 3, Fig. 5).
We must also pay attention to the distribution of lanthanides shares and especially the formula of maximums Eu, Sm and Tb in the well section that confines boundaries, e.g., in our opinion the most reliable oil-saturated part of the deposit at the moment of oil surveying (Fig. 5). This conclusion is based on the following assumptions that are, first of all, seen from the distribution of lanthanides in the well section. Accumulation in points confining the assumed oil-saturated part is fixed for most lanthanides among REEs. But largest maximums of accumulations are related to the above lanthanides only that are capable of changing valence and ionic radius in case of changing oxidation-reduction conditions of the environment6,12. Now let’s consider reasons
for such distribution of lanthanides and explain the occurrence of abnormal behavior of individual lanthanides among REEs. Fig. 5 and Table 3 gives clear view of maximum accumulation of Eu and Sm in the zone of bottom boundaries change, and a significant amount of Tb in the zone of a newly formed roof. Hence, the antinomy of accumulation of two lanthanides different in chemical properties within the deposit (Eu2+) in the bottom zone and
(Tb4+) in the roof zone can be related to various
oxidation-reduction conditions of the location of these lanthanides. Such conditions can be seen, as viewed from distribution of these lanthanides, when considering the well section beyond the field limit where the section part is influenced by two different physical and chemical conditions -oxidation (roof zone) and reduction (bottom zone) due to technological processes.
As known, all three elements can change valence and ionic radius in the highly reductive media and can be in the form of Eu2+. Sm2+ 8 Yb2+ in
the organic rock complex. As stated in [4], this promotes their accumulation and migration in bivalent form within the deposit and beyond it with oil and gas hydrocarbons. Hence, we can assume that prior to opening the bed, due to establishment of highly reductive conditions by oil and gas hydrocarbons, accumulations of Eu have been formed in the roof and bottom zones of the oil-bearing bed with impoverishment of the medium part, with ratio of (Eu roof > Eu bottom), which is typical of deposits with fragmentary complex in the Western Siberia and given in [2.3.4]. Such an assumption is reflected by maximums Eu and Sm in the bottom zone and lower distribution of Eu concentrations in the middle part of the section (Fig. 5 and 50). This assumption is agreed with values of shares in the zone of maximums (sampling point 5) for Eu, Yb and Sm (Fig. 50). Their values correspond to the ratio Eu > Yb > Sm (Table 3) and to the level of change of their oxidation-reduction potentials4. This is a sign of reduction priority of
this lanthanides and removal (migration) from the roof zone beyond the deposit, e.g., first of all, Eu are removed, then Yb and finally Sm, which is reflected in Fig 50 and Table 3, where shares of these lanthanides in sampling point 5 are: Eu = 7.84%; Yb = 7.97%; Sm = 9.63%. Reasons for such distribution of shares are as follows: first of all, it is related to physical and chemical properties of individual lanthanides to change valence and ionic radius in highly oxidation-reduction conditions of the media. On the other hand, changes of valence for Eu, Yb and Sm are congruent, and the changing priority of their ionic radii in reductive processes is Eu2+ = 1.25 > Yb2+ =1.14A > Sm2+ = 1.02A in
concerning the capturing of elements with high ionic radius by oil components of fluids [4]. Hence, we see the given priority of removal of these lanthanides along with oil and gas extraction. It should be noted that Eu in the form of Eu2+ has the
largest ionic radius among all REEs. Consequently, Eu2+ behavior will be determinant for finding its
migration pattern with oil and gas hydrocarbons. First of all, those lanthanides are removed that have the largest ionic radius and electropositive potential13.
Decrease of concentrations of these lanthanides in sampling point 5 of the well section in relation to the changed bottom part with simultaneous accumulation of terbium (Tb) in the zone of the newly formed roof screen are related to changes in the oxidation-reduction conditions of the media during the development of the oil and gas deposit. Significant amount of water and surface active reagents pumped into the oil formation as stated in14 has significant influence
on geochemical and thermodynamical conditions of the media and will have influence on the surveyed deposit site. This shall be reflected on REEs behavior, especially on accumulation and migration of heavy lanthanides having higher complex-forming properties than average REEs in trivalent form5.Ce, Pr and Tb have ability to change
valence and ionic radius when oxidation-reduction conditions of the media change towards reductive. As known, such process is possible for cerium (!e4+), praseodymium (Pr4+) and terbium (Tb4+)7.
Transition from trivalent form to quadrivalent form is defined for these lanthanides by the capacity of
the oxidation-reduction potential15. Most
oxidation-reduction potential of Tb4+ defines more
rigid stability conditions. So, for Tb4+ stability,
organic stabilizers are usually used7. In natural
processes (possibly) and in oil and gas deposits (quite possible), oil and gas hydrocarbons act as stabilizers16. Now let’s point out the following
aspect that is also important for determining reasons for abnormal accumulations of Tb4+.
Decrease of ionic radii is maximum in priority Ce4+,
Pr4+, Tb4+, correspondingly, with the following
decreasing order of ionic radii: 0.97, 0.96, 0.88 in octanumerous coordination6. Hence, we see that
terbium in the form of Tb4+ with ionic radius 0.88 is
the closest in terms of the ionic radius size, and it exceeds ionic radii of Yb3+ and Lu3+, respectively
equal to 0.977 and 0.985 . Consequently, the changed ionic radius of Tb4+ allows locating it next
to heavy REEs. Complex-forming properties of Tb4+
similar to heavy REEs 5 can be seen in Fig. 5b in the
form of priority of abnormal accumulation in sampling point 5 of other representatives of heavy REEs. This is a reason to assume interconnection of Tb4 with oil and gas hydrocarbons in the result
of its screening from water by oil or its derivatives. As a consequence of possibility of such chemical process, we see such redistribution of REEs during the migration of oil fluids in the deposit towards the upper screen non-related to the decrease of deposit’s physical parameters (porosity and permeability) and change of oxidation-reduction conditions of the media.
Such an assumption can be checked upon the following results. In the zone of the newly formed roof in sampling point 5, Table 5 gives data for comparing relative maximums of Tb* with values of balance shares of Tb* in the mineral agile complex of rocks. These values are defined from the ratio Tb* = Tb / 0.5 (Gd + Dy). They are respectively equal to: Tb* MAC = 0.15 and Tb* balance =1.06, which leaves no doubts that there is terbium in the deposit (difference by 7 times, which is not viewed in natural processes) in the form of Tb4+.
This statement is assumed on the basis of properties of valent states of lanthanides with changes of ionic radii. This allows assuming that Tb can migrate and be abnormally accumulated only with oil hydrocarbons of fluids in the form of Tb4+. There are no other aspects of migration and
accumulation in the zone under consideration and within the considered period of time. Consequently, along with Tb4+ accumulation, accumulation in
sampling point 5 shall be seen for other heavy REEs according to high complex-forming properties and in the priority order of changing their ionic radii, which is given in Fig 5b. This priority is probably true for expression of priority of migration properties of heavy REEs under the following scheme:
Tb4+ > Dy > Ho > Er > Tu > Yb > Lu.
The ionic radius of Tb4+ is minimal, but it
complex-forming properties in relation to all other heavy REEs, which is reflected in Fig. 5 and 5b and is very well traced upon the average data for shares of the minimal agile complex in the direction Tb > Lu (Table 4). Small discrepancy of values between Tu and Yb is most likely defined by the disposition of Yb2+. This is the case when Yb participates as a
representative of heavy REEs (Yb3+) and at the
same time as a representative of lanthanides capable of changing valence in highly reductive conditions (Yb2+) under technological processes
occurring during deposit development. Changes of the accumulation degree of Yb2+ in point 15 once
more highlight Yb capacity for migration processes, predominantly in its bivalent form.
Due to displaying all shares of lanthanides in Figures 50 – 5c on the same scale, it’s easy to view the migration process and increased accumulation of heavy REEs relatively to other lanthanides.
The process of lanthanides migration in the well section during the deposit development, especially at the initial stage, is also very easily traced upon smooth fall of Eu concentrations (Fig. 50, samples 17-21). Vertical migration processes in the well section are proved by Eu deficiency within REEs of the organic complex in the direction from the bottom to the roof of the oil-saturated part of the reservoir bed (Fig. 6).
In this paper, Nd accumulation still remains undefined in the distribution of lanthanides in the well section (Fig. 5c).
Its significant excess and difference as Sm along with Tb. Accumulation due to isomorphism with Ca is excluded as there is no Nd abnormalities in the distribution spectrum of the
organic complex (Fig. 6) as shown in17 in
the distribution of carbonate rocks and asphaltenes. Mineral composition of non-productive sandstones of the site under investigation (sample L-934) with traced contents of Ca and Mg oxides proves this as well. Their participation in the generation of hydrocarbons is unlikely possible, as well as in case of lanthanides isomorphism with saturation of rocks with oil fluids18. So the only explanation of insignificant
Nd accumulation is the quantitative presence of Sm conditioned by the principles of REE geochemistry and influence of adjacent lanthanides in the row La – Lu.
Finally, let’s consider the nature of REE distribution in the non-soluble residue after removing the mineral agile complex of rocks. As seen from Fig. 7, the fraction of sedimentary rocks after removal of the mineral agile complex has REEs insignificantly enriched with heavy lanthanides, and as shown in19, this is conditioned by the
presence of the heavy fraction containing necessary concentrates of REEs resistant to weathering (zircon, etc.)
Now, after having considered the nature of REE distribution in the newly formed oil saturated part of the formation, we can consider the whole mechanism of oxidation-reduction conditions influence on the redistribution of lanthanides with oil fluids beyond the field limit. It can be assumed that initial boundaries of the oil formation were located within the boundaries of the samples under survey. After the start of the development and with the change of the formation pressure in the development area, migration of oil fluids with lanthanides starts from the area under development towards the developed site due to the reduction of formation pressure and further extraction of oil fluids. In its turn, it leads to abrupt change of oxidation-reduction conditions in the deposit and in the site under survey and it changes the whole initial nature of REE distribution in the oil saturated part of the deposit. It can be assumed that the process of changing geochemical conditions goes on as follows: after fluids start migrating from the bottom zone, under reducing conditions, migration of those lanthanides starts that can change their valence in highly reductive conditions – Eu2+. Yb2+
and Sm2+. The migration and accumulation will
in the migration process in relation to Sm and Yb. Further mechanism of oxidation-reduction conditions affecting the REE redistribution can be related to lanthanides possessing an ability to change valence in highly reductive conditions and heavy REEs that have already been considered in this paper.
For illustration purposes, Figure 8 gives the comparison of results upon oilfield geophysics data (0): geochemical studies of rare-earth elements (b), where the oil-saturated part according to data (a) is determined within the range of 2744.51 – 2755.3 m (sampling points 4,5 – 17,18); and within the range between 2745.33 and 2752.46 m for (b) (sampling points 5 – 15). As a result we see almost unchanged upper boundaries of the roof and significant changes in the bottom zone, which clearly specifies vertical migration of fluids.
CONCLUSION
It follows from the geochemical studies conducted that migrations (emigrations) of REEs within the deposit and an overlapping screen are first of all typical of lanthanides that can change valence and ionic radius in acute reducing conditions. Such properties are possessed by Eu, Sm and Yb in bivalent form, with Eu2+, after a change in its valence and ionic radius from 1.06A to 1.25 [b], becoming the one with the largest ionic radius. Hence, we obtain the priority of its extraction by oil hydrocarbons from the deposit. Displayed redistributions of lanthanides in the well section correspond to the above (Fig. 50).
On the basis of the electrostatic connection of lanthanides with oil components of fluids justified by the ionic connection of cations and anions [20], we can assume the following migration and emigration pattern for light lanthanides according to the decrease of their ionic radii in the row La - Lu in trivalent form. This is clearly shown upon low accumulation of La in the upper screen zone (Fig. 5c), as it possesses the largest ionic radius from all trivalent REEs and is removed first in the result of fluids emigration. Finally, the displayed maximum of Tb4+ and heavy
REEs in Fig. 5b, and especially expression of their maximums in sampling point 5, shows substantiation of accumulation and migration Tb. Such behavior is possible only in the oxidized
condition with changed ionic radius and approaching to the properties of heavy REEs. As is known5, with atomic weight increase and ionic
radius decrease – the lanthanide contraction law – for all trivalent REEs, in the row La – Lu, complex-forming properties of REEs are increased from La to Lu. In this relation, sedimentary processes21
show abilities to complex formation of heavy REEs with organic substance. In this paper, we can view this process with these REEs (Fig. 5b). Here we can claim as follows: migration in the deposit and accumulation of heavy lanthanides in trivalent forms in boundary zones are not possible without participation and formation of their complex compounds with oil fluids. So, it would very important to remind of stabilizing properties of oil and gas hydrocarbons for Tb4+ 22, which is asserted
by its abnormal accumulation in the upper screen point (Fig. 5b), which is impossible without screening of Tb4+ by oil and gas hydrocarbons
and their migration to deposits.
Abstract
The task set in this paper for the quality assessment of oil and gas hydrocarbons, with known parameters of the surveyed site oil saturated part and with attraction of formation physical parameters (porosity and permeability, fluid extraction factor, etc.), as well the established output of fractions of the alcohol-gasoline mixture from the rocks within the intervals of the site under survey, is not only quite solvable, but it also allows calculating the quantitative increase of oil and gas reserves. Finally, the paper shows that despite minimal input data, the tasks set herein can be solved by involving results of geochemical investigations of rare-earth elements.
CONCLUSIONS
1. Rare-earth elements and valent states of
individual lanthanides are geochemical indicators and can be considered as criteria of rocks oil-bearing capacity. Changes of the behavior of individual lanthanides depending on oxidation-reduction conditions also allow substantiating their differentiated behavior within REEs of rock fractions as a part of geochemical surveys.
2. Survey results show that changes of oil
be viewed upon the REE shares distribution for the deposit rocks’ mineral agile complex. Accumulation maximums of lanthanides capable of changing valence in the well section are identified with a newly formed level of the formation oil saturation, and the degree of oxidation-reduction conditions in the deposit upon the abnormal Eu content among REEs of the organic complex of rocks.
3. Survey results show that upon the
distribution of REE shares of the mineral agile complex of rocks in combination with the oilfield geophysics data, it’s possible to determine the boundaries with largest and smallest watering of surveyed sites beyond the field limit and to perform water shutoff treatment in these zones to direct the pumped liquid to formation beds non-affected by surface-active reagents, which will result in the increase of the oil recovery factor (ORF).
*The Tomsk State University.
**The Tomsk Branch of SNIIGGiMS (The Siberian R&D Geology, Geophysics and Mineral Resources Institute).
ACKNOWLEDGEMENTS
We would like to express our gratitude to Tishin P.A. for support in performing analysis using ICP MS of the organic part of rocks (The Tomsk State University). Head of the oil geochemistry laboratory of Tomsk NIPIneft LLC, Doctor of geological-mineralogical sciences, Goncharov I.V., for support in performing works on detaching the mineral complex of rocks and discussion of analytical works. Parnachev S.V., associated professor, Candidate of geological-mineralogical sciences, for participation and support in performing analytic works and discussion of survey results.
REFERENCES
1. Tsoy, K.S., Y.A Balashov et al, Author ’s certificate for invention “The Method of Determining Boundaries of Oil and Gas Bearing Formations” of 22.11.1986 #129320, 1986. 2. Balashov, Y.A., K.S Tsoy et al, Author ’s
certificate for invention “The Method of Determining Boundaries of Oil and Gas Bearing
Formations in the Well” of 08.12.1991 #1725657, 1991.
3. Tsoy, K.S., Rare earth elements and Yutrium in carbonate reef deposits containing hydrocarbons of oil and gas. Word Applied Science Journal,
2013; 24(2): 256-266.
4. Tsoy, K.S. and Y.A. Balashov, The role of oxidation-reduction conditions in accumulation of Eu2+. Yb2+ and Sm2+ in oils. Reports of the Academy of Science, 1989; 309(5): 1189-1192. 5. Balashov, Y.A., Geochemistry of rare-earth
elements. Moscow: Nauka, 1976; 128-215. 6. Shannon, R.D., Revised effective ionic radii and
systematic studies of interatomic distances in halides and chalcogenides. Acta Crystallographica, 1976; F32: 751-767. 7. Panyshkin, V.T., Y.A. Afanasyev et al,
Lanthanides. Simple and complex compounds. The Rostov University Publishing House, 1980; 21-23.
8. Girin, Y.P,. Y.A. Balashov and R.F. Bratishko, Redistribution of rare-earth elements in the process of diagenesis of hymid sediments.
Geochemistry, 1970; 5: 616-803.
9. Gromet, L.P., R.F. Dymek, L.A. Haskin and R.L. Korotev, The North American shale composite: Its compilation. Major and trace element characteristics. Geochimica et
Cosmochimica Acta, 1984; 48(N12): 2469-2482. 10. Migdisov, A.A., Y.A. Balashov, I.V. Sharkov, O.G. Sherstennikov and A.B. Ronov, Prevalency of rare-earth elements in major lithological types of rocks of the sedimentary cover of the Russian platform. Geochemistry, 1994; 6: 789-803. 11. McDonough, W.F. and S.-s Sun, The
Composition of the Earth. Chemical Geology, 1995; 120: 223-253.
12. Tsoy, K.S., Geochemistry of Ree in Oils and Possibilities of its Application in Oil Exploration. Advances in Environmental Biology,
2014; 8(10): 962-968.
13. Bochkarev, M.N., G.S. Kalinina, L.N. Zakharov and S.Y. Khorshev, Organic derivatives of rare-earth elements. Moscow: Nauka, 1989; 1-7; 82-87.
14. Reports of authors, In the Proceedings of the 8th
International Conference: Oil and Gas Chemistry, September, 24-28, Tomsk, Russia, 2012.
15. Ginsburg, A.I., L.N. Zhuravleva, I.B. Ivanov and V.V. Sherbina, 1959. Rare-earth elements and their deposits. Moscow: Gosgeoltechizdat, pp: 50-55.
17. Tsoy, K.S., Rare-Earth Elements and Highly Molecular Oil Compounds. Canada: Modern Applied Science, 2014 in press.
18. Tsoy, K.S., Rare-earth elements as geochemical criteria of oil and gas bearing capacity of rocks. USA: Life Science- Scopus, 2014; 1097-8135 19. Cullers, R., S. Chanduri, N. Kiibane and R.
Koch, Geochimica et Cosmochimica Acta, 1979;
43: 1285.
20. Ugay, Y.A., Valency, chemical bond and degree of oxidation – major terms in chemistry.
Moscow: Chemistry. Higher School, 1997; 53-57.
21. Lopatin, N.V., M.A. Moya and V.A. Trofimov, On geochemical association of elements with oil source sediments and oils of the Western Siberia.
Geochemistry, 1992; 3: 361-367.


![Fig. 6. Variations of REE compositions in the deposit’s organic complex of rocks. REE concentrationsare normalized to chondrite carbonaceous (!1) [11]](https://thumb-us.123doks.com/thumbv2/123dok_us/1245241.1629674/8.576.132.451.516.675/variations-compositions-deposit-organic-concentrationsare-normalized-chondrite-carbonaceous.webp)