I
I
n
n
t
t
e
e
r
r
n
n
a
a
t
t
i
i
o
o
n
n
a
a
l
l
J
J
o
o
u
u
r
r
n
n
a
a
l
l
o
o
f
f
B
B
i
i
o
o
l
l
o
o
g
g
i
i
c
c
a
a
l
l
S
S
c
c
i
i
e
e
n
n
c
c
e
e
s
s
2009; 5(4):331-337 © Ivyspring International Publisher. All rights reservedShort Research Communication
Identification of candidate genes for congenital splay leg in piglets by
al-ternative analysis of DNA microarray data
Steffen Maak
1, Diana Boettcher
2, Jens Tetens
3, Monika Wensch-Dorendorf
2, Gerd Nürnberg
1, Klaus
Wimmers
1, Hermann H. Swalve
2, Georg Thaller
31. Research Institute for the Biology of Farm Animals (FBN) Dummerstorf, D-18196 Dummerstorf, Germany
2. Institute of Animal and Nutritional Sciences, Martin-Luther-University Halle-Wittenberg, D-06108 Halle, Germany 3. Institute of Animal Breeding and Husbandry, Christian-Albrechts-University Kiel; D-24098 Kiel, Germany
Correspondence to: Dr. Steffen Maak, Tel: +49-38208-68850; Fax: +49-38208-68852; E-mail: maak@fbn-dummerstorf
Received: 2009.03.03; Accepted: 2009.04.30; Published: 2009.05.01
Abstract
The congenital splay leg syndrome in piglets is characterized by a temporarily impaired functionality of the hind leg muscles immediately after birth. Etiology and pathogenetic mechanisms for the disease are still not well understood. We compared genome wide gene expression of three hind leg muscles (M. adductores, M. gracilis and M. sartorius) between affected piglets and their healthy littermates with the GeneChip® Porcine Genome Array (Affymetrix) in order to identify candidate genes for the disease. Data analysis with standard algorithms revealed no significant differences between both groups. By application of an al-ternative approach, we identified 63 transcripts with differences in two muscles and 5 genes differing between the groups in three muscles. The expression of six selected genes (SQSTM1, SSRP1, DDIT4, ENAH, MAF, and PDK4) was investigated with SYBRGreen RT - Real time PCR. The differences obtained with the microarray analysis could be confirmed and demonstrate the validity of the alternative approach to microarray data analysis. Four genes with different expression levels in at least two muscles (SQSTM1, SSRP1, DDIT4, and MAF) are assigned to transcriptional cascades related to cell death and may thus indicate pathways for further investigations on congenital splay leg in piglets.
Key words: congenital splay leg, piglet, microarray, RT - Real time PCR
1. Introduction
Congenital splay leg syndrome in newborn pig-lets is the most frequent observation amongst heredi-tary disorders in swine (1). The phenotype is charac-terized by an impaired ability to stand and walk due to a muscular weakness of the hind limbs (2). Losses among affected piglets can amount to 50%, making congenital splay leg to a source of considerable eco-nomic losses in pig production (3).
Despite numerous investigations, the patho-genesis and the etiology of the disease are still poorly understood. Histomorphological investigations, analysis of biochemical criteria as well as investiga-tions on putative candidate genes lead to
likely to be the major pathomorphological feature in splay leg syndrome.
Recent advances in transcriptomics in swine have opened new opportunities for a global survey on the genetic background of complex traits [see (11) for review, (12)]. Consequently, we employed compara-tive, genome wide expression profiling of individual hind leg muscles derived from affected piglets and their healthy littermates. The objective of this inves-tigation was to detect expression differences and, subsequently to identify candidate genes for further investigations on congenital splay leg in piglets.
2. Materials and Methods
2.1 Sample collection and extraction of total RNA
Three male splay leg piglets and 3 healthy lit-termates of similar birth weight (1,795 ± 217 g) were
euthanized immediately post partum in accordance
with German animal protection legislation. Samples of M. sartorius, M. gracilis and Mm. adductores were prepared from each animal, snap frozen and stored at -70°C for further preparation.
Total RNA was isolated using TRIzol Reagent (Sigma, Taufkirchen, Germany) according to the manufacturer's protocol. After DNaseI treatment the RNA was cleaned up with the RNeasy Kit (Qiagen, Hilden, Germany). The quantity of RNA was estab-lished using the NanoDrop ND-1000 spectropho-tometer (Peqlab, Erlangen, Germany) and the
integ-rity was checked by running 1 μg of RNA on a 1%
agarose gel. In addition, absence of DNA contamina-tion was checked using the RNA as a template in standard PCR amplifying fragments of PRL32 and HPRT. The RNA samples were stored at -70°C until processing.
2.2 Array analysis
Muscle expression patterns were assessed using the GeneChip® Porcine Genome Array (Affymetrix, St. Clara, USA). This Array contains 24,123 probe sets representing transcripts from 20,201 Sus scrofa genes. Tsai et al. (2006) improved the annotation of the array by assigning approximately 82% of the transcripts to 11,265 different porcine genes (13). The fragmentation and labeling was performed with the GeneChip® Terminal Labeling Kit (Affymetrix, St. Clara, USA) according to the manufacturer’s recommendations. Five µg of total RNA per sample were used for preparation of antisense, biotinylated RNA for hy-bridization.
Hybridization, washing and scanning of the ar-rays as well as primary data analysis with Affymetrix GCOS 1.3 software was done by Atlas Biolabs (Berlin, Germany). The raw data files were provided along
with a summary of the analysis containing probe set identification, quality measures for the hybridization, the relative expression value and a qualitative meas-ure for the probe sets (present, absent or marginal) for each individual array.
2.3 Data analysis
Bioinformatic analysis of the microarray data was done in 3 steps: (A) quality control of all arrays, (B) preprocessing of all arrays (background correc-tion, normalizacorrec-tion, summary measures for probe sets), and (C) identification of differently expressed genes.
Quality control, data preprocessing and statisti-cal analysis were performed using the R statististatisti-cal
language (Bioconductor Packages, http://www.bioconductor.org/) – employing
meth-ods described by Bolstad et al. (14, 15).
After quality control all arrays could be used for further analysis. Background correction was per-formed using GCRMA (16), normalization by quantile normalization, and summary measures for probe sets were obtained by median polish.
Affymetrix IDs were mapped to the belonging gene symbols based on the assignments available
from the Ensembl database (http://www.ensembl.org), and mean values over all
belonging Affymetrix IDs were calculated. Because pairs of “Control” and “Splay leg” piglets are full sib-lings, a paired t-test was used to assess statistically significant differentially expressed genes (p = 0.05). These test results were adjusted for multiple testing using the false discovery rate (FDR), q-value method (17).
time PCR).
2.4 RT - Real time PCR
Each 250 ng of the RNA preparation used for Array analysis was subjected to reverse transcription with TaqMan® Reverse Transcription Reagents (Ap-plied Biosystems, Darmstadt, Germany) essentially as described by the manufacturer with the supplied random hexamer primers in a ThermalCycler TC1 (Biometra, Weiterstadt, Germany). The resulting
cDNA samples were used for Real time PCR amplifi-cation of six genes.
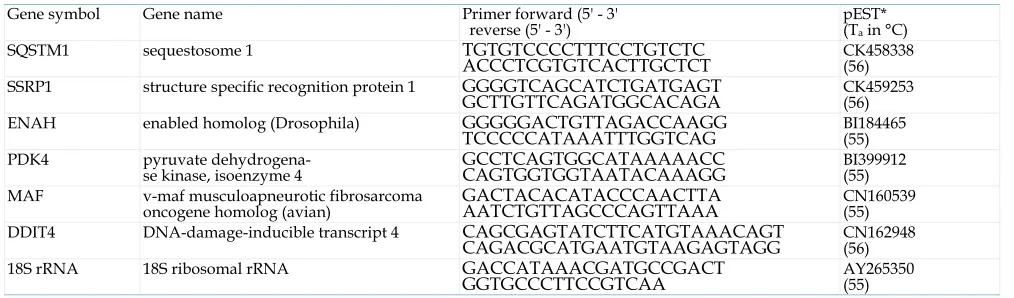
The primers were derived from the same ex-pressed sequence tags (ESTs) used for the develop-ment of the respective probe sets on the Affymetrics GeneChip® Porcine Genome Array. A fragment of the porcine S18 rRNA gene was used for normalization (Table 1).
Table 1 Primer sequences for the genes analyzed with RT - Real time PCR
Gene symbol Gene name Primer forward (5' - 3'
reverse (5' - 3') pEST* (Ta in °C)
SQSTM1 sequestosome 1 TGTGTCCCCTTTCCTGTCTC
ACCCTCGTGTCACTTGCTCT CK458338 (56)
SSRP1 structure specific recognition protein 1 GGGGTCAGCATCTGATGAGT
GCTTGTTCAGATGGCACAGA CK459253 (56)
ENAH enabled homolog (Drosophila) GGGGGACTGTTAGACCAAGG
TCCCCCATAAATTTGGTCAG BI184465 (55)
PDK4 pyruvate dehydrogena-
se kinase, isoenzyme 4 GCCTCAGTGGCATAAAAACC CAGTGGTGGTAATACAAAGG BI399912 (55)
MAF v-maf musculoapneurotic fibrosarcoma
oncogene homolog (avian) GACTACACATACCCAACTTA AATCTGTTAGCCCAGTTAAA CN160539 (55)
DDIT4 DNA-damage-inducible transcript 4 CAGCGAGTATCTTCATGTAAACAGT
CAGACGCATGAATGTAAGAGTAGG CN162948 (56)
18S rRNA 18S ribosomal rRNA GACCATAAACGATGCCGACT
GGTGCCCTTCCGTCAA AY265350 (55) * These porcine ESTs are also the basis for following probe sets on the array: SQSTM1: Ssc.3612.1.S1_at; SSRP1: Ssc.4170.1.1S1_at; ENAH: Ssc.3771.1.A1_at; PDK4: Ssc.10131.1.A1_at; MAF: Ssc.15325.1.S1_at; DDIT4: Ssc.4104.1.S1_at; 18S rRNA: AFFX-SSC-18SrRNA_at.
Real time PCR amplification was performed for all genes under following conditions on an ABI Prism 7000 SDS (Applied Biosystems, Darmstadt, Germany): 2 min at 50 ºC, 15 min at 95 °C followed by 45 cycles of 15 s at 95 ºC, 30 s at Ta (Table 1), and 30 s at 72 ºC.
Melting curve analysis (60-95 °C) and gel electropho-resis (3% agarose) were used for assessing amplifica-tion specificity. The reacamplifica-tion volume of 25 µl con-tained 12.5 µl ImmoMix™ (Bioline, Luckenwalde, Germany) with SYBR® Green and ROX as internal standard, 300 nM of the respective primers (3µl each), 0.5 µl UNG (Uracil-DNA-glycosilase), 3.5 µl nuclease free water and 2.5 µl cDNA. All samples were run in triplicates. Analysis of the expression data was done according to the relative standard curve method (20). A standard curve was derived for each single gene from a serial dilution of the cDNA. Expression values were normalized to the individual expression of 18S rRNA.
3 Results and Discussion
3.1 Gene expression microarray analysis
The analysis of microarrays in different skeletal muscles of the hind legs of splay leg piglets aimed at the generation of a list of genes differentially
ex-pressed between affected and healthy muscle. We initially selected two muscles involved in adduction of the hind legs (Mm. adductores, M. gracilis) for the analysis of gene expression profiles immediately after birth. Additionally, we investigated a muscle in-volved in abduction (M. sartorius) in order to detect more generalized defects in functional differing mus-cles of the hind leg.
Standard data analysis (PLIER or GCRMA with correction for multiple testing, false detection rate [FDR] < 0.10) revealed no significant differences in gene expression between both groups of piglets. Al-though, we expected significant differences between affected piglets and controls, similar results are re-ported from other species. Bye et al. (2008) investi-gated soleus muscle of divergently selected rats (maximum oxygen uptake) under exercise conditions and found only three genes regulated in this experi-ment (21). Thus, we employed an alternative ap-proach for the identification of potential candidate genes.
Merging the three lists resulted in 18 - 24 genes being regulated in two different muscles and 5 genes with differences in three muscles (Figure 1b).
Interestingly, none of six atrophy related genes on the array (SMN1, CBLB, CAST, FBXO32, FOXO1A, SGCD) was differentially expressed in the investi-gated muscles. Mutations in the human SMN1 gene cause spinal muscular atrophy (22) whereas defects in the genes for sarcoglycans (e.g. SGCD) are related to human limb-girdle muscular dystrophy (23). FBXO32, FOXO1A and CBLB were found highly upregulated in patients with atropy of skeletal muscle (24-26). Upregulation of Calpastatin (CAST) was demon-strated to slow atrophic processes in transgenic mice (27). The porcine homologs of these genes were unal-tered in our investigation, thus making the assumed
atrophy as the cause for congenital splay leg unlikely (6).
Functional clustering of the filtered genes [DAVID, (19)] revealed different pathways signifi-cantly regulated in the individual muscles. The bio-logical processes with the highest enrichment scores are "programmed cell death" (GO:0012501 in Mm. adductores), "regulation of transcription, DNA-dependent" (GO:0006355 in M. gracilis) and "cellular protein catabolic process" (GO:0044257 in M. sartorius). However, the term "programmed cell death" ranked second in M. gracilis indicating simi-larities between both adducting muscles. We selected one gene from the top ranked pathways in each mus-cle (DDIT4, SSRP1 and SQSTM1).
DDIT4 (DNA-damage-inducible transcript 4) was shown to be a p63 target gene and is part of an universal expression response to oxidative stress (28). SQSTM1 (sequestosome 1) was among the few genes that were upregulated in skeletal muscle after severe undernutrition in cattle. The putative function of SQSTM1 in skeletal muscle is the regulation of protein degradation (29). SSRP1 (structure specific recogni-tion protein 1) was identified as a co-activator of the transcriptional activator p53 (30).
Additionally, we have chosen three further genes with expression ratios > 2 from M. gracilis (MAF), Mm. adductores (ENAH), and M. sartorius (PDK4) for confirmation of different expression by reverse transcription - real time PCR. MAF (v-maf
musculoapneurotic fibrosarcoma oncogene homolog) is important for developmental processes and is able to induce p53-mediated cell death (31, 32), thus being part of the same signal cascade like SSRP1. In contrast, ENAH (enabled homolog) is required for neural de-velopment (33) and has not yet been described in skeletal muscle. PDK4 encodes a subunit of the py-ruvate dehydrogenase kinase and was recently asso-ciated with muscle water content and intramuscular fat in swine (34).
MAF was identified as different in M. adduc-tores and M. gracilis in the array experiment, DDIT4 was upregulated in Mm. adductores and M. sartorius of splay leg piglets, whereas SQSTM1 and SSRP1 were differently expressed in all investigated muscles.
3.2 Confirmation of differential expression by RT - Real time PCR
RT Real time - PCR was performed with 6 genes identified as potential candidate genes for congenital splay leg from the alternative analysis of the genome wide expression data. The fragments used for primer design were derived from the same porcine ESTs un-derlying the respective, differently expressed probe sets on the microarray. Before primer design, the por-cine ESTs were tested against the current human ge-nome build 36.3 on correctness of the annotation. This could be confirmed for the investigated ESTs (Table 1). Whereas the SSRP1 and DDIT4 were represented by a single probe set on the array, two (SQSTM1, PDK4), three (MAF) and four (ENAH) probe sets were accordingly annotated. The second probe set anno-tated as SQSTM1 (Ssc.6231.1.A1_at) however, re-vealed no similarity with the gene but with ORAI2. This demonstrates that errors in the current annota-tion of the Affymetrix GeneChip® Porcine Genome Array (13) could bias subsequent analyses.
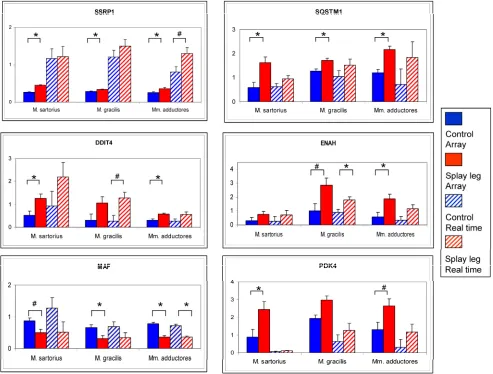
The comparison of the results from microarray analysis and RT - Real time PCR is given in Figure 2.
The numerical trend (up- or down-regulation) of the differences could be confirmed for all investigated genes. However, due to higher dynamic range of the RT - Real time PCR results compared to the array data, only the differences for ENAH (M. gracilis) and MAF (Mm. adductores) reached significance level (Figure 2).
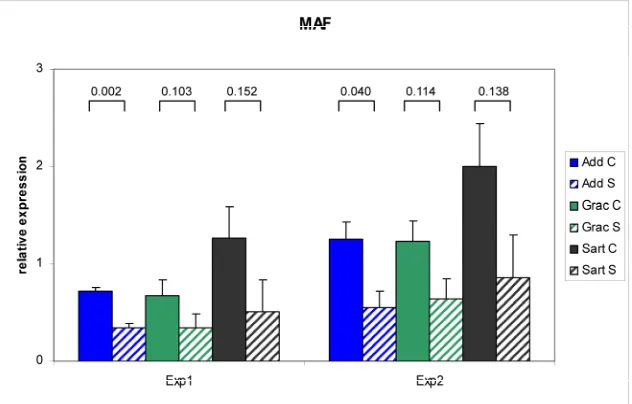
The RT - Real time PCR for MAF was exempla-rily performed in two independent experiments to test the reproducibility of the results (Figure 3). The correlation between the two series over three muscles was 0.97 (n = 18) with a range from 0.92 (Mm. ad-ductores) to 0.99 (M. sartorius). Relative expression values measured with RT - Real time PCR were cor-related to the relative expression data on the array in the range between 0.73 - 0.90. This is in accordance with investigations of Arikawa et al. (2008) demon-strating high comparability of data derived from SYBR Green based Real time PCR with high density microarray results (35). The confirmed different ex-pression of the selected genes in this study provides the basis for further evaluation as candidate genes for congenital splay leg in piglet.
Figure 3 Repeatability of RT Real time - PCR results for MAF. Two independent experiments resulted in com-parable differences in the relative mRNA abundance of MAF between control (C: solid bars) and splay leg piglets (S: dashed bars) in three muscles. The numbers above the brackets denote the p-values for the comparison of the means within each muscle (see legend).
4. Conclusion
This study demonstrates a successful application of alternative analysis methods to detect differentially expressed genes in a genome wide expression study when standard methods fail. SYBR Green RT - Real
con-genital splay leg in piglets.
Acknowledgements
This study was supported in part by the German Federal Ministry of Education and Research (BMBF), Program FUGATO - Functional Genome Analysis in Animal Organisms (Project HeDiPig – Hereditary Diseases in Pig; grant no. 0313392D). The helpful comments of three anonymous reviewers are ac-knowledged.
Conflict of interests
The authors declare that no conflict of interest exists.
References
1. Partlow GD, Fisher KR, Page PD, et al. Prevalence and types of birth defects in Ontario swine determined by mail survey. Can J Vet Res. 1993; 57:67-73.
2. Thurley DC, Gilbert FR, Done JT. Congenital splayleg of piglets: myofibrillar hypoplasia. Vet Rec. 1967; 80:302-304.
3. Dobson KJ. Congenital splayleg of piglets. Aust Vet J. 1968; 44:26-28.
4. Ward PS, Bradley R. The light microscopical morphology of the skeletal muscles of normal pigs and pigs with splayleg from birth to one week of age. J Comp Pathol. 1980; 90:421-431. 5. Jirmanova I. The splayleg disease: a form of congenital
gluco-corticoid myopathy? Vet Res Commun. 1983; 6:91-101.
6. Ooi PT, da Costa N, Edgar J, Chang KC. Porcine congenital splayleg is characterised by muscle fibre atrophy associated with relative rise in MAFbx and fall in P311 expression. BMC Vet Res. 2006; 2:23.
7. Boettcher D, Paul S, Bennewitz J, et al. Exclusion of NFYB as candidate gene for congenital splay leg in piglets and radiation hybrid mapping of further five homologous porcine genes from human chromosome 12 (HSA12). Cytogenet Genome Res. 2007; 118:67-71.
8. Boettcher D, Schmidt R, Rehfeldt C, et al. Evaluation of MAFbx expression as a marker for congenital splay leg in piglets. Dev Biol (Basel). 2008; 132:301-306.
9. Björklund NE, Svendsen J, Svendsen LS. Histomorphological studies of the perinatal pig: comparison of five mortality groups with unaffected pigs. Acta Vet Scand. 1987; 28:105-116. 10. Curvers P, Ducatelle R, Vandekerckhove P, et al. Morphometric
evaluation of myofibrillar hypoplasia in splayleg piglets. Dtsch Tierarztl Wochenschr. 1989; 96:189-191.
11. Tuggle CK, Wang Y, Couture O. Advances in swine transcrip-tomics. Int J Biol Sci. 2007; 3:132-152.
12. Ponsuksili S, Jonas E, Murani E, et al. Trait correlated expres-sion combined with expresexpres-sion QTL analysis reveals biological pathways and candidate genes affecting water holding capacity of muscle. BMC Genomics. 2008; 9:367.
13. Tsai S, Cassady JP, Freking BA, et al. Annotation of the Affy-metrix porcine genome microarray. Anim Genet. 2006; 37:423-424.
14. Bolstad BM, Irizarry RA, Åstrand M, Speed TP. A comparison of normalization methods for high density oligonucleotide ar-ray data based on bias and variance. Bioinformatics. 2003; 19:185–193.
15. Bolstad BM, Collin F, Brettschneider J, et al. Quality Assessment of Affymetrix GeneChip Data in Bioinformatics and Computa-tional Biology Solutions Using R and Bioconductor. In:
Gen-tleman R, Carey V, Huber W, Irizarry R, Dudoit S, eds. Statistics for Biology and Health, Heidelberg: Springer; 2005: 13-47. 16. Storey JD. A direct approach to false discovery rates under
dependence. J R Stat Soc Ser B. 2002; 64:479-498.
17. Wu Z, Irizarry RA, Gentleman R, et al. A Model-Based Back-ground Adjustment for Oligonucleotide Expression Arrays. J Am Stat Ass. 2004; 99:909-917.
18. SAS Institute Inc. SAS Version 9.1. Cary, NC, USA: SAS Insti-tute Inc. 2003.
19. Dennis GJr, Sherman BT, Hosack DA, et al. DAVID: Database for Annotation, Visualization, and Integrated Discovery. Ge-nome Biol. 2003, 4:P3.
20. [Internet] Applied Biosystems (User Bulletin # 2). http://www3.appliedbiosystems.com/cms/groups/mcb_sup port/documents/generaldocuments/cms_040980.pdf 21. Bye A, Høydal MA, Catalucci D, et al. Gene expression
profil-ing of skeletal muscle in exercise-trained and sedentary rats
with inborn high and low VO2max. Physiol Genomics. 2008;
35:213-221.
22. Gangwani L, Mikrut M, Theroux S, et al. Spinal muscular at-rophy disrupts the interaction of ZPR1 with the SMN protein. Nat Cell Biol. 2001; 3:376-383.
23. Duggan DJ, Gorospe JR, Fanin M, et al. Mutations in the sar-coglycan genes in patients with myopathy. N Engl J Med. 1997; 336:618-624.
24. Csibi A, Leibovitch MP, Cornille K, et al. MAFbx/Atrogin-1 controls the activity of the initiation factor eIF3-f in skeletal muscle atrophy by targeting multiple C-terminal lysines. J Biol Chem. 2009; 284:4413-4421.
25. Ogawa T, Furochi H, Mameoka M, et al. Ubiquitin ligase gene expression in healthy volunteers with 20-day bedrest. Muscle Nerve. 2006; 34:463-469.
26. Léger B, Cartoni R, Praz M, et al. Akt signalling through GSK-3beta, mTOR and Foxo1 is involved in human skeletal muscle hypertrophy and atrophy. J Physiol. 2006; 576:923-933. 27. Tidball JG, Spencer MJ. Expression of a calpastatin transgene
slows muscle wasting and obviates changes in myosin isoform expression during murine muscle disuse. J Physiol. 2002; 545:819-828.
28. Han ES, Muller FL, Pérez VI, et al. The in vivo gene expression signature of oxidative stress. Physiol Genomics. 2008; 34:112-126.
29. Lehnert SA, Byrne KA, Reverter A, et al. Gene expression pro-filing of bovine skeletal muscle in response to and during re-covery from chronic and severe undernutrition. J Anim Sci. 2006; 84:3239-3250.
30. Zeng SX, Dai MS, Keller DM, Lu H. SSRP1 functions as a co-activator of the transcriptional activator p63. EMBO J. 2002; 21:5487-5497.
31. Blank V, Andrews NC. The Maf transcription factors: regulators of differentiation. Trends Biochem Sci. 1997; 22:437-441. 32. Hale TK, Myers C, Maitra R, et al. Maf transcriptionally
acti-vates the mouse p53 promoter and causes a p53-dependent cell death. J Biol Chem. 2000; 275:17991-17999.
33. Urbanelli L, Massini C, Emiliani C, et al. Characterization of human Enah gene. Biochim Biophys Acta. 2006; 1759:99-107. 34. Lan J, Lei MG, Zhang YB, et al. Characterization of the porcine
differentially expressed PDK4 gene and association with meat quality. Mol Biol Rep. 2008; [Epub ahead of print]