TRAFFIC RISK MAPPING – RISK DISTRIBUTION AMONG THE
MUNICIPALITIES IN MONTENEGRО
M.Sc. Grdinic M.
1, Prof. Vladimir Pajkovic, PhD.
1Faculty of Mechanical Engineering – University of Montenegro
1grdinicm@ac.me; pajkovic@ac.me
Abstract: Accident analysis plays an important part in the strategy to reduce road accidents. To significantly reduce traffic fatalities and
serious injuries on public roads, there is need to review the characteristics of motor vehicle accidents and identify the hidden patterns behind the accidents. Identifying traffic accident concentration area is important for road safety improvements. Determining the risk rate in road traffic and its spatial distribution may indicate the areas that are more at risk in traffic in proportion to others. Beside, such analysis can identify differences in the nature of the problem among spatial units on the territory of a country. An analysis of spatial traffic risk distribution among the municipalities on the territory of the Montenegro has been conducted. The results of the study indicate that there is a significant difference in the amount of traffic risk among the municipalities.
Keywords: TRAFFIC SAFETY, MOTOR VEHICLE ACCIDENTS, RISK MAPPING
1. Introduction
In Montenegro in the last ten years, the number of persons killed in road traffic is reduced. However, it is still not enough to be compared with the developed countries of the European Union. According to EU statistics, the rate in terms of fatalities per 100,000 populations in Montenegro in 2012 was 29.6; while in EU countries this indicator varies from 2.5 to 18.7, /1/. As well, Montenegro’s road network is high risk, including those segments with a high traffic volume, /2/. Many road crashes are preventable and history provides evidence that the right intervention can make a significant positive impact. In order to make progress in road safety, comprehensive data collection and in-depth data analysis are essential in terms of designing effective safety strategies, setting challenging targets, determining intervention priorities and monitoring program effectiveness. In May 2011, the United Nations launched a Decade of Action for Road Safety. The goal of the Decade (2011–2020) is to stabilize and reduce the increasing trend in road traffic fatalities, saving an estimated 5 million lives over the period. This report builds on the 2009 report, and provides additional data in a number of important areas. It is supported by a Global Plan for Road Safety, /3/. In Montenegro, National Coordination Board was established to monitor road safety parameters. In addition, government adopted Strategy for
efficient traffic (2008), /4/, Strategy for improvement of road
traffic safety 2010-2019, /5/, and Action plan for Strategy for improvement of road traffic safety implementation (2011), /6/. The main goal of this strategy is to reduce number of fatalities by 30% and injuries by 20% before 2014 (compared to 2007). The long-term goal is to reduce these figures by 50% and 30% respectively by 2019, compared to the same year.
To significantly reduce traffic fatalities and serious injuries on public roads, we need to review the characteristics of motor vehicle accidents and identify the hidden patterns behind the accidents’ records, referring mainly to the actual knowledge contained in the collision data rather than the raw data records themselves. Thus, identifying traffic accident concentration area is important for road safety improvements. The main objective of road safety ranking is to identify sections that carry the highest individual risk, i.e. where the probability of a fatal road accident is the highest, and sections that carry the highest societal risk and offer strong potential for reducing accident costs as a result of treatment undertaken by road managers.
2. Risk mapping
Risk maps are colour-coded maps showing the relative risk to an individual road-user of being involved in fatal and serious crashes or relative risk of fatal and serious injury on individual road sections across a road network. Risk maps are statistically
designed to support national road safety strategies and add an extra layer of information alongside existing approaches. These maps each gave useful information in building up the overall
picture of safety performance of the network. It was concluded
that accident databases could be established that enabled comparative risk maps to be drawn for different municipalities, and provided useful information on the difference in risk rate. Focus of the risk mapping is to inform the road user how and where he needs to modify his behaviour to minimize risk – i.e. to enable him to recognize the sources of risk on different types of road. Alongside this should be the recognition that risk cannot be eliminated on all roads through infrastructure changes, and that the road user must take a share in the responsibility for a safe road system.
There is variation in methodology for identification of critical zones or black spots and checking road safety level, such as: road safety impact assessment, road safety audit, road safety inspection (periodic road safety inspection, night-time road safety inspection, railway crossing inspection, tunnel inspection, destination-sign inspection, inspection of other road signs and traffic devices, ad-hoc road safety inspection), in-depth studies, black spot management, network safety management, etc.
In the last few decades, road safety has become a high priority in many governments’ policy-making. During 2001, a process of risk rate mapping was developed by TRL for the European Road Assessment Programme, /7/, to enable the risk of fatal and serious injury accidents occurring on different parts of the British primary road network to be compared. As a second stage of risk comparison, a risk rating system was developed which ranked road sections according to their road design features. This rating process was first used extensively in Sweden and Germany, but was subsequently applied in other European countries including the United Kingdom, /8/.
As critical zones were defined as an area or location where there is a higher likelihood for an accident to occur based on historical data and spatial dependency, /9/, within this area it is possible to determine micro location – an accident-prone spot (black spot) – place with a higher number of accidents compared to other
similar spots due to local risk factors. The definition of black
spot is different from country to country. Many definitions of
accident-prone spots are available through research emphasizes that there is no comprehensive definition of what is accepted as a hazard, /10/.
Montenegro has started a Black spot management with risk mapping in 2007 under the responsibility of Road Directorate and there are proposals under discussion to add a special department for road safety issues (road safety unit) in the level of
the Ministry of Transport. Neighbor countries, Serbia and
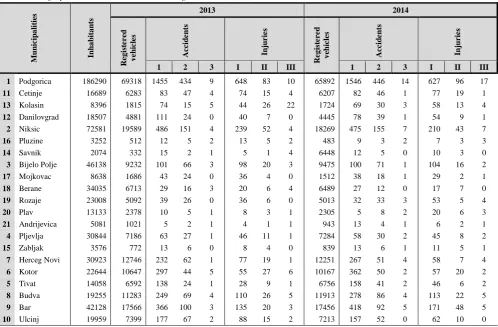
Table 1 Demographic and accidents data, Montenegro 2013 –2014
From 2011 to 2013 Serbia realized project “Consulting services for road safety – technical support”, /11/. Project complied report about identification and black spots recovery. Collecting, sorting and analyzing traffic accident data, identification of dangerous locations, ranging, analyzing causes of accidents, planning recovery measures of black spots, implementation and assessment are in detail explained in report. Also, the most frequent contra-measures are presented. Alike action were undertaken in Croatia: Government of Croatia adopted Strategy of traffic development of the Republic of Croatia 2014-2030, /12/, where was implemented “Black spots recovery programme”.
3. Methodology
Many countries and cities have applied various methods to identify dangerous locations with the real situation of road traffic. Currently the main form of numerically risk assessment in road transport area is usually defined by recorded numbers of fatalities (or casualties) and some measures of exposure. A researchers may use different indicator of exposure (e.g. size of population, time in traffic, traffic density) to describe traffic risk. International Traffic Safety Data and Analysis Group (IRTAD) pointed out that the three most frequently used measures of exposure to risk are: population size, the number of registered vehicles, and the distance travelled, /13/. Rates expressed as density or total number of crashes on a road over a given travelled distance and the traffic flow can show more real situation on roads than those mentioned earlier.
The crash data in Montenegro is collected by police officers as an adjudication record. Vital information on exact crash location, road geometry and condition, etc. is missing from the data and thus incomplete for any scientific crash investigation. Also, the management and mechanism to share the available data with other stakeholders, as well as a reliable data of traffic flow, is also
missing. Accordingly, in this paper only demographic (by
population size) and traffic risk (by registered vehicles) are observed.
In road accidents statistics in Montenegro, accidents were categorized in: fatal accidents, serious injury accidents, slight injury accidents and damage only accidents, /15/. Both, number of accidents and injuries are weighted with following coefficients recommended by British ministry of transport:
Accidents:
1 = accidents only with damage 20÷50 =injury accidents 150 = fatal accidents;
Injuries:
1 = slight injuries 5 = serious injuries 50 = fatal injuries.
The road safety ranking is based on a methodology used in the
EuroRAP Programme, /7/. In order to show the varying levels of
risk across municipalities, individual sections are allocated into one of five colour coded risk bandings, which represent standard RAP Road Risk Mapping colour palette. The colour palette has been designed to meet the following criteria:
Achieves international consensus;
Is based on the significance of particular colors (such
as black and red to signify danger) in different countries and is therefore meaningful to a wide audience;
Adjoining colors are easily distinguishable from one
another;
Ensures that the information is clear and
distinguishable when presented in a variety of media (online, print, high resolution, low resolution).
Additionally, in this paper, because of wide dispersion of extreme data, median (Me) as a measure of central tendency was used to obtain the thresholds for each risk banding.
4. Results and discussion
Table 1 shows basic data for Montenegro for 2013 and 2014. Number of inhabitant is based on population census from 2011.
M u n ic ip a lit ie s Inha bi ta nt s
2013 2014
R eg is tered v eh icl es A cci d en ts Inj ur ie s R eg is tered v eh icl es A cci d en ts Inj ur ie s
1 2 3 I II III 1 2 3 I II III
1 Podgorica 186290 69318 1455 434 9 648 83 10 65892 1546 446 14 627 96 17
11 Cetinje 16689 6283 83 47 4 74 15 4 6207 82 46 1 77 19 1
13 Kolasin 8396 1815 74 15 5 44 26 22 1724 69 30 3 58 13 4
12 Danilovgrad 18507 4881 111 24 0 40 7 0 4445 78 39 1 54 9 1
2 Niksic 72581 19589 486 151 4 239 52 4 18269 475 155 7 210 43 7
16 Pluzine 3252 512 12 5 2 13 5 2 483 9 3 2 7 3 3
14 Savnik 2074 332 15 2 1 5 1 4 6448 12 5 0 10 3 0
3 Bijelo Polje 46138 9232 101 66 3 98 20 3 9475 100 71 1 104 16 2
17 Mojkovac 8638 1686 43 24 0 36 4 0 1512 38 18 1 29 2 1
18 Berane 34035 6713 29 16 3 20 6 4 6489 27 12 0 17 7 0
19 Rozaje 23008 5092 39 26 0 36 6 0 5013 32 33 3 53 5 4
20 Plav 13133 2378 10 5 1 8 3 1 2305 5 8 2 20 6 3
21 Andrijevica 5081 1021 5 2 1 4 1 1 943 13 4 1 6 2 1
4 Pljevlja 30844 7186 63 27 1 46 11 1 7284 58 30 2 45 8 2
15 Zabljak 3576 772 13 6 0 8 4 0 839 13 6 1 11 5 1
7 Herceg Novi 30923 12746 232 62 1 77 19 1 12251 267 51 4 58 7 4
6 Kotor 22644 10647 297 44 5 55 27 6 10167 362 50 2 57 20 2
5 Tivat 14058 6592 138 24 1 28 9 1 6756 158 41 2 46 6 2
8 Budva 19255 11283 249 69 4 110 26 5 11913 278 86 4 113 22 5
9 Bar 42128 17566 366 100 3 135 20 3 17456 418 92 5 171 48 5
10 Ulcinj 19959 7399 177 67 2 88 15 2 7213 157 52 0 62 10 0
Table 2 Risk band thresholds (2 years assessment period)
Annual average values for demographic risk rang thresholds (Me
for accidents and injuries retrospectively: Meac=619.91;
Mein=103.94) and traffic risk rang (Meac =195.18; Mein =37.64)
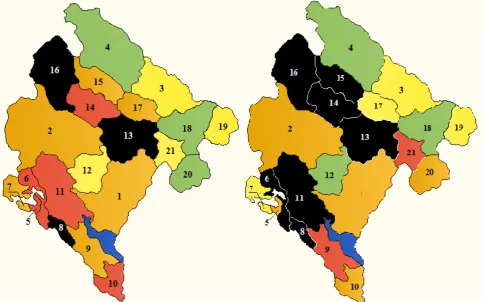
for two-years data period is presented in Table 2. Demographic risk was shown as weighted number of accidents and injuries per 100,000 inhabitants; while traffic risk was shown as weighted accidents and injuries per 10,000 registered vehicles. Risk rate maps for those are presented on Fig. 1 and Fig. 2.
Critical zones were north and central municipalities, especially 13 (Kolasin) and 16 (Pluzine) where both, demographic and traffic risk were twice as high as average. High risk rates are also recorded in municipalities: 8, 14, 15, 16, 17, and 21. The lowest risk of being involved in accidents or injured in it, were in municipalities 4 (Pljevlja) and 18 (Berane). It can be observed that there are a large number of municipalities defined as ‘high risk’. Therefore, it’s not surprising that on Montenegro roads 75 black spots have been identified during Black Spot Management programme, where 18 have been alarming, mostly in municipalities
identified as very risky. To understand picture of road safety in Montenegro it should be noted that the large number of tourists’ vehicles were involved in traffic flow during summer season. That’s reason why smaller municipalities (with small number of
registered vehicles: municipalities No 14, 15, 20, 21 on figs) were
with ‘high’ rang when observing traffic risk. Also, those were municipalities with main and regional roads. One of the reasons for bad road safety situation in Montenegro is inapproachable (rough) terrain. Main road, from north border (with Serbia) to capital city (Podgorica) and seaside, is through canyon. The quality of road network in Montenegro, as well as transport safety will be enhanced with the construction of two highways Bar-Boljare and Jadransko–Jonski highway, in accordance with Transport Strategy of Montenegro.
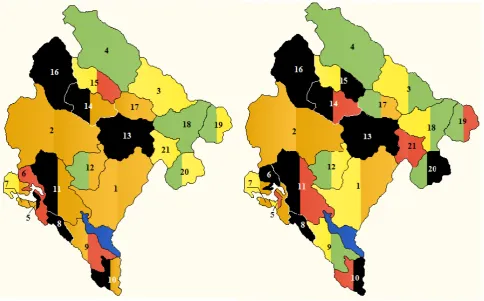
Figure 3 and figure 4 presents change of demographic and traffic risk from 2013 to 2014. Risk for 2013 is presented on the left side of contour of municipality and risk for 2014 on the right side of municipality. It can be observed that in most cases there was impairment of road safety. Like in following municipalities: 5, 7, 12, 15, 19, and 20. In few municipalities improvement of road safety has been recorded: 6, 10, and 11. However, this was more a coincidence rather than progress due to undertaken measures. The most critical zones stayed critical during both years
Accidents per 100,000 inhabitants Injuries per 100,000 inhabitants
Figure 1 Demographic risk rate for assessment period Risk level
Demographic risk Traffic risk Range
(color) Accidents Injured Accidents Injured
2013-2014
Low < 247.96 < 41.57 < 78.07 < 15.05
Low-medium 247.96 to
495.93
41.57 to 83.15
78.07 to 156.14
15.05 to 30.10
Medium 495.93 to
743.89
83.15 to 124.73
156.14 to 234.21
30.10 to 45.15
Medium-high 743.89 to 991.85 124.73 to 166.30 234.21 to 312.29 45.15 to 60.20
Accidents per 10,000 vehicles Injuries per 10,000 vehicles
Figure 2 Traffic risk rate for assessment period
Accidents per 100,000 inhabitants Injuries per 100,000inhabitants
Accidents per 10,000 vehicles Injuries per 10,000 vehicles
Figure 4 Traffic risks changing in Montenegro from 2013 (left side of contours) to 2014 (right side of contours)
5. Conclusion
In the last few decades, road safety has become a high priority in many governments’ policy-making, and is now a critical item on the political agenda. On the developing countries, such as Montenegro, the problem is even greater due to the growing number of cars, the poor quality of road projects and the lack of
legislation related to driving and safety. As the absolute number
of accidents cannot well reflect the road safety, the concept of
relative risk indicator is proposed. Risk mapping, by its very
nature, relies on the use of historic crash and/or traffic flow data, and shows the combined influence of behavior, road and vehicle. Here, analyses have been made of fatal and serious accidents occurring on the Montenegro road network during 2013 and 2014. Mapping the risk occurs there is high difference in risk values between roads/municipalities which may reproduce false road safety picture. For the individual road user, it is important to understand both the role of the infrastructure and the role of their own behaviour in determining the risk they face on the road. It is important to recognize that not all roads can be managed to the same risk level, but at the same time to seek to keep the risk within acceptable bounds for those roads with the highest levels of risk. For the road provider, the most immediate need is to decide how best to improve the collective risk across the network, primarily in terms of how to spend available budgets most effectively.
References
/1/ Organization for Economic Co-operation and Development/
International Transport Forum (OECD/ITF), Trends in the Transport Sector 1970–2010, 2012.
/2/ COWIS A/S, World Bank – Road Safety Survey Montenegro,
Final Report, 2008.
/3/ European Commission, Directorate General for Mobility
and Transport, Road safety evolution in EU, 2012.
/4/ Ministry of transport and maritime affairs, Strategy for
efficient traffic in Montenegro, Podgorica, 2008.
/5/ Ministry of interior, Strategy for improvement of road traffic
safety 2010-2019, Podgorica, 2009.
/6/ Government of Montenegro, Action plan for Strategy for
improvement of road traffic safety implementation, 2011. /7/ RAP Road Risk Mapping Manual: Technical Specification,
Available in: http://downloads.irap.org/docs/RAP-RM-2-1 _Risk_Mapping_technical_specification.pdf
/8/ Lynam D., TRL, Development of risk models for the road
assessment programme, 2012.
/9/ Wang J., A traffic accident risk mapping framework, UCGE
Reports No 20353, 2012.
/10/ Sadeghi A. et al, Identification and prioritization of hazardous
road locations by segmentation and data envelopment analysis approach, Promet – Traffic&Transportation, Vol.
25, No 2, pp. 127-136, 2013.
/11/ Louis Berger SAS, Consulting services for road safety –
technical support, Beograd, 2013.
/12/ Government of Croatia, Strategy of traffic development of
the Republic of Croatia 2014-2030, Zagreb, 2014.
/13/ Organization for Economic Co-operation and Development/
International Transport Forum (OECD/ITF), International Traffic Safety Data and Analysis Group: IRTAD Annual Report 2011, Paris, 2012.
/14/ RAP Road Risk Mapping Manual: Design Specification, Available in: http://downloads.irap.org/docs/RAP-RM-3-1 _Risk_Mapping_design_specification.pdf
/15/ Monstat, Accident research methodology, Available in:
http://www.monstat.org/
/16/ Pajkovic V., Grdinic M., Road safety – perfomance and
perception, Montenegro case study, International Conference on Traffic and Transport Engineering, Belgrade, 2014.
/17/ Grdinic M., Pajkovic V., Traffic risk mapping (in Serbian),