PROOFS
BJR
UNCORRECTED
A kernel-based dose calculation algorithm for kV photon beams
with explicit handling of energy and material dependencies
Anna Merle Reinhart,
Martin F Fast,
Peter Ziegenhein,
Simeon Nill,
and Uwe Oelfke
Joint Department of Physics at The Institute of Cancer Research and The
Royal Marsden NHS Foundation Trust, London, UK SM2 5NG
Short title:
A kernel-based kV dose engine
Type of manuscript:
Full paper
Acknowledgements:
Research at the ICR is also supported by
Cancer Research UK under Programme C33589/A19727. MFF is
supported by Cancer Research UK under Programme
C33589/A19908.
Title Page
© 2016 The Authors. Published by the British Institute of Radiology under the terms
of the Creative Commons Attribution-NonCommercial 4.0 Unported License
PROOFS
BJR
UNCORRECTED
A kernel-based dose calculation algorithm for kV photon beams
with explicit handling of energy and material dependencies
Objectives: Mimicking state-of-the-art patient radiotherapy with high precision irradiators for small animals is expected to advance the understanding of dose-effect relationships and radiobiology in general. We work on the implementation of intensity modulated radiotherapy-like irradiation schemes for small animals. As a first step we present a fast analytical dose calculation algorithm for keV photon beams.
Methods: We follow a superposition-convolution approach adapted to kV x-rays, based on previous work for microbeam therapy. We assume local energy deposition at the photon interaction point, due to the short electron ranges in tissue. This allows us to separate the dose calculation into locally absorbed primary dose and the scatter
contribution, calculated in a point kernel approach. We validate our dose model against Geant4 Monte Carlo simulations, and compare the results to Muriplan (XStrahl Ltd, Camberley, UK).
Results: For field sizes of 1 mm to 1 cm in water, the depth dose curves show a mean disagreement of 1.7% to Monte Carlo simulations, with the largest deviations in the entrance region (4%) and at large depths (5% at 7 cm). Larger discrepancies are observed at water-to-bone boundaries, in bone and at the beam edges in slab phantoms and a mouse brain. Calculation times are in the order of 5s for a single beam.
Conclusions: The algorithm shows good agreement with Monte Carlo simulations in an initial validation. It has the potential to become an alternative to full Monte Carlo dose calculation.
Advances in knowledge: The presented algorithm demonstrates the potential of kernel-based dose calculation for kV photon beams. It will be valuable in IMRT and inverse treatment planning for high precision small animal radiotherapy.
I. INTRODUCTION
Mimicking the spatial and temporal dose distributions delivered in state-of-the-art patient treatment in a pre-clinical setting is expected to advance dose-effect studies and
radiobiological investigations.1 To this effect, a number of research groups have
developed precision radiotherapy systems for small animals.2-7 In contrast to
conventional pre-clinical irradiations, these systems allow positioning and irradiation of tissues of interest with sub-millimetre accuracy. Common features of high precision irradiation devices consist of a 225kVp x-ray tube mounted on a rotating gantry, a precise collimation system down to 0.5mm beam size, a robotic couch as well as on-board cone-beam computed tomography (CBCT) and planar imaging.
From a hardware point of view, these irradiators are capable of delivering complex dose distributions. However, sophisticated dose calculation and treatment planning
systems (TPS) are still required to fully exploit their potential.8 Clinically available tools
designed for patient treatment are not suitable for small animal radiotherapy, due to the
different energy regime (kV instead of MV) and much smaller field sizes.9 In addition,
the workflow in pre-clinical irradiations differs from patient treatment. The anaesthetised animal is imaged, planned, and treated subsequently in one anaesthesia setting of approximately 15 minutes, which requires especially short treatment planning times.
The introduction of pre-clinical precision irradiators has sparked the development of
dedicated dose calculation methods for treatment planning tools.9 Different approaches
Revised Manuscript - Clean
PROOFS
BJR
UNCORRECTED
were pursued, from a measurement-based method10 and a superposition-convolution
algorithm11-13 to Monte Carlo-based dose calculation algorithms.14-16 The available
planning tools for pre-clinical radiotherapy currently support forward-planned dose delivery techniques with open treatment fields from multiple beam directions or arcs,
with the recent addition of beam-on time optimization.17
We intend to further advance pre-clinical radiotherapy by developing intensity modulated dose delivery techniques based on inverse planning strategies. The small animal specific workflow combined with inverse optimization requires an accurate and fast dose calculation. While Monte-Carlo-based dose calculation algorithms are the gold standard in terms of accuracy, they generally suffer from long calculation times. Kernel-based methods permit fast dose calculations, but introduce inherent uncertainties at tissue boundaries, and care has to be taken to correctly model the kV photon interactions with matter. In this work, we present a superposition-convolution dose engine, with explicit handling of energy and material dependencies.
II. MATERIALS AND METHODS
A. Dose calculation
When comparing photon beam interactions of kV and MV energy spectra three main differences have to be accounted for. First, the importance of the photo-electric effect for kV energies is increased. The cross-section of the photo-electric effect scales with the
atomic number as Z3-4, introducing a strong material dependence of the absorption
coefficients. Therefore, knowledge of the electron density alone is no longer sufficient, but information on the tissue composition is also required. Additionally, the cross-section depends strongly on the photon energy. Second, the angular distribution of the differential cross section for Compton scattering changes. Instead of being strongly forward-peaked, the angular distribution of scattering angles is more isotropic. Finally, the range of secondary electrons in water is much shorter for kV energies, in the order of a few μm to a few hundred μm. Thus, energy is transported through matter by scattered photons, rather than secondary electrons, and the build-up effect is small.
These peculiarities have to be accounted for and modelled in any dose calculation algorithm for kV photons. Our approach to do so is based on a superposition-convolution algorithm. Superposition-superposition-convolution is a two-step process. First, the local
photon fluence at any point x⃗ is determined via the total energy released per unit mass
(TERMA)
TERMA(𝑥 , 𝐸) = 𝜙
0𝐸
𝜇(𝑥 , 𝐸)
𝜌
𝑚𝑎𝑠𝑠exp [− ∫ 𝜇(𝛾(𝑠), 𝐸)d𝑠
𝛾], (1)
with the initial photon fluence 𝜙0, the energy E, the attenuation coefficient μ, the mass
density ρmass and the path of the photons γ. The dose is then calculated as a convolution
of the TERMA with a dose deposition kernel.
1. Dose model
Our dose model is based on previous work on microbeam radiation therapy
(MRT).18,19 In MRT targets are irradiated with parallel kV photon microbeams with a
width of a few micrometres. In this approach,18 interactions of photons and electrons
with matter are treated separately due to their different ranges in tissue. The dose deposition kernel is split into a photon kernel and an electron kernel. For small animal
PROOFS
BJR
UNCORRECTED
radiotherapy, this can be further simplified. Electrons with an energy of 80keV, the mean energy of the commercially available systems, have a range of approximately 100μm in water. This is of the same order of magnitude as the voxel size. We therefore assume local energy deposition at the primary photon interaction site.
For simplicity, we briefly describe the algorithm assuming monoenergetic beams in homogeneous media. The dose deposition kernel can be separated into energy deposited locally by the primary interaction and a scatter kernel. At the primary interaction point, the average fraction
𝑓𝐸 = 𝑞𝑃 + 𝑞𝐶· 𝑝𝐶 = (1 − 𝑞𝐶− 𝑞𝑅) + 𝑞𝐶· 𝑝𝐶 (2)
of the photon energy is transferred to the medium.19 qP , qC and qR denote the
probabilities for the photo-electric effect, Compton and Rayleigh scattering respectively,
defined as the ratio of absorption coefficients μ, 𝑞interaction = 𝜇interaction/𝜇total. pC is the
energy fraction transferred to Compton electrons.19 The primary dose can thus be
expressed as
𝐷𝑝𝑟𝑖𝑚𝑎𝑟𝑦(𝑥 ) = 𝑓𝐸 · TERMA(𝑥 ). (3)
All further energy deposition by scattered particles is treated in a point kernel approach. The scatter dose contribution is calculated as a convolution of TERMA with a pre-calculated dose deposition kernel (c.f. section II A 3)
𝐷𝑠𝑐𝑎𝑡𝑡𝑒𝑟(𝑥 ) = Kernel ∗ TERMA(𝑥 ). (4)
The total dose deposited is the sum of primary and scatter contributions 𝐷𝑡𝑜𝑡𝑎𝑙 =
𝐷𝑝𝑟𝑖𝑚𝑎𝑟𝑦+ 𝐷𝑠𝑐𝑎𝑡𝑡𝑒𝑟.
To account for the energy and material dependencies of the absorbed dose, the calculations outlined above are performed for a discrete set of monoenergetic photons and homogeneous materials. The absorbed dose in inhomogeneous media irradiated by polychromatic beams is calculated as an energy-weighted sum of these contributions:
𝐷(𝑥 ) = ∑ 𝑤
𝐸[𝑓
𝐸· TERMA(𝑥 , 𝐸) + ∑(Kernel(𝐸, 𝑀) ∗ TERMA(𝑥 , 𝐸, 𝑀))
𝑁𝑀𝑀
]
𝑁𝐸𝐸
,
(5)
where wE is the weight of the energy bin in the spectrum with ∑ 𝑤𝐸 = 1, and NE and NM
are the numbers of energy and material components.
2. Handling of energy and material dependencies
As discussed in section II A 1, the dose is calculated as a weighted sum of discrete energy and material contributions. The number of chosen calculation points balances accuracy and runtime. We currently employ 6 photon energies and 10 different materials.
The energy sampling points are spaced equally in the cumulative energy-weighted
spectrum. The weights wE are given by the spectral integral of the energy bin and satisfy
∑ 𝑤𝐸 = 1. The energy values and respective weights for the small animal radiation
research platform (SARRP, XStrahl Ltd., Camberley, UK) are given in table I.
The dose calculation requires knowledge of the absorption coefficients of the irradiated materials, which depend on the tissue composition in addition to the density for kV dose calculation. The tissue parameters are extracted from the Hounsfield units
PROOFS
BJR
UNCORRECTED
TABLE I: Sampling points of the energy spectrum and their respective weighting factors wE.
E [keV] 45 60 80 105 130 170
wE 0.2004 0.3811 0.1344 0.1097 0.0950 0.0794
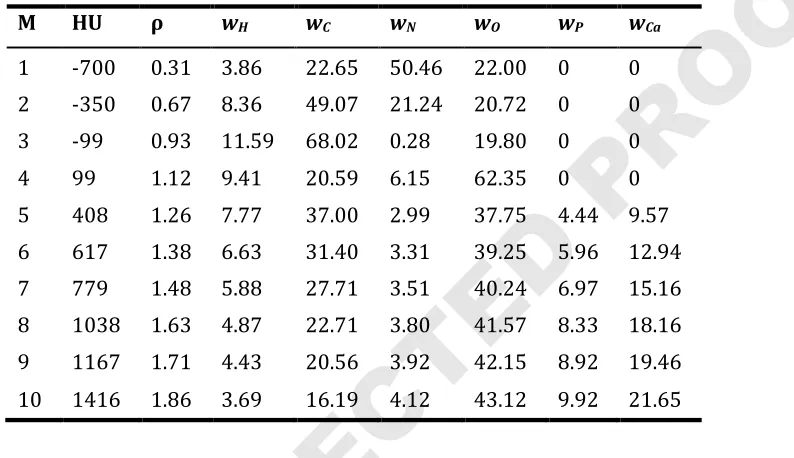
TABLE II: List of materials for which the scatter dose kernels are pre-calculated. The
density ρ is given in gcm-3, and the elemental weights wi are weight fractions in %.
M HU ρ wH wC wN wO wP wCa
1 -700 0.31 3.86 22.65 50.46 22.00 0 0
2 -350 0.67 8.36 49.07 21.24 20.72 0 0
3 -99 0.93 11.59 68.02 0.28 19.80 0 0
4 99 1.12 9.41 20.59 6.15 62.35 0 0
5 408 1.26 7.77 37.00 2.99 37.75 4.44 9.57
6 617 1.38 6.63 31.40 3.31 39.25 5.96 12.94
7 779 1.48 5.88 27.71 3.51 40.24 6.97 15.16
8 1038 1.63 4.87 22.71 3.80 41.57 8.33 18.16
9 1167 1.71 4.43 20.56 3.92 42.15 8.92 19.46
10 1416 1.86 3.69 16.19 4.12 43.12 9.92 21.65
(HU) of the CT according to the method described by Schneider et al.20 It has to be noted
that the tissue parameters are based on human tissues, since very limited data on small animal tissue compositions is available. These continuous tissue parameters are directly used in the calculation of the TERMA and the primary dose through analytical
approximations of the absorption coefficients.18,19
The scatter dose, on the other hand, is calculated for a set of 10 materials. For each voxel, we determine the base material closest to the voxel material, and use the appropriate kernel in the convolution. The 10 base materials are given in table II. They do not correspond to common tissues, but are chosen heuristically based on the absorption coefficients, as follows: The material-dependent part of the absorption coefficient for the photo-electric effect has an approximately exponential relationship to that of the Compton scattering. In order to limit the variation in both absorption coefficients within each material segment and thus limit the dose calculation error, we therefore use an exponential segmentation
M(𝐹1) = ⌊𝑒𝛼∙𝐹1⌋, (6)
where α = 2.5cm3g-1. Each material is assigned to a material segment M ∈ {1, 2, . . . , 10}
based on the material dependent part of μC:
𝐹1= ∑ 𝑁𝐴 𝑤𝑖 𝑍𝑖 𝐴𝑖 𝜌 𝑖
, (7)
with the Avogadro constant NA, the elemental weights wi, the atomic number and mass Zi
and Ai, and the mass density ρ.
PROOFS
BJR
UNCORRECTED
3. KernelsWe generated the scatter dose deposition kernels with the Monte Carlo engine
Geant421,22 version 10.01p01, using the PENELOPE electro-magnetic physics list. For all
60 energy and material combinations, 5 · 108 to 109 particle histories were simulated in
homogeneous cubes with mono-energetic photon beams. A biasing region of ⅛ of the
voxel size was defined at the centre of the cube, and a mono-energetic, uni-directional photon point source was placed on the border of this region. All primary photons were
forced to interact within this biasing region. The dose was scored into a cube with 2513
cubic voxels with a size of (0.275μm)3. Energy deposited by secondary electrons
originating from the first interaction was not scored, as this is accounted for in the primary dose.
The geometry of the pre-clinical irradiators, combined with the small treatment fields used in small animal radiotherapy, leads to small beam divergences. For the
SARRP system, the maximal beam divergence of a 1cm2 field is 1.15°. In addition, the
angular dependence of the Compton scattering cross section leads to almost isotropic scatter kernels. We therefore neglect the beam divergence within a single beam. An
exploratory analysis showed that even with kernels tilted by 45° against the beam
direction, the errors in the dose distribution are small. For example, for a 5mm × 5mm
irradiation field in water, a rotation of the kernels by 45° led to local deviations below
0.5% in both the depth dose curve and the lateral profile. Therefore, we do not rotate the kernels to the beam direction. Instead, we determine the main axis closest to the
beam direction and flip the kernel by 0°, 90°, 180° or 270° accordingly. The TERMA for
all beams within a quadrant is summed, and the scatter dose calculated once for each
quadrant. This reduces the number of convolutions from Nbeam × 60 to a maximum of 4 ×
60. This enables the calculation of complex dose deliveries such as many-beam treatments or deliveries with a variable collimator, and we do not foresee any issues with the implementation of conformal arcs in the future.
4. Implementation
In order to evaluate the performance of the algorithm, we developed a basic stand-alone TPS, which calculates the dose for a given CT and treatment plan as illustrated in figure 1.
In a first step, the CT Hounsfield Units (HU) are converted to material properties (see II A 2). The TERMA is pre-calculated for all beams and energy contributions using a
Siddon raytracer,23 which calculates the photon attenuation in depth by raytracing from
a point source to a grid of target points behind the CT volume.24 The actual dose
calculation is then split into primary and scattered dose as described above.
Currently, the dose engine is adapted to the geometry of the SARRP. In our current implementation we only account for the primary radiation emerging from the focal spot of the radiation source but neglect scatter or leakage radiation from the collimator,
similar to the approach described by Granton et al.25 The 3mm focal spot is
approximated by a 2D Gaussian distribution.
The cross-platform compatible implementation of the dose calculation method runs on a multi-core CPU environment. All modules of the software have been implemented for modern parallel processors. The convolutions of TERMA and kernel for all energy and material combinations are calculated in Fourier space, and implemented using the
fast Fourier transformations of the Intel mkl library.26 To prevent cross correlations due
to circular convolution of non-periodic signals in Fourier space the input is typically zero-padded by the size of the kernel. However, this increases the size of the convolution problem and hence the calculation time significantly. The sharp fall-off of the kV dose kernels limits the aliasing errors on the dose distribution. We therefore reduced the zero-padding to half the size of the kernels.
PROOFS
BJR
UNCORRECTED
FIG. 1: Workflow of the developed dose calculation algorithm.
B. Monte Carlo reference dose
Monte Carlo simulations are generally accepted as the gold standard in terms of accurate dose calculation. We therefore compared our dose engine with Monte Carlo simulations to validate the calculation accuracy. As for the kernel calculation (c.f. IIA3),
we used the Geant4 toolkit v10.01p01,21,22 with the PENELOPE electro-magnetic physics
description. The same simplified geometry of the SARRP system used in the superposition-convolution dose engine is implemented. The photon energy is sampled from the spectrum, without the discretisation needed in the presented dose engine. The same beam parameters are used as input for the simulation and our kernel-based dose calculation, and the conversion method of HUs to material properties are identical.
C. Muriplan
In addition to MC simulations, we compared our dose engine to Muriplan 2.0.1 (XStrahl Ltd., Camberley, UK), the treatment planning system supplied with the SARRP. Muriplan was developed at Johns Hopkins University, Baltimore. It uses a superposition-convolution dose engine implemented on a GPU, based on their MV dose calculation
algorithm.11-13 The entire small animal treatment is controlled from its 3DSlicer27-based
user interface.28 The acquired CBCT is transformed into material properties by defining
5 discrete windows for the materials air, lung, fat, tissue and bone. For phantom
PROOFS
BJR
UNCORRECTED
experiments, presets for air, cork, water, graphite and aluminium are available. The dose engine uses look-up tables for the absorption coefficients of these materials, according
to the NIST database.29 The tissue density and tissue composition are taken from the
ICRU Report 44.30,31 The energy dependence is integrated into the TERMA calculations,
using 21 energy bins.11 During the installation of the SARRP system on site, Muriplan is
commissioned using measurement data. To the best of our knowledge no detailed information on the performance of Muriplan or the dose engine has been published.
D. Validation
We validated our developed dose calculation software by comparison to Geant4 Monte Carlo simulations (c.f. II B) and compared it to the commercial treatment planning system Muriplan (c.f. II C). We evaluated the dose distributions in a virtual homogeneous water phantom, virtual slab phantoms of soft tissue with bone and lung
inserts, as well as those calculated on a mouse CBCT. The voxel size was (0.275mm)3,
the standard voxel size at the SARRP. The dose is reported as dose to medium in all cases.
First, we demonstrate the performance of the new dose engine in a (7.04cm)3
homogeneous water phantom for three different square treatment fields of (1mm)2,
(5mm)2, and (10mm)2. In order to evaluate the performance in inhomogeneous
materials, we inserted a 2mm bone slab or a 5mm lung slab into a soft tissue phantom,
positioning the top of the slab at a depth of 5mm. In both cases, we used a (5mm)2
square treatment beam.
For our dose comparison we created virtual CT cubes with (256)3 voxels. The
HU-tissue association as described by Schneider et al.20 resulted in HUwater=0, HUsofttissue=43,
HUlung=−741 or HUbone=1542 for the ICRU-44 materials used in Muriplan. The same CTs
were imported into Muriplan, and the materials assigned accordingly. In the MC simulations, we created the virtual phantom directly in Geant4 from the material compositions.
Finally, we calculated the dose distributions on a mouse CBCT acquired at the SARRP. It has to be noted that the output of the on-board CBCT of the SARRP are not Hounsfield units but arbitrary units, as the system is not calibrated for absolute attenuation coefficients. Therefore, the uncalibrated CT numbers of the mouse CBCT were converted to HUs prior to the dose calculation using piece-wise linear interpolations between the 5 materials used in Muriplan. The converted CT was used in the new dose engine as well as in the MC simulations. In Muriplan the standard 5 material workflow was used. We defined an artificial target in the mouse brain, and planned a 5-field irradiation with
equidistant beams of 3mm × 3mm at 0°, 72°, 144°, 216° and 288°.
The runtime of our dose calculation method was measured on a shared memory system configured with two Intel Xeon E5-2697v3 CPUs.
III. RESULTS
A. Dose distributions
1. Phantoms
The dose distributions in water calculated with our kernel-based algorithm, Muriplan, and MC simulations are compared in figure 2. For three different treatment
field sizes ((1mm)2, (5mm)2, and (10mm)2), the depth dose curves as well as the lateral
profiles at a depth of 6mm are shown. Both our kernel-based algorithm and the MC simulations have not yet been calibrated in terms of machine output and therefore no
PROOFS
BJR
UNCORRECTED
FIG. 2: Comparison of the analytical dose engine with Muriplan and MC simulations in water. Depth dose curves (left column) and lateral profiles at a depth of 6mm (right
column) are shown for three different field sizes ((1mm)2 top row, (5mm)2 middle row,
and (10mm)2 bottom row). The depth dose curves are normalized to the value at 2cm
depth. The local percentage differences were smoothed with a 3-median filter to reduce the visual impact of MC noise.
D o s e [ a .u .] 0.4 0.6 0.8 1 1.2 1.4 1.6 1.8 2 MC simulation Muriplan New dose engine
depth [mm]
0 10 20 30 40 50 60 70
D o s e d if fe re n c e [ % ] -30 -20 -10 0 10 20 lo g (D o s e ) [a .u .] -8 -6 -4 -2 0 MC simulation Muriplan New dose engine
lateral extension [mm]
-30 -20 -10 0 10 20 30
D o s e d if fe re n c e [ % ] -75 0 75 D o s e [ a .u .] 0.4 0.6 0.8 1 1.2 1.4
1.6 MC simulation
Muriplan New dose engine
depth [mm]
0 10 20 30 40 50 60 70
D o s e d if fe re n c e [ % ] -5 0 5 lo g (D o s e ) [a .u .] -6 -5 -4 -3 -2 -1 0
1 MC simulation
Muriplan New dose engine
lateral extension [mm]
-30 -20 -10 0 10 20 30
D o s e d if fe re n c e [ % ] -30 0 30 D o s e [ a .u .] 0.4 0.6 0.8 1 1.2 1.4
1.6 MC simulation
Muriplan New dose engine
depth [mm]
0 10 20 30 40 50 60 70
D o s e d if fe re n c e [ % ] -5 0 5 lo g (D o s e ) [a .u .] -5 -4 -3 -2 -1 0
1 MC simulation
Muriplan New dose engine
lateral extension [mm]
-30 -20 -10 0 10 20 30
PROOFS
BJR
UNCORRECTED
FIG. 3: Comparison of the depth dose curves of (5mm)2 fields, normalized to the value at
2cm depth, calculated with the analytical dose engine, Muriplan, and MC simulations in slab phantoms of soft tissue with bone (left) and lung (right) inserts. The local percentage differences, smoothed with a 3-median filter, are shown in the bottom row.
direct correlation between delivery times and absolute dose is possible. Therefore, the depth dose curves are normalised to the point at 2cm depth, as this is the standard reference point in kV dosimetry protocols. The lateral profiles are normalized to the integral of the depth dose curve.
For our dose engine (shown in red), the mean agreement of the calculated depth dose curves with the simulations is 1.7% for all collimator sizes in water. Larger deviations of up to 4% are observed in the first voxel, i.e. in a 0.275mm deep entrance region. In addition, the deviation between the new analytical algorithm and MC simulations increases with depth, but does not exceed 5%. The lateral beam profiles were evaluated at different depths (a depth of 6mm was chosen for demonstration purposes in figure 2). Within the beam, the simulations and our superposition-convolution algorithm show a mean agreement of 3% for all beams, apart from the beam edge. The out-of-field doses, which are defined by values smaller than 10% of the maximum dose, agree within 12%
(mean) for the (5mm)2 and (10mm)2 beams, up to a distance of 34mm, which
corresponds to the size of the kernel. For the smallest treatment field, the mean agreement is 22%.
The depth dose curves calculated with Muriplan (shown in green) agree with the
simulations within 3% (mean) for the (5mm)2 and (10mm)2 beams, and 12% (mean) for
the smallest field. The dose fall-off is consistently steeper in Muriplan compared to the MC simulations, and this effect is most pronounced for the smallest beam size. In the lateral profiles, the mean agreement is 3% within the beam and 20% (mean) in the
out-of-field regions for all but the smallest fields. For the (1 mm)2 field, the in-beam region
agrees within 11%, and the out-of-field doses to 43% (mean). It has to be noted, however, that a different head model is used in the MC simulations and Muriplan, which probably accounts for the large differences in the smallest field size.
Figure 3 depicts the depth dose curves in slab phantoms of water with either 2mm of bone or 5mm of lung inserted at a depth of 5mm. For the new dose engine, the mean agreement in the bone case is 1.5%, with the largest deviations up to 7% at the boundary of the bone slab.
In Muriplan, the dose in the bone insert is overestimated by up to 43% compared to the MC simulations. For the lung phantom, simulations and the Muriplan results agree within 3% (mean), while our analytical calculations underestimate the dose in lung by 9%. However, if the same CT and material conversion as in the analytical dose
D o s e [ a .u .] 1 2 3 4 5 6 7 8 MC simulation Muriplan New dose engine
depth [mm]
0 10 20 30 40 50 60 70
D o s e d if fe re n c e [ % ] -10 0 10 20 30 40 D o s e [ a .u .] 0.4 0.6 0.8 1 1.2 1.4
1.6 MC simulation, ICRU materials
MC simulation, Schneider conversion Muriplan
New dose engine
depth [mm]
0 10 20 30 40 50 60 70
PROOFS
BJR
UNCORRECTED
FIG. 4: Dose distributions from a five (3mm)2 field irradiation calculated on a mouse
CBCT using the new dose engine (a), MC simulations (b) and Muriplan (c). The absolute dose differences are shown in the bottom row.
calculation are used in the MC simulation (Schneider conversion, shown in pink), our new dose engine and simulations agree within 2% (mean). The same tendencies regarding the build-up region, larger depths and the slope of the depth dose curves as in the water phantoms are observed in the slab phantoms.
2. Mouse CBCT
The dose distributions from a five-field irradiation of a mouse brain, obtained with our kernel-based dose engine, MC simulations, and Muriplan are shown in figure 4(a), 4(b), and 4(c), respectively. They are normalized to the dose at the centre of the target. The MC simulations were calculated to a statistical uncertainty of 0.5% in the target region. In the bottom row of figure 4, the dose difference maps between the simulated dose distribution and our dose engine (fig. 4(d)) and Muriplan (fig. 4(e)) are shown. In both cases, the largest differences can be observed in bone and at the beam edges. Muriplan overestimates the dose in bone by 53% (mean), while our dose engine shows an underdoseage of 14% (mean).
B. Calculation times
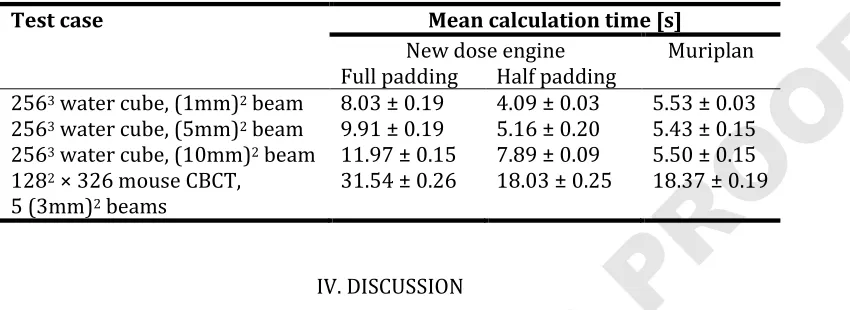
The calculation times depend on the size of the CT and the number of treatment beams. In our implementation the calculation time does not change significantly from 4 beams onwards, since we perform the scatter dose calculation for four quadrants instead of each beam. As described in section II A 4, we reduced the zero-padding of the scatter dose kernels to reduce the runtime. We found that this influences the results by
less than 10-4%, while saving roughly 40% of the calculation time. The calculation times
of the single-beam plans on the cubic water CT with (256)3 voxels and the five-beam
plan on the mouse CT are given in table III.
PROOFS
BJR
UNCORRECTED
TABLE III: Calculation times for different CT and beam configurations for our dose engine (using loss-less full padding and the reduced padding approximation) and
Muriplan.
Test case Mean calculation time [s]
New dose engine Muriplan
Full padding Half padding
2563 water cube, (1mm)2 beam 8.03 ± 0.19 4.09 ± 0.03 5.53 ± 0.03
2563 water cube, (5mm)2 beam 9.91 ± 0.19 5.16 ± 0.20 5.43 ± 0.15
2563 water cube, (10mm)2 beam 11.97 ± 0.15 7.89 ± 0.09 5.50 ± 0.15
1282 × 326 mouse CBCT,
5 (3mm)2 beams
31.54 ± 0.26 18.03 ± 0.25 18.37 ± 0.19
IV. DISCUSSION
In this study, we presented a superposition-convolution-based dose engine for small animal radiotherapy. Due to the fact that pre-clinical irradiators operate in the kV energy regime instead of MV, the increased importance of the photo-electric effect and the resulting increased material and energy dependencies have to be taken into
account32. We split the calculation into energy deposited by the primary interaction and
all subsequent scattering events. The primary dose is calculated analytically based on statistical considerations. The scatter dose is calculated as a convolution of TERMA with the appropriate MC-generated kernel from a set of 60 energy and material combinations.
We implemented the algorithm into a basic stand-alone TPS. The cross-platform compatible software is optimised for modern multi-core CPU systems. It has been adapted to the geometry and energy spectrum of the SARRP system, but can be adapted to any pre-clinical irradiator.
In comparisons with MC simulations, the depth dose curves in water show a mean disagreement of 1.7% (c.f. figure 2). A larger deviation of up to 4% is observed in the first voxel. This behaviour is expected, since the kernel-based approach does not correctly model the build-up effect, and overestimates the dose in the entrance region. For the energies used in pre-clinical research, the electron ranges and hence the build-up region are of the same order of magnitude as the voxel size.
One factor causing the increasing deviation in depth is our energy sampling approach. As discussed in section II A 2, the TERMA and hence the attenuation in depth is calculated separately for each of the 6 energy contributions. Beam hardening is therefore implicitly accounted for. However, we only regard 6 discrete energy values, and a careful analysis of the chosen sampling points could further improve the calculations. In the lateral profiles, large deviations at the field edge can be observed. This is a discretisation effect of the raytracing through a voxelised geometry. The out-of-field dose values agree within 12% for all but the smallest beam. Improving the dose calculation accuracy at the beam edges is expected to also increase accuracy distant from the beam. This issue will be addressed in future work.
The dose distributions in water calculated with Muriplan show systematic differences to our MC simulations. It has to be noted that, in contrast to the MC simulations and our dose engine, Muriplan has been commissioned to measurements. The differences in slope of the depth dose curves are most pronounced for the 1mm field. We assume this is due to differences in the head model. For the smallest beam
sizes, the focal spot distribution becomes important33. This highlights the importance of
PROOFS
BJR
UNCORRECTED
a thorough validation of the treatment dose calculation by comparison to measurements, especially for the smallest beam sizes. Future work includes the commissioning of our dose engine and an adaption of the head model where necessary.
In the slab phantoms, larger deviations between our dose calculation and MC simulations are observed at tissue interfaces (c.f. figure 3). This is an inherent issue of kernel-based approaches. Our approach of choosing the appropriate kernel for each voxel based on the voxel material assumes local homogeneity. Kernel stretching is not straightforwardly adapted from MV dose calculations to the kV energy regime, due to the increased importance of the photo-electric effect. This results in a smearing of the scatter dose at sharp tissue boundaries. The primary dose is not affected since there is no material approximation in its calculation.
In addition, discrepancies are observed within the tissue slabs. In bone, Muriplan overestimates the dose by up to 43%, while our dose engine underestimates dose to lung by up to 9%. In these cases, we used the ICRU material definitions of the Muriplan base materials in the MC simulations. Our dose engine, however, transforms HUs to
material parameters according to Schneider et al.20 If the same CT and material
conversion as in the analytical dose calculation are used in the MC simulation, the mean disagreement in lung reduces to 2%. The overestimation in bone observed with Muriplan however cannot be explained by the tissue segmentation. In Muriplan, the kernels are calculated in water and the dose-to-water is converted to dose-to-medium
using the ratio of mass energy absorption coefficients in water and tissue.34 While this
approach is suitable in MV dose calculations, it introduces errors in the kV energy regime which will be resolved in the future using correction factors for
dose-to-medium.34
The same tendencies as in the water and slab phantoms can be observed in the 5-field irradiation of a mouse brain (c.f. figure 4). Discrepancies between MC and analytically calculated dose distributions are largest within bone, at the beam edges and tissue-bone interfaces.
The deviations introduced by the material segmentation are not surprising. Bazalova
et al.32 suggest that 29 materials are needed to calculate the dose to within 2 % for
225kV photon beams on noisy CT images. A 4-tissue segmentation similar to the one
used in Muriplan lead to dose differences of 57% in the ribs32, which, in combination
with the discrepancies in the bone slab described above, corresponds well to the overestimation of dose in bone we observe in the skull for Muriplan. Using 8 tissues in
the segmentation leads to errors in the order of 7%.32 We currently use 10 base
materials for the scatter dose kernels as a compromise between calculation time and accuracy. However, this segmentation does not affect the primary dose calculation where we calculate the absorption coefficients for each voxel based on the local material parameters (c.f. A II 2). This reduces the influence of the material segmentation on the dose distributions, but requires accurate material definitions. The discrepancies between the doses in lung calculated with different material definitions suggest that improvements in the HU to material conversion are required. This will be addressed in future work.
We follow the current practice by assigning human tissue parameters to mouse
tissues, which will lead to further inaccuracies in small animal treatments.32 Only very
limited data on mouse tissue composition is currently available. Once more data on mouse tissues is available, further analysis of the number and choice of materials for the pre-calculated kernels and the HU to material conversion will be necessary.
Our dose engine is implemented on a multi-core CPU environment and has been
optimized for calculation speed. Calculation times for a (5mm)2 field single-beam plan in
the water phantom are 5.2s, and 18s for a five-beam irradiation on a mouse CBCT. The dose calculation in Muriplan for the same treatment plans required 5.4s and 18s respectively. Halving the size of the zero-padding has significantly reduced the calculation times without reducing calculation accuracy. Based on these results we will
PROOFS
BJR
UNCORRECTED
implement a smart padding, which chooses the smallest possible zero-padding without compromising the accuracy based on the CT and beam plan, to reduce the calculation times further.
Kernel-based approaches generally come with a loss of accuracy compared to full MC simulations, but offer faster computation times. The commercial treatment planning system SmARTplan (SmART scientific solutions B.V., Maastricht, NL) employs a MC dose engine. Dose calculation times of 243s have been reported for an irradiation of the left
kidney of a rat with four (1cm)2 beams.17 In addition, MC dose calculations are generally
performed for a specific statistical uncertainty in the target region. While this avoids an increase in computation times with the number of treatment beams, it results in a loss of statistics in low dose regions. Our dose engine is a fast alternative to general full MC simulations with an acceptable accuracy, and it is promising for the use in an inverse treatment planning environment.
V. CONCLUSIONS
We have presented a dose calculation engine for small animal radiotherapy, which is based on a superposition-convolution approach adapted to kV photon beams. Good agreement of the calculated dose distributions with Monte Carlo simulations could be shown in water, in slab phantoms and for a mouse CBCT. Runtimes are in the order of 5s for a single beam. Future work will focus on the energy and material sampling points, as well as improvements to the head model and the adaptation of input parameters of our dose algorithm to the treatment device. We believe the presented dose calculation algorithm will be valuable in inverse treatment plan optimization, which we identify as one of the main steps to further advance high-precision small animal radiotherapy.
PROOFS
BJR
UNCORRECTED
1 Butterworth KT, Prise KM, Verhaegen F. Small animal image-guided radiotherapy:
status, considera- tions and potential for translational impact. The British Journal of Radiology. 2015;88(1045):20140634.
2 Wong J, Armour E, Kazanzides P, Iordachita I, Tryggestad E, Deng H, et al.
High-resolution, small animal radiation research platform with x-ray tomographic
guidance capabilities. International journal of radiation oncology, biology, physics.
2008 Aug;71(5):1591–9.
3 Zhou H, Ph D, Rodriguez M, Haak FVD, Nelson G, Xu J, et al. Development of a
MicroCT-Based Image-Guided Conformal Radiotherapy System for Small Animals. Int J
Radiat Oncol Biol Phys. 2010;78(1):297–305.
4 Clarkson R, Lindsay PE, Ansell S, Wilson G, Jelveh S, Hill RP, et al. Characterization of
image quality and image-guidance performance of a preclinical microirradiator.
Medical Physics. 2011;38(2):845.
5 Stojadinovic S, Low Da, Hope aJ, Vicic M, Deasy JO, Cui J, et al. MicroRTSmall animal
conformal irradiator. Medical Physics. 2007;34(12):4706.
6 Tillner F, Thute P, L ̈ock S, Dietrich A, Fursov A, Haase R, et al. Precise image-guided
irradiation of small animals: a flexible non-profit platform. Physics in Medicine
and Biology. 2016;61(8):3084–3108.
7 Verhaegen F, Granton P, Tryggestad E. Small animal radiotherapy research platforms.
Physics in Medicine and Biology. 2011 Jun;56(12):R55–83.
8 Bazalova M, Nelson G, Noll JM, Graves EE. Modality comparison for small animal
radiotherapy: a simulation study. Medical physics. 2014 Jan;41(1):011710.
9 Verhaegen F, van Hoof S, Granton PV, Trani D. A review of treatment planning for
precision image- guided photon beam pre-clinical animal radiation studies.
Zeitschrift fur medizinische Physik. 2014 Mar;.
10Marco-Rius I, Wack L, Tsiamas P, Tryggestad E, Berbeco R, Hesser J, et al. A fast
analytic dose calculation method for arc treatments for kilovoltage small animal
irradiators. Physica medica. 2013 Sep;29(5):426–35.
11Jacques R, Smith D, Tryggestad E, Wong J. GPU accelerated real time kV/MV dose
computation. Proc ICCR 2010. 2010;p. 2–5.
12Jacques R, Taylor R, Wong J, McNutt T. Towards real-time radiation therapy: GPU
accelerated super- position/convolution. Computer methods and programs in
biomedicine. 2010 jun;98(3):285–92.
13Jacques R, Wong J, Taylor R, McNutt T. Real-time dose computation: GPU-accelerated
source modeling and superposition/convolution. Medical physics.
2011;38(1):294–305.
14Chow JCL, Leung MKK. Treatment planning for a small animal using Monte Carlo
simulation. Medical Physics. 2007;34(12):4810.
15Graves EE, Zhou H, Chatterjee R, Keall PJ, Gambhir SS, Contag CH, et al. Design and
evaluation of a variable aperture collimator for conformal radiotherapy of small
animals using a microCT scanner. Medical Physics. 2007;34(11):4359.
16van Hoof SJ, Granton PV, Verhaegen F. Development and validation of a treatment
planning system for small animal radiotherapy: SmART-Plan. Radiotherapy and
oncology : journal of the European Society for Therapeutic Radiology and
Oncology. 2013 Dec;109(3):361–6.
17Balvert M, van Hoof SJ, Granton PV, Trani D, den Hertog D, Hoffmann AL, et al. A
framework for inverse planning of beam-on times for 3D small animal
radiotherapy using interactive multi-objective optimisation. Physics in Medicine
and Biology. 2015;60(14):5681–5698.
18Bartzsch S. Microbeam Radiation Therapy physical and biological aspects of a new
cancer therapy and development of a treatment planning system. PhD Thesis,
University of Heidelberg, Germany; 2014.
19Bartzsch S, Oelfke U. A new concept of pencil beam dose calculation for 40-200 keV
photons using analytical dose kernels. Medical Physics. 2013 Nov;40(11):111714.
PROOFS
BJR
UNCORRECTED
20Schneider W, Bortfeld T, Schlegel W. Correlation between CT numbers and tissue
parameters needed for Monte Carlo simulations of clinical dose distributions.
Physics in Medicine and Biology. 2000;45(2):459.
21Agostinelli S, Allison J, Amako K, Apostolakis J, Araujo H, Arce P, et al. Geant4a
simulation toolkit. Nuclear Instruments and Methods in Physics Research Section A:
Accelerators, Spectrometers, Detectors and Associated Equipment.
2003;506(3):250 – 303.
22Allison J, Amako K, Apostolakis J, Araujo H, Dubois P, Asai M, et al. Geant4
developments and applications. IEEE Transactions on Nuclear Science.
2006;53:270–278.
23Siddon RL. Fast calculation of the exact radiological path for a three-dimensional CT
array. Medical Physics. 1985;12(2):252.
24Siggel M, Ziegenhein P, Nill S, Oelfke U. Boosting runtime-performance of photon
pencil beam algorithms for radiotherapy treatment planning. Physica Medica. 2012;28(4):273–280.
25Granton PV, Verhaegen F. On the use of an analytic source model for dose calculations
in precision image-guided small animal radiotherapy. Physics in Medicine and Biology. 2013 May;58(10):3377–95.
26Https://software.intel.com/en-us/intel-mkl.
27Fedorov A, Beichel R, Kalpathy-Cramer J, Finet J, Fillion-Robin JC, Pujol S, et al. 3D
Slicer as an Image Computing Platform for the Quantitative Imaging Network.
Magnetic Resonance Imaging. 2012 11;30(9):1323–41.
28Cho NB, Kazanzides P. A Treatment Planning System for the Small Animal Radiation
Research Platform ( SARRP ) based on 3D Slicer. MIDAS Journal. 2012;p. 1–8.
Available from: http://hdl.handle.net/ 10380/3364.
29Http://physics.nist.gov/PhysRefData/XrayMassCoef/cover.html.
30ICRU. ICRU Report 44 1989 Tissue Substitutes in Radiation Dosimetry and
Measurement. 1989;.
31Personal communication with XStrahl. T. Kanesalingam. 15.08.2016.
32Bazalova M, Graves EE. The importance of tissue segmentation for dose calculations
for kilovoltage radiation therapy. Medical Physics. 2011;38(6):3039.
33Tryggestad E, Armour M, Iordachita I, Verhaegen F, Wong JW. A comprehensive
system for dosimetric commissioning and Monte Carlo validation for the small
animal radiation research platform. Physics in Medicine and Biology. 2009 Sep;54(17):5341–57.
34Personal communication with XStrahl. T. Kanesalingam. 11.10.2016.
PROOFS
BJR
UNCORRECTED
List of figure legends:
FIG. 1: Workflow of the developed dose calculation algorithm.
FIG. 2: Comparison of the analytical dose engine with Muriplan and MC simulations in water. Depth dose curves (left column) and lateral profiles at a depth of 6mm (right
column) are shown for three different field sizes ((1mm)2 top row, (5mm)2 middle row,
and (10mm)2 bottom row). The depth dose curves are normalized to the value at 2cm
depth. The local percentage differences were smoothed with a 3-median filter to reduce the visual impact of MC noise.
FIG. 3: Comparison of the depth dose curves of (5mm)2 fields, normalized to the value at
2cm depth, calculated with the analytical dose engine, Muriplan, and MC simulations in slab phantoms of soft tissue with bone (left) and lung (right) inserts. The local
percentage differences, smoothed with a 3-median filter, are shown in the bottom row.
FIG. 4: Dose distributions from a five (3mm)2 field irradiation calculated on a mouse
CBCT using the new dose engine (a), MC simulations (b) and Muriplan (c). The absolute dose differences are shown in the bottom row.