http://www.sciencepublishinggroup.com/j/ijema doi: 10.11648/j.ijema.20180603.13
ISSN: 2328-7659 (Print); ISSN: 2328-7667 (Online)
Equilibrium, Kinetic and Adsorption Mechanisms of
Chromium (VI) on Characterized Activated Carbon
Synthesized from Phosphoric Acid Activation of Coconut
Shells
Hakeem Seidu, Dapeng Li, Jing Zhou
School of Environmental Science and Engineering, Suzhou University of Science & Technology, Suzhou, China
Email address:
To cite this article:
Hakeem Seidu, Dapeng Li, Jing Zhou. Equilibrium, Kinetic and Adsorption Mechanisms of Chromium (VI) on Characterized Activated Carbon Synthesized from Phosphoric Acid Activation of Coconut Shells. International Journal of Environmental Monitoring and Analysis. Vol. 6, No. 3, 2018, pp. 84-94. doi: 10.11648/j.ijema.20180603.13
Received: May 15, 2018; Accepted: June 6, 2018; Published: July 25, 2018
Abstract:
Over the years, water pollution due primarily to the discharge of toxic heavy metals from industrial activities has served as a major challenge in our quest to provide clean drinking water to millions of people across the world. Numerous cheap and environmentally friendly methods and technologies have been developed for the treatment of wastewater contaminated with heavy metals. Key among these technologies is the use of adsorbent as it is the most economical and efficient. In this present study, coconut shells were used to develop microporous adsorbent (activated carbon) through chemical activation by phosphoric acid (H3PO4). An analysis of the effect of various process parameters such as pH, temperature, initialmetal ion concentration, adsorbent dose and contact time was conducted through batch adsorption of hexavalent chromium [Cr (VI)] on prepared AC sample. Initial Cr (VI) concentration was investigated through a range of 10 – 50 mg/L with the study showing an optimum concentration for AC of 20 mg/L for percentage removal (93.3%) but adsorption capacity (Qe) was
highest for 50 mg/L (4.512 mg/g). The optimum conditions for adsorbent dose, contact time and temperature were determined as 6 g/L, 100 minutes and 30°C respectively for the prepared AC. Maximum adsorption was recorded for pH (2) at 88.2 5% (removal) and 4.41 mg/g (adsorption capacity) for AC. The experimental data obtained were modelled using various isotherms, including adsorption equilibrium isotherms, adsorption kinetic study and adsorption mechanisms with positive correlations (better fit) obtained for Freundlich isotherm, D-R isotherm (slightly), pseudo-second-order kinetic and Boyd models.
Keywords:
Activated Carbon, Adsorption, Adsorption Capacity, Percentage Adsorption, Isotherms, Equilibrium, Kinetic, Models1. Introduction
The presence of hazardous heavy metals and metalloids, especially in aqueous media is an important environmental and social problem. The extent of toxicity caused by these elements is of considerable concern worldwide because of their environmental and health burden [1]. Heavy metal toxicity can cause damage or reduce mental and central nervous functions, energy levels, blood composition and other relevant vital organs. Exposure in the long term may result in the adverse effect to physical, muscular, and neurological degenerative processes. It also has the
potential to cause Parkinson's disease, multiple sclerosis and muscular dystrophy. Some heavy metals or their compounds may even cause cancer [2]. Adverse alteration of water quality presently produces large-scale illness and deaths, accounting for approximately 50 million deaths per year worldwide, most of these deaths occurring in Africa and Asia. As, ultimately, heavy metal regulations for drinking water and wastewater become stricter, the conventional means of water treatment becomes either costly or inefficient [3].
In this regard, methods like ion-exchange, membrane filtration, microbe-assisted phyto-bioremediation and nanomaterials have been developed and demonstrated to be successful, though at high capital and operational costs. One technology that has proven to overcome such disadvantages is the adsorptive removal of metal ions by various adsorbents. Activated carbons (AC) are very effective adsorbents due to their high surface area and pore volume [4]. It has been shown that lignocellulosic agricultural wastes, particularly nutshells are very good precursors for the production of AC to remove heavy metal ions from aqueous solutions. Huge amounts of coconut shells are generated as agricultural wastes in Ghana, which when analyzed show significant lignin (macropores yielding) and cellulose (micropores yielding) dominance. Regardless of these vast quantities of such resources, a significant amount of AC used in the country for both industrial and wastewater treatment is imported from Japan and Germany. The utilization of these low-cost agricultural wastes as carbon precursor is very promising, but their use as metal ion scavenger is rare [3]. These, therefore present an opportunity to both eliminate such waste in the environment and also control increasing heavy metal contamination in our waterbodies. The purpose of this study is to evaluate the suitability of prepared acid-impregnated activated carbon derived from locally sourced coconut shell waste as an adsorbent in the removal of heavy metal ions and evaluate the various mechanisms (equilibrium, kinetic and adsorption) that control the adsorption process whilst also determining the effect of various process parameters such as pH, adsorbent dose, initial metal ion concentration, contact time and temperature on the removal efficiency of the prepared AC.
2. Experimental
2.1. Materials
The carbonaceous raw material used for the preparation of the AC sample is coconut shells sourced from Ghana. Washed and cleaned shells were sundried for 2 weeks to facilitate easy crushing and grinding. The dried shells were sieved (1.0-1.5 mm). All chemical reagents were of analytical grade.
2.2. Synthesis of Activated Carbon
The cleaned and grind precursor was dried at 110°C for 24 hrs. It was subsequently impregnated with an appropriate amount of 30% H3PO4 for 12 hrs in a hot air oven to achieve
adequate penetration into the interior precursor. A specified amount of was then transferred into a 150 mm × 40 mm stainless steel reactor and placed inside an electric horizontal tubular furnace controlled by a PID controller. The temperature of the reaction zone was measured by the chromel-alumel thermocouple and pyrolysis carried out under a continuous flow of N2 gas (200 mL/min) to obtain
AC sample of carbonization temperature, 400°C. The carbonized sample is then cooled to room temperature under
an inert atmosphere and washed with water and dilute NaOH until the pH value is neutral. The AC obtained was labelled AC400. Figure 1A presents a schematic of the process description.
2.3. Characterization of AC Sample
N2 adsorption-desorption (A-D) isotherms on AC400 were
conducted in an automatic adsorption unit (ADU) at -195 °C liquid nitrogen temperature. The process involves an initial removal of adsorbed moisture and impurities on the surface through degassing at 200 °C for 5 hrs. ST value was
determined experimental through adsorption isotherm over relative pressure by the standard BET method. The VT of the sample were determined as the total volume of N2 gas
adsorbed at high relative pressure (0.995) [5]. The Smi and Vmi were determined by applying D-R equation [6].
Surface functional groups of the AC sample were determined by infrared (FTIR) spectroscopy analysis using spectra range of 4000 – 400 cm-1. The surface morphology of the AC sample was analyzed by a SEM and the extent of graphitization determined by x-ray diffractometer (XRD).
2.4. Adsorption of Cr (VI) Ions
A stock solution of Cr (VI) was prepared by mixing a known amount of K2Cr2O7 in distilled water and stirring to gain homogeneity and various concentrations of the eventual solution were obtained. Varying amounts of AC was mixed with each initial concentration of metal ions and agitated at 120 rpm for 180 minutes with varying temperatures (20 – 60°C) and pH (2 – 11) adjusted using a thermal shaker and pH meter. After each experiment, the spent AC were filtered out using Whatman filter paper and the concentration of the resulting solution was determined using UV Spectrophotometer at 540 nm by complexing Cr (VI) with C13H14N4O [7].
3. Results and Discussions
3.1. Characterization of AC
3.1.1. Gas Sorption Isotherm of AC400
The N2 A-D isotherm of the AC400 was carried out to
investigate the porous characteristics. The holding time of 1 hour at final carbonization temperature was maintained. Figure 1B depicts the isotherm of AC400 which presents well-developed porosity of sample. The N2 adsorption
capacity of the AC400 was determined as 501.5 cc/g.
3.1.2. FTIR Spectroscopy
to Silane groups was also observed. The presence of amine groups is confirmed by the peaks observed within the range of 1190–1130 cm-1 and are due to the C–N stretching. Also revealed were hydrocarbon groups observed at peaks corresponding to a range of 600–900. These hydrocarbon groups are revealed to be deformed, bend or ring puckering.
3.1.3. Morphology of AC
SEM micrographs of AC400 shows well-developed porous surfaces at higher magnification. The pores from SEM images were observed as having sizes in the micrometer (µm) range and are considered as channels to the microporous
network. It can also be observed that the adsorbent has a rough texture with heterogeneous surface and a variety of randomly distributed pore sizes as shown in Figure 1D.
3.1.4. XRD Analysis
The sample show general broad peaks and absence of sharp peak which reveal a predominantly amorphous structure, which is an advantageous property for well-defined porous adsorbents [8]. At 24°, the broad peaks observed (Figure 1E) illustrates the non-graphitized nature of AC400 which indicates high microporous structures [9] which was confirmed by the gas adsorption isotherms.
A: Process Flow Diagram for Preparing AC Sample
C: Graphical Representation of FTIR Results for AC sample (AC400)
D: Micrograph for AC400
E: Graphical Representation of XRD results for AC sample (AC400)
3.2. Effect of Process Parameters on Cr(VI) Adsorption
(1). Initial Cr (VI) Concentration
For AC400, the adsorption of chromium (VI) ions illustrates an initial rise in percentage removal from 93.3% for 10 mg/L of metal ion to 93.9% for 20 mg/L. However, there is a downward trend for 30 mg/L, 40 mg/L and 50 mg/L corresponding to 92.93, 91.68 and 90.24% respectively, as illustrated in Figure 2A, with certain experimental conditions held constant ((pH–2.0, time–180 minutes, temp.– 30°C, adsorbent dose–10 g/L).
The Plot for the rate of adsorption by AC400 (Figure 2B) clearly provides evidence to prove that the equilibrium time and adsorbate amount are dependent. The equilibrium time is also shown to exist between 80 to 180 minutes at increasing initial Cr (VI) concentration. From the experiment, it is highlighted that adsorption of the metal ions is instantaneous within the initial 20 minutes and proceeded to increase as time progressed.Invariably, it is postulated that more unoccupied sites within the adsorbent (AC400) surface accounted for the little difference in the final percentage adsorption observed from 10 – 50 gm/L. Therefore, the initial high adsorption recorded can be attributed to the increased concentration gradient of aqueous metal ions and the presence of numerous vacant sites on the surface of the adsorbent at the start of the experiment. As a result of the limited mass transfer of the metal ions from the liquid phase to the surface of the adsorbent, the adsorptive removal increased linearly with contact time, with equilibrium reached when mass transfer slows within the adsorbent particles [10].
(2). Effect of Adsorbent Dose (AD)
Varying doses of AC400 (1–10 g/L) were studied with the process parameters kept constant; initial Cr (VI) concentration–30 mg/L, and presented in Figure 2C. It can be observed that the maximum adsorption was achieved with 10 g/L of adsorbent at 92.93%. The percentage removal declined with decreasing adsorbent dose from 92.6% to 20.43 for 6 g/L to 1 g/L. For Qe, the results show a decline at a lower
adsorbent dose of 1 g/L 6.13 mg/g (1 g/L) to 5.06 mg/g (2 g/L) with a subsequently rise to 5.818 mg/g (4 g/L) and a decrease to 4.63mg/g (6 g/L) and 2.788 mg/g (10 g/L).
Figure 2D presents the rate of Cr (VI) adsorption on varying adsorbent doses. The adsorption was observed to exhibit a significant rise between 60–80 minutes during the experiment with increasing contact time. This however tapered off after 80 minutes to present an equilibrium adsorption point where no significant rise was observed, especially with regard to higher adsorbent dose (10, 6 and 4 g/L).
(3). Effect of pH
The pH of the solution is very important to the adsorption process [16] with various levels of pH (2.0 – 11.0) employed for this study. The other parameters were kept under constant conditions; temp. (30°C), contact time (180 minutes), initial Cr (VI) conc. (10 mg/L) and adsorbent dose (2 g/L). The dependence of Cr (VI) adsorption on pH can largely be related to the type and ionic state of the
functional groups present on the surface of adsorbent and as well as the metal chemistry in the solution. The trend in adsorption observed in Figure 2E show a higher percentage removal of Cr (VI) at acidic pH, specifically, 2.0 and 4.0, reaching 88.2% and 86.9% respectively. Subsequently, there was a significant decline at pH > 4 where percentage removal results obtained for pHs values of 6.5, 9 and 11 of 74.7%, 48.9% and 36.2 respectively with corresponding values of 4.335 mg/g, 4.215 mg/g and 3.615 mg/g.
At low pH, the adsorption is relatively high as a result of available Cr (VI) in different forms and also attributed to the surface groups within the surface of the adsorbent. Low pH (acidic) presents a situation where the predominant species of Cr (VI) are and but presents as the only stable species at neutral pH [11]. There is an equilibrium shift to dichromate when there is a decrease in the pH range of 2 – 4, according to the overall equilibrium as follows:
2 + 2 → +
Also, there is greater competition between and ions as the pH increases towards neutral with the former acting as the dominant species. This reduction in net positive surface potential causes a decline in the electrostatic forces between metal ion species and the adsorbent which results in a decreased adsorption capacity. The rate of removal at varying pH is illustrated in Figure 2F.
(4). Effect of Temperature
According to the results presented (Figures 2G & 2H), there is a steady rise in both adsorption percentage (%) and adsorption capacity (Qe) with temperature. The increase in percentage
adsorption of Cr (VI) by AC400 indicates an endothermic process. At higher temperatures, the rate of diffusion of solute within the pores of the AC400 increases since diffusion is endothermic. Thus, the percentage adsorption of Cr (VI) increases as the rate of diffusion of Cr (VI) ions in the external mass transport process increases with temperature [12]. There is, however, little or no significant effect on the percentage adsorption.
B
C
D
E
F
H
Figure 2. (A – H) Adsorption experimental data (A: Effect of initial Cr (VI) conc., B: Removal rate at varying initial Cr (VI) conc., C: Effect of Adsorbent dose, D: Removal rate at varying adsorbent dose, E: Effect of temperature, F: Removal rate at varying temperature, G: Effect of pH, H: Removal rate at varying pH)
3.3. Modelling of Relevant Isotherms
3.3.1. Adsorption Equilibrium Isotherms
The Langmuir, Freundlich, Temkin, and D-R isotherms are the most frequently used models to describe the experimental data of adsorption.
(1). Langmuir Isotherm
Langmuir isotherm presents the interaction between adsorbate and adsorbent. It is essential for the design of adsorption process as it is applicable to homogeneous adsorption processes where each adsorbate on to the surface has equal adsorption activation energy. The linear form is provided as:
= + (1)
Plotting versus Ce shows that the adsorption data for
AC400 fitted to the Langmuir isotherm as presented in Figure 3A. The theoretical monolayer saturation capacity, Qo
was also calculated as Qo = . Table 1 presents the
calculated Langmuir constants for the experimental data. The positive value obtained for aL indicates the suitability of Langmuir model to explain the Cr (VI) adsorption using AC400. The separation factor (RL) which examines the
feasibility of the adsorption process for the developed AC. The positive value of RL (0 ˂ RL ˂ 1) obtained for the
experiment indicates that the adsorption process was clearly feasible.
(2). Freundlich Isotherm
For heterogeneous surfaces, this model is the most relevant model especially for multilayer adsorption isotherm and is generally characterized by the heterogeneity factor (1 ). The expression applied to the experimental data for the linear form of Freundlich isotherm is;
In Qe = In KF + In Ce (2)
A plot of In Qeagainst In Ce shown in Figure 3B, provided for the calculation of the slope and intercept. The intercept (In KF) is a measure of adsorption capacity with adsorption
intensity ( ) as the slope and presented in Table 1.
Freundlich isotherm describes reversible adsorption and is generally not restricted to the formation of a monolayer. Freundlich constant (KF), 3.246 [(mol/g)(mol/L)
n
] confirmed a significantly high adsorption capacity of Cr (VI). The magnitude of n resulting from the heterogeneity factor ( is an indication of the favourability of the adsorption. Generally, it is known that the value of n in the range [2 – 10] represent good, [1 – 2] represents moderately good, ˂ 1 represents poor adsorptive characteristics [13]. Based on the value of 5.57 obtained for n, it can be postulated as having good adsorption characteristics.
Based on the correlation coefficients, R2 obtained for Langmuir isotherm (0.973) and Freundlich isotherm (0.991), it can be stated that Freundlich isotherm presents a better fit for AC400 in the adsorption of Cr (VI) than Langmuir isotherm.
(3). Dubinin – Radushkevich (DR) Isotherm
The DR equation is essentially utilized for the description of microporous adsorbent materials. The equation used for D-R isotherm of experimental data is presented as;
In Qe = In QD -2BDRT In (1 + 1 ) (3)
A graph was plotted for In Qe against RT In (1 + 1/Ce) and
the straight line was determined by the method of best fit with relatively high regression as illustrated in Figure 3C. From the graph, the apparent energy used to determine the type of adsorption process was calculated using the equation;
! (4)
Table 1 presents the results of the D-R isotherm constants. The activation energy provides insight into the undergoing process of adsorption although it is not necessarily supported in determining the rate controlling step. For adsorption process in the nature of physisorption, E < 8 kJ/mol, and ion exchange, E exist within the range of 8 – 18 kJ/mol [14]. Alternatively, for film-diffusion-controlled process, E < 16 kJ/mol, particle diffusion – controlled, E is 21 – 38 kJ/mol, and chemical-reaction-controlled, E > 50 kJ/mol [15]. The Apparent Energy (E) value used to adsorb Cr (VI) at 30°C was 0.0843 KJ/mol, thus confirming that the process is physisorption and considering it is less than 16 KJ/mol, it can be classified as film diffusion controlled. The value of R2 obtained from the graph plotted (0.9354) indicates that the adsorption data is slightly consistent with Dubinin - Radushkevich isotherm.
(4). Temkin Isotherm
interactions. Generally, the model relies on the assumption that the heat of adsorption, which is a function of temperature, within the layer will decrease linearly rather than logarithmically with coverage [16]. The equation applied for experimental data to determine the suitability of Temkin isotherm in explaining the interactions between adsorbent and adsorbate.
Qe = BT In AT + BT In Ce (5)
A plot of Qe against In Ce presented a linear graph as
illustrated in Figure 3D. Also, the results of calculated Temkin isotherm constants are presented in Table 1.
The heat of adsorption, BT was determined as a positive
value which indicates that the physical adsorption process is exothermic which is inconsistent with obtained results. The relatively high variation of R2 obtained (0.917) from unity (1.0) shows that the adsorption data does not follow Temkin isotherm.
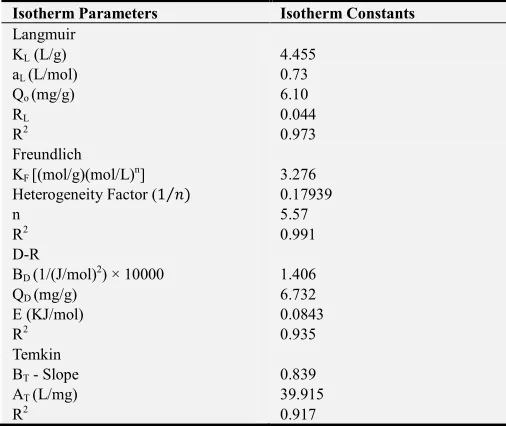
Table 1. Equilibrium Isotherm constants for Langmuir, Freundlich, D-R and Temkin for Cr (VI) on AC400.
Isotherm Parameters Isotherm Constants
Langmuir
KL (L/g) 4.455
aL (L/mol) 0.73
Qo (mg/g) 6.10
RL 0.044
R2 0.973
Freundlich
KF [(mol/g)(mol/L)n] 3.276
Heterogeneity Factor (1⁄ ) 0.17939
n 5.57
R2 0.991
D-R
BD (1/(J/mol)2) × 10000 1.406
QD (mg/g) 6.732
E (KJ/mol) 0.0843
R2 0.935
Temkin
BT - Slope 0.839
AT (L/mg) 39.915
R2 0.917
3.3.2. Adsorption Kinetic Study
The importance of adsorption kinetics cannot be overstated as the rate and mechanism of adsorption can be determined from kinetic studies. Adsorption kinetic study seeks to determine the efficiency of adsorption. The kinetics study is defined as the rate of solute removal that controls the residence time of the adsorbate in solution – solute interface.
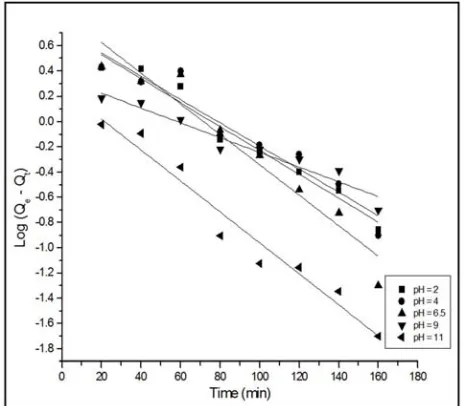
(1). Lagergren Pseudo First Order Kinetic Model
Two vital relevant for adsorption are the mechanism and the reaction rate. The residence time required for completing the reaction is determined by the solute uptake and enumerated from kinetic analysis. Lagergren, in 1898, postulated the first order rate equation for ocalic acid and malonic acid adsorption onto charcoal to describe the liquid-solid interactions based on liquid-solid capacity as
Log (Qe – Qt) = Log Qe - # 2.303 ' (6)
A plot of Log (Qe – Qt) against time (minutes) is illustrated
in Figure 3E, with calculated pseudo-first-order kinetics constants presented in Table 2.
The R2 values [pH (2) = 0.934, pH (4) = 0.911, pH (6.5) = 0.911, pH (9) = 0.911, pH (11) = 0.929] as shown suggest that the Cr (VI) adsorption on AC400 does not fit well with the pseudo-first-order kinetics. Therefore, the experimental data obtained cannot be attributed to the control of boundary layer over the adsorption of Cr (VI) at the initial stages of the process [17].
(2). Pseudo Second Order (PSO) Kinetic Model
PSO kinetic model was also considered for the Cr (VI) adsorption on prepared AC sample. This model assumes that the rate of sites occupation is proportional to the square of unoccupied sites [18]. The linear PSO kinetic equation is presented as:
(
)* = +,), + ) ' (7)
Figure 3F illustrates the graph of linear plot obtained for
'
-(against t (minutes), and the constants of PSO (h, Qe &
k2) were determined and presented in Table 2.
The values obtained for R2 [pH (2) = 0.991, pH (4) = 0.983, pH (6.5) = 0.992, pH (9) = 0.998, pH (11) = 0.994] indicates that Cr (VI) adsorption at varying pHs are consistent with the pseudo-second-order kinetics. The values obtained for h indicated that pH (2) > pH (4) > pH (6.5) > pH (9) > pH (11) which implies that Cr (VI) adsorption on AC400 in an aqueous solution at pH of 2 proceeded quite faster than pH of 4.
Table 2. Isotherm constants for PFO and PSO Kinetic Model for Cr (VI) on AC400.
Parameters pH (2) pH (4) pH (6.5) pH (9) pH (11)
PFO kinetics
k1 (1/min) 0.0218 0.0212 0.0278 0.0135 0.0283
Qe (mg/g) 5.247 5.342 7.359 2.211 1.856
R2 0.934 0.911 0.911 0.911 0.929
PSO kinetics
K2 (1/min) 0.0028 0.0019 0.0022 0.0107 0.0103
h (mg/g min) 0.0886 0.0690 0.0612 0.0579 0.0429 Qe 5.646 6.008 5.291 2.327 2.045
R2 0.991 0.983 0.992 0.998 0.994
3.3.3. Adsorption Mechanism
During a typical adsorption process, the transfer of the solute is generally characterized by either intraparticle diffusion or external mass transfer or both. The rate-limiting step in adsorption is predicted by the adsorption mechanism and this provides an appreciation of the mechanism associated with the phenomena. Generally, the mechanisms that influence the adsorption process include boundary layer surrounding the adsorbent or metal ion from the bulk liquid to the liquid film. Also relevant to the mechanism is the transport of solute from the boundary film to the external surface of the adsorbent and subsequently onto the active sites.
(1). Intra – Particle Diffusion (IPD)
Morris in 1963 to predict the rate controlling step [18] which asserts that when the mass transfer is the controlling step, it is vital to determine the diffusion mechanism. The Weber/ Morris equation for intra-particle diffusion is presented as:
-( #./' ⁄ (8)
A plot of Qt against ' ⁄ at different pH values for AC400
(Figure 3G) presented multiple linear characteristics with double step experienced in the adsorption process. The IPD model constants were calculated and presented in Table 3.
The steep first portion indicates high adsorption rate of Cr (VI) due to a larger surface area and numerous adsorption sites. The gently rise in the second portion may be attributed to the lower concentration gradient which makes the diffusion of the adsorbate into the pores of the AC sample. As pH shifts from 11 to 2, the steeper slopes confirm higher adsorption of Cr (VI) at more acidic media. The higher value of kid for the AC sample at varying pHs correspond to lower values of k2 indicating that intra-particle diffusion retards the adsorption process [19]. This seeks to postulate that Cr (VI) adsorption is very complex and involves more than one diffusion mechanism.
(2). Boyd Model
Further to Intra-particle diffusion, Boyd model was used to analyze the actual rate controlling step involved in the adsorption of Cr (VI) by AC400. The applied Boyd kinetic equation is presented as:
0 21,exp6 78' (9)
A graph of [7 0.4977 7 < 61 7 0 = was plotted against time, t (minutes) to evaluate the linearity of the experimental data (Figure 3H). This indicates whether external transport or intra-particle transport controls the rate of adsorption of Cr (VI) [19]. Obtaining a straight line through the origin indicates that the adsorption process is governed by particle diffusion mechanisms. The reverse holds true for adsorptions governed by film diffusion [20]. Also, presented in Table 3 are the result of calculated Boyd kinetics constant for Cr (VI) adsorbed on AC400 at varying pH.
A: Langmuir isotherm of AC400 for Cr(VI) adsorption at 30°C
B: Linear Freundlich isotherm of AC400 for Cr(VI) adsorption data at 30°C
C: Linear D-R isotherm of AC400 for Cr(VI) adsorption data at 30°C
E: Lagergren PFO kinetics for Cr(VI) adsorption on AC400 at varying pH
F: PSO kinetics for Cr(VI) adsorption on AC400 at varying pH
G: Intra – Particle Diffusion Model for Cr(VI) adsorption on AC400 at varying pH
H: Boyd Kinetic Model for Cr(VI) adsorption on AC400 at varying pH
Figure 3. (A – H) Adsorption experimental data (A: Linear Langmuir Isotherm, B: Linear Freundlich Isotherm, C: D – R Isotherm, D: Temkin Isotherm, E: Pseudo-first-order kinetics, F: Pseudo-second-order kinetics, G: Intra-particle diffusion model, H: Boyd Model) of AC400 for Cr (VI) adsorption data at 30°C.
Using the calculated average diameter of adsorbent as 1.2 mm (r = 0.6 mm), the diffusion coefficient, Di (m2/g) was determined for each pH as presented in Table 3. Based on the result obtained from Figure 3H, it can be obtained that none of the Boyd plots for pH (2), pH (4), pH (6.5), pH (9) and pH (11) pass through the origin which postulates that for AC400, film diffusion is the rate-limiting step for Cr (VI) adsorption. The values obtained for the correlation coefficient (R2) were very close to unity (1) and adequately fits the Boyd model.
Table 3. Calculated Isotherm constant for IPD and Boyd Model.
Isotherm
Parameters pH (2) pH (4)
pH
(6.5) pH (9)
pH (11) IPD
Kid (mg/g min1/2) 0.192 0.186 0.182 0.123 0.0377
R2 0.841 0.863 0.819 0.946 0.814
Boyd Model
B 0.0216 0.0215 0.027 0.0166 0.032 Di × 10-9 (m2/g) 0.067 0.049 0.028 0.0259 0.028
R2 0.98 0.97 0.98 0.95 0.99
4. Conclusion
The prepared AC showed significantly high porous characteristics when applied under various qualitative and quantitative spectroscopic analysis. The adsorption of Cr (VI) under various process parameters indicated pH as the most important parameters with changes in pH values drawing significant variation s in the% adsorption and Qe. Applying
(VI) adsorbed on AC400.
Acknowledgements
The authors gratefully acknowledge the support of those who reviewed this paper and provided many valuable suggestions. This work was financially supported by the National Natural Science Foundation of China (Grant Nos. 51778393, 51278523). Financial support was also provided by the Collaborative Innovation Center of Water Treatment Technology and Material of Jiangsu Province.
References
[1] Gautam, R. K., Sharma, S. K., Mahiya, S., and Chattopadhyaya, M. C. (2015). Contamination of Heavy Metals in Aquatic Media: Transport, Toxicity and Technologies for Remediation. In Heavy Metals In Water: Presence, Removal and Safety (pp. 1–24).
[2] Jaishankar, M., Mathew, B. B., Shah, M. S., and Gowda, K. R. S. (2014). Biosorption of Few Heavy Metal Ions Using Agricultural Wastes. Journal of Environment Pollution and Human Health.
[3] Rahman, M. M., Adil, M., Yusof, A. M., Kamaruzzaman, Y. B., and Ansary, R. H. (2014). Removal of heavy metal ions with acid-activated carbons derived from oil palm and coconut shells. Materials, 7 (5), 3634–3650.
[4] Chen, J., Zhang, L., Yang, G., Wang, Q., Li, R., and Lucia, L. A. (2017). "Preparation and characterization of activated carbon from hydrochar by phosphoric acid activation and its adsorption performance in prehydrolysis liquor," BioRes. 12 (3), 5928-5941.
[5] Song J, Wang L, Song G. (2014). Research on influence factors on determination of specific surface area of carbon material by N2 adsorption method. Journal of applied science and engineering innovation Vol. 1 No. 1
[6] Raj K Vyas, Shashi & Surendra Kumar (2014). Determination of micropore volume and surface area of zeolite molecular sieves by D-R and D-A equations: A comparative Study. Indian Journal of Chemical Technology, Vol. 11, pp. 704-709. [7] Tongpoothorn, W., Sriuttha, M., Homchan, P., Chanthai, S.,
and Ruangviriyachai, C. (2011). Preparation of activated carbon derived from Jatropha curcas fruit shell by simple thermo-chemical activation and characterization of their physic-chemical properties. Chemical Engineering Research and Design, 89, p. 335-340.
[8] Zhao, J., Yang, L., Li, F., Yu, R., and Jin, C. (2009). Structural evolution in the graphitization process of activated carbon by high-pressure sintering. Carbon, 47, 744-751.
[9] Acharya, J., Sahu, J. N., Sahoo, B. K., Mohanty, C. R., and Meikap, B. C. (2009). Removal of chromium (VI) from wastewater by activated carbon developed from Tamarind wood activated with zinc chloride. Chemical Engineering Journal, 150 (1), 25–39.
[10] Al-Jabari, Maher (2016). Kinetic model for adsorption on mineral particles comparison between Langmuir kinetics and mass transfer. Journal of Environmental Technology & Innovation 6, pp. 27–37.
[11] Wu, Q., Zhao, J., Qin, G., Wang C., Tong, X., Xue, S. (2013). Photocatalytic reduction of Cr (VI) with TiO2 film under visible light. Applied Catalysis B: Environmental, Vol. 142-143, pp. 142-148.
[12] Yang, J., Yu, M., & Qiu T. (2014). Adsorption thermodynamics and kinetics of Cr (VI) on KIP210 resin. [13] Cao, R., Fan, M., Hu, J., Ruan, W., Wu, X., & Wei, X. (2018).
Artificial Intelligence Based Optimization for the Se (VI) Removal from Aqueous Solution by Reduced Graphene Oxide-Supported Nanoscale Zero-Valent Iron Composites. US National Library of Medicine: National Institute of Health. Vol. 11 (3), pp. 428.
[14] Youssef, S., El-Khouly S., & El-Nabarawy T. H. (2008). Removal of Pb (II) and Cd (II) from aqueous solution using activated carbons from pecan shells: Carbon Lett, 9, pp. 8-13. [15] Ayawei N., Ebelegi A. N., & Wankasi D. (2017). Modelling
and Interpretation of Adsorption Isotherms. Journal of Chemistry, Volume 1, ArticleID 3039817, pp. 1 -11.
[16] Boudrahem, F., Aissani-Benissad, H., and Aït-Amar, (2009). Sorption dynamics and equilibrium for the removal of lead ions from aqueous phase using activated carbon from coffee residue activated with ZnCl2. Journal of Environmental
Management, 90, p. 3031- 3039.
[17] Karthikeyan, S., Balasubramanian, R., and Iyer, C. S. P. (2007). Evaluation of the marine algae Ulva fasciata and Sargassum sp. For the biosorption of Cu (II) from aqueous solutions. Bioresource Technology, 98 (2), p. 452-455. [18] Sankar, K. R., Venkatraman B. R., & Arivoli S. (2013).
Equilibrium and Thermodynamic Studies on the Removal of Iron (III) onto Plater of Paris. International Journal of Engineering Innovation & Research, Vol. 2, ISSN: 2277-5668. [19] Wang, L., Zhang, J., Zhao, R., Li, Y., Li, C., and Zhang, C. (2010). Adsorption of Pb (II) on activated carbon prepared from Polygonum orientale Linn: kinetics, isotherms, pH, and ionic strength studies. Bioresource Technology, p. 5808-5814. [20] Doke, K. M., Khan, E. M. (2017) Equilibrium, Kinetic and