Published online February 28, 2014 (http://www.sciencepublishinggroup.com/j/ijepp) doi: 10.11648/j.ijepp.20140201.15
Assessment of health related impacts of urban heat
island (UHI) in Douala Metropolis, Cameroon
Enete, I. C
1, *, Awuh, M. E
2, Amawa, S
21
Dept. of Geography& Meteorology, NAU, Awka, Nigeria
2
Dept. of Geography, University of Buea, Cameroon
Email address:
ifeanyienete@yahoo.co.uk (Enete, I. C)
To cite this article:
Enete, I. C, Awuh, M. E, Amawa, S. Assessment of Health Related Impacts of Urban Heat Island (UHI) in Douala Metropolis, Cameroon.
International Journal of Environmental Protection and Policy. Vol. 2, No. 1, 2014, pp. 35-40. doi: 10.11648/j.ijepp.20140201.15
Abstract:
Urban heat island (UHI) has the potential to directly influence the health and welfare of urban residents. This study assessed the health related impacts of urban heat island in Douala Metropolis in Cameroon. Two land-use classes (resident and commercial) and two land-cover types (paved and green surfaces) were used for the selection of the sample sites using purposive sampling technique. Two hundred and fifty questionnaires were distributed and analyzed using descriptive and inferential statistics such as multiple and simple bar charts, tables, graphs, central tendency, running mean and spearman’s rank correlation. The result revealed that the people of Douala are always in discomfort the climate usually in the form of heat stress, stroke, crumps, exhaustion, fatigue, headache, nausea, fainting and even death. The result equally showed a strong relationship between the land-use/cover and heat related symptoms.Key words:
Heat Island, Urban, Impacts, Douala, Land Cover, Land Use1. Introduction
It has long been recognised that our urban centers are sources of heat and that the thermal structure of air above them is affected by the so-called “heat island effect’’. In fact, an urban heat island is best visualized as a dome of stagnant warm air over the heavily built-up areas of our urban areas. This phenomenon, known as “Urban Heat Island” can raise the mean air temperature of a city by 2 – 8 degree Celsius (Oke, 1987, and WMO, 1984). Urban heat Island (UHI) is the name given to the characteristic warmth of both the atmosphere and the lithosphere in cities (urban areas) compared to their (non-urbanized) surroundings (Voogt, 2004). Urban heat Island may be up to 10 – 150C under optimum conditions (Oke, 1982). For almost 200 years, climatic differences between urban and rural environments have been recognized (Taha, 1997), of which temperature is the most obvious (Unger et al., 2001).
The heat that is absorbed during the day by the buildings, roads and other constructions in an urban area is re-emitted after sunset, creating high temperature differences between urban and rural areas. The exact form and size of this phenomenon varies in time and space as a result of meteorological, location and urban dynamics among others. Therefore, urban heat island morphology is strongly
controlled by the unique characteristics of each city. Oke(1982) stated that a larger city with a cloudless sky and light winds just after sunset, the boundary between the rural and the urban areas exhibits a steep temperature gradient to the UHI, and then the rest of the urban area appears as a “plateau” warm air with a steady but weaker horizontal gradient of increasing temperature towards the city centre. The uniformity of the “plateau” is interrupted by the influence of distinct intra-urban land-uses such as parks, lakes and open areas (cool), and commercial, industrial or dense building areas (warm). In metropolitan areas especially in Douala, the urban core shows a final “peak” to the UHI where the urban maximum temperature is found. The difference between this value and the background rural temperature defines the “UHI intensity (Enete, 2009). The intensity of the UHI is mainly determined by the thermal balance of the urban region and can result in a temperature difference of up to 10 degrees Celsius. At night, stored heat is released slowly from the urban surface, contrary to the rapid heat escape from rural surfaces. Thus, the UHI intensity peaks several hours after sunset when rural surfaces have cooled
to be universally typical by many researchers (Shashua-Bar and Hoffman, 2000). Of the many factors contributing to urban heat Island, changes on surface physical characteristics (including geometry, thermal conductivity and wind speed) as well as the concentrated release of anthropogenic heat, are believed to be of great importance and as such, the influence of artificial (urban) factors and natural topographical conditions are difficult to separate (Unger et al, 2001).
Changes caused by urbanization on humans include diseases associated with crowding, tuberculosis, pneumonia, respiratory illness and psychological disorders) (Harrison and Gibbs, 1976; Lelvis and Ackrill, 1993). Urban effects on other life forms include physiological changes in urban flora and fauna and their diversity, (Sukopp and Werner, 1982).Urbanization effects on the physical environment are apparent on air and water quality (Urban Air Pollution, 1992) and the microclimate (Oke, 1987). Thus, a study of urban heat Island can help to understand the air quality, energy use, water use efficiency, human comfort of an area and more important human health. This study seeks to assess the impact of UHI on human health in Douala.
2. Human Health
Urban heat islands have the potential to directly influence the health and welfare of urban resident (Enete, 2009). Within the United States alone an average of 1000 people, die each year due to extreme heat (Cuangnon et al., 1996). Urban heat islands are characterized by increased temperature; they can potentially increase the magnitude and duration of heat waves within cities. Research has found that mortality rate during a heat wave increases exponentially with the maximum temperature (Buecgley et al., 1972), an effect of urban heat islands can be particularly harmful during a heat wave, as it deprives urban residents of the cool relief found in rural areas during the night (Clarke, 1972). Statistics for Nigeria show increased mortality during transition periods because of heat waves (Adefolalu, 1999).
Increased daytime temperatures, reduced nighttime cooling and higher air pollution levels associated with urban heat islands can affect human health by contributing to general discomfort, respiratory difficulties, heat cramps and exhaustion, non-fatal heat stroke and heat related mortality. The centres for Disease control and prevention estimates that from 1979-2003, excessive heat exposure contributed to more than 8,000 premature deaths in the United States. This figure exceeds the number of mortalities resulting from hurricanes, lighting, tornadoes, floods and earthquakes combined.
3. Materials and Method
3.1. Method of Data Collection
To investigate the health implication of urban heat island
in Douala city, household interview were conducted between the months of February and March, 2012 and questionnaire administered. The months of February and March were chosen because they appear to be the hottest months. Most survey questions were close ended with multiple-choice responses. Fifty semi-closed questionnaires were administered using random sampling techniques in each of the selected sample site giving 250 questionnaires. The questions were directed toward self-reported diagnoses of heat related illness, heat illness symptoms and indoor/outdoor heat exposure. The adaptive measures or responses used by the people to counteract heat related disease and symptoms were also examined. However, observation showed that even with these mitigation measures most people still struggle with heat related illness.
3.2. Sample Site Selection
Two land-use classes (resident and commercial) and two land-cover types (paved and green surfaces) were used for the selection of the sample sites. The following land-use/land covers were then selected using purposive sampling.
1) High-density, high rise, non residential areas with low greenery.( DTL)
2) Low building density, low-rise, residential areas with high greenery. (HDR)
3) Medium density, mixed residential (some residential, some commercial / institutional) area with a greenery extent between (1) and (2) above. (NW2)
4) Areas with similar land-use, building density and greenery, one having more fully developed vegetation canopy than the other. (LVR and LOR) A search for locations with these characteristics resulted in the selection of the following sites: 1. DTL (Downtown location) = Akwa South (CBD), stories accompanied by heavy traffic, high degree of paved areas and little or no greenery.
2. HDR (High-density Residential Site) = Bonapriso. Residential areas with low traffic volume and heavy presence of mature vegetation
3. NW2 (Multi-family Residential/Institutional Site) = Bassa, Bonaberi industrial, residential/ commercial area with substantial parking lots.
4. LVR (Low-density Vegetated Residential Neighborhood) = Bonanjo
5. LOR (Low-density Open-Canopy Residential Neighborhood) = Bonamousadi
3.3. Data Analysis
4. Results and Discussions
4.1. Health Implications of UHI in Douala
Extreme heat is more than an issue of discomfort. It forces the body into overdrive as it tries to stay cool through perspiration and evaporation. The level of discomfort experienced by the people of Douala based on this study, shows that they are always in discomfort by the climate. This is usually in the form of heat stress, heat stroke, heat crumps, exhaustion, fatigue, headache, nausea, fainting and even death. The result shows that the health implication of UHI in the Douala metropolis has been on an increase due to increase in UHI. The result reveals that the different transects show some degree of similarities in terms of the implication of urban heat island. It equally shows a strong relationship between the land use types/cover, and heat related symptoms. The different land uses identified are residential, commercial, and industrial while the land cover identified are greenery and paved surface.
The buildings identified (that is structure, building material and roof) in the area compose of storeys building, which could potentially cause a small depression with limited air circulation. The floors and the walls are made of cement blocks (bricks or concrete), they have either metal sheet roofs or concrete sheet roofs, which act as temperature absorbers absorbing short waves radiation from the sun during the day, and counter- radiating it at night as long wave radiation. This process modifies the temperature of the area causing an increase in temperature and an increase in UHI.
The inhabitants hold a strong perception about temperature changes in the Douala metropolis and its health implication. It was observed that about 99.2% of the households sampled confirmed that there has been a change in the temperature of the area while 0.4 % is of the view that no changes have taken place and the remaining 0.4% was indifferent as far as changes in temperature are concern (Table 1).
Table 1: Perception of the People in Respect to Temperature Change
Questions Responses
(yes)
Responses
(No) Indifferent Total
Has there been a change in the temperature of Douala? 248( 99.2) 1 ( 0.4) 1 (0.4) 250(100)
Has it been increasing? 248 ( 99.2) 1 (0.4) 1 (0.4) 250(100)
Was the change noticed in Feb./march 201(80.4) 45 (18%) 2 (0.8) 250(100)
Does the increase in temperature make you or members of your household
uncomfortable? 240(96) 6(2.4) 4(1.6) 250(100)
Do you or members of your households visit the hospital or clinic s a result of heat
related illnesses? 225(90) 20 ( 8) 5(2) 250(100)
The 248 were of the view that there was a change in temperature. This further affirms that the change has been on the increase. Out of the 248 who were of the opinion that there was an increase in temperature, 201 confirmed that the increase in temperature was highly noticed in the months of February and March. This increase in temperature in the month February and March may be because of the fact that these months represent the peak of the dry season in Douala. Generally, the result showed that 96% of the household uphold the view that increase in temperature makes them uncomfortable since it increases the number of heat- related symptoms and illnesses. Because of this, 90% of those reported with both heat related sickness (HRS) and heat related illness (HRI) visited the hospital for medical check-up while 8% use other behavioural or traditional methods to cope with the situation and 2% were indifferent as far as mitigation measures are concerned.
4.2. Heat Related Symptoms Identified in the Area
Self-reporting of heat-related symptoms was proportionally different among the sampled sites. The result shows an average of above one person within all households selected across all transects that is at least one
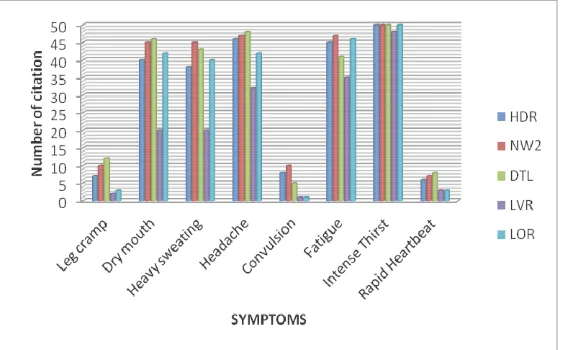
person in each household sampled reported at least one heat related symptoms in the year 2012. Eight heat related symptoms were identified in the area as the major sign or symptoms of urban heat island. The symptoms identified were leg cramp, dry mouth, fatigue, heavy sweating, headache, convulsion, intense thirst, and rapid heartbeat. It was observed that the rate of occurrence varied considerably from one area or transect to another as shown in figure1
According to their responses, Multi-family Residential/Institutional Site (NW2) was the zone or transect with the highest cited cases of heat related symptoms (261 occurrence) followed by Down Town Location (DTL) with 253 citation and High-density Residential Site (HDR) with 240 occurrence. While Low-density Vegetated Residential Neighbourhood (LOR) had the least reported cases of heat related symptoms (with 178 cases), followed by (LVR) Low-density Open-Canopy Residential Neighbourhood with 204 cases. The increase in heat related symptoms in NW2 comprising of Bassa, and Bonaberi can be linked to the land use type of the area, which is dominated by industrial and commercial activities of all sorts. These Manufacturing industries create pockets of high temperature zones around their sites. This contributes to the high temperature trend within the City. Moreover, the busy nature of the area due to the presence of institutions and commercial actives further increased traffic
flow in the area; this goes a long way to increase the temperature and the UHI situation. The release of pollutants and the emission of gases especially green house gases into the atmosphere further modify the microclimate of the area and leads to an increase in temperature as well as UHI. The increases in heat- related symptoms of UHI in DTL was attributed to heavy traffic flow and the high degree of paved surfaces, the congested nature of the buildings in the area and the present of tall buildings limit the free circulation of air and increased the risk of UHI. The drop in the number of heat related symptoms witnessed in LVR and LOR are attributed to the fact that these regions are both low-density residential area with little or no commercial activities.
A direct ranking of these heat- related symptoms shows that intense thirst (a desire or need to drink a liquid, or the feeling of dryness) was ranked first as the most common symptom of UHI with 96% (table 2)
Table 2: Direct ranking of heat-related symptoms in Douala urban space
Symptom Leg cramp Dry mouth Fatigue Heavy
sweating Headache Convulsion
Intense thirst
Rapid heart beat
Number cited 34 193 214 186 215 25 242 27
% 13.6 77.2 85.6 74.4 86 10 96.8 10.8
Rank 6 4 3 5 2 7 1 8
Intense thirst was followed by headache (a pain in the head lasting for some time) with 86% and fatigue (extreme tiredness or weariness) with 85.6%. The least cited heat related symptoms in the area was convulsion (A violent shaking of the body caused by uncontrollable muscle contractions) with 10% followed by rapid heartbeat (a singlecontraction of the lower chambers of the heart that drives blood through the body) with 10.8% and leg cramp (a sudden painful involuntary contraction of a muscle) with
13.6%. The increase in thirst in the area was attributed to increase in temperature i.e. UHI which increases the rate of respiration and the amount of water loss. An increase in water loss increases the demand for water by the body and further increases the consumption of water to replace the one lost.
However, the rate at which this heat related symptoms occurred showed a great deal of variation from one sample site to another (fig 2).
Fig3. Heat Related Symptoms identified in the various Transects per Age groups
From figure 3, the adult age group ranging from 20-50 are more susceptible to heat related symptoms followed by the old (50+). While children (less than 20) were the least susceptible to heat related symptoms. The adults were more susceptible due to the nature of their activities and because most of them act as bread winners for their families and are mostly involved in commercial and industrial activities, which necessitate their movement from one place to another. This leads to an increase in water loss as well as body temperature. An increase in body temperature stimulates the development of some heat related symptoms such as intense thirst and dry mouth. Heat related symptoms common to this age group include; fatigue, intense thirst, headache, and heavy sweating
The old were less susceptible since they are not very much involved in strenuous activities that lead to rapid water loss. Moreover, their degree of exposure to direct sun light is very much limited. However, heat -related symptoms identified as pertinent to people of this age group include leg cramp, and rapid heartbeat. While the heat related-symptoms common to children is convulsion.
4.3. Heat Related Diseases Identified in the Area
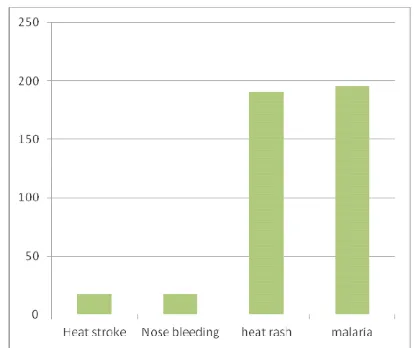
Urban heat island related diseases identified in Dualla include malaria, heatstroke, heat rash and nose bleeding. According to the result, malaria was the most cited heat related disease with over 195occurrance, followed by heat rash with 191occurrances, and heat stroke and nose bleeding with both 17cases. It was observed that the rate of occurrence varied considerably from one site to another (fig4)
Figure 4: percentage of heat related diseases identified per transects.
From figure 4, NW2 had the highest reported cases of heat related illnesses (27%). Just like the case of heat related -symptoms, this zone is an industrial zone comprising of the Bassa and Bonaberi industrial zone. The release of pollutants from these industries as well the emission of toxic gases from vehicles especially trucks and other transportation vehicles increased and modified the temperature of the area. On the other hand, UHI. LVR had the least cases of heat-related illnesss (HRI) because it is a residential area with some degree of vegetation cover. It was observed that some of the heat -related illnesses were more common than others. Malaria was the most reported heat- related illness in the region (195cases (78%) followed by heat rashes (191cases (76.4%) while heat stroke and nose bleeding had the least number of cases.
Figure 5: frequencies of heat-related diseases
The heat- related illnesses identified shows some degree of variation from one transects to the other Fig.6.
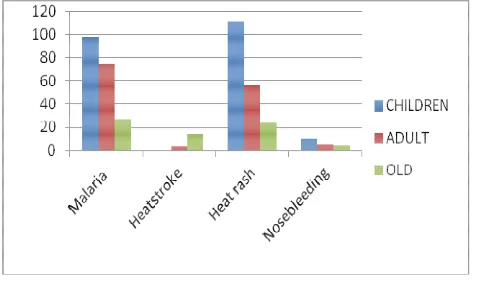
Figure 7: variation of heat related diseases per age group
The heat related illnesses malaria and heat rash were most common among children (with over 88/115cases) followed by adults (with over 70/48cases) and least among the old with citations just above 20. The thick clothing worn on children tends to block their sweat dock thereby increasing their risk to heat rash. Moreover, the weak nature of their immune system makes them more susceptible and less resistant to the malaria parasite. Nose bleeding in all age groups had occurrence less than 10 but it was higher in children than in the others. Generally, heat stroke, which is the least reported heat related disease, is common mostly to the aged with over 11csaes followed by adult with two occurrences. It was completely absent among children.
5.4. Conclusion
The present study explored the effects of UHI on land-use/land-cover types and its health implications for Dualla residents. The different transects show some degree of similarities in terms of the implication of urban heat island. It equally showed a strong relationship between the landuse types/cover, and heat related symptoms. Eight heat related symptoms were identified in the area as major sign or symptoms of urban heat island. The symptoms identified were leg cramp, dry mouth, fatigue, heavy sweating, headache, convulsion, intense thirst, and rapid heartbeat. However, these heats related problems could be reduced through the use of grey infrastructure; use of green infrastructure; awareness and behavior change; development of health warning systems and heat action plans; and finally involvement of stakeholders in decision making and action plans (Enete and Okwu,2013).
References
[1] Adefolalu, D.O (1999) : Climate Change and Health. A paper presented at the World Meteorological Day celebration on 23rd March at Oshodi, Lagos Nigeria.
[2] Buechley, R.W, Van Bruggen, J. and Trippi, L. E (1972): “Heat Island = Death Island?” Environmental Research, 5: 85 – 92.
[3] Changnon, S.A Kunkel, K.E and Reinke, B. C (1996): “Impacts and Responses to the 1995 Heat Wave: A call to Action”. Bulletin of the American Meteorological Society, 77:1497 – 1506.
[4] Clarke, J.F (1972): “Some Effects of the urban Structures on Heat Mortality”. Environmental Research 5:93 – 104. [5] DEA 350: “Ambient Environment”: Thermal Environment
Cornwell University Ergonomies Web, Lecture Note. [6] Enete, I.C (2009): An Assessment of urban heat island
situation and Adaptative measures in Enugu, Nigeria. Unpublished Ph.D Thesis Enugu State University of Science and Technology, ESUT.
[7] Enete, I.C and Okwu, V.U (2013): Mapping Enugu City’s Urban Heat Island. International Journal of Environmental Protection and Policy, 1(4):50-58.
[8] Harrison, G. A and Gibson, J.B (1976): Man in Urban Environment s, Oxford: Oxford University Press.
[9] Lelvis, J.E and Carlson, T.N (1989): “ Spatial Variations in Regional Surface Energy Exchange Patterns for Montreal, Quebec”, The Canadian Geographer, 33: 194 – 203. [10] Oke, T.R (1982): The Energetic Basis of Urban Heat Island.
Journal of the Royal Meteorological Society. 108 (455): 1 – 24.
[11] Oke, T.R (1987): Boundary Layer Climates 2nd edition, London: Methuen and Co, p435.
[12] Shashua-Bar, L and Hoffman, M.E (2000): Vegetation as a Climatic Component in the Design of an Urban Street; An Empirical model for predicting the cool Effect of Urban Green Areas with Trees. Energy and Building, 31 (3): 221 – 235.
[13] Sukopp, H. and Werner, P. (1982): Nature in Cities. Nature and Environment Series No. 28, Strasbeurg, Council of Europe Publication.
[14] Taha, H. (1997): Urban Climates and Heat Islands: Albedo, Evapotranspiration, and Anthropogenic heat. Energy and Buildings, 25 (2): 99 – 103.
[15] Unger, J, Siimeghy and Zoboki, J.(2001): Temperature Cross-section Features in an Urban Area. Atmosperic Research, 58 (2): 117 – 127.
[16] Voogt, J.A (2004): Urban Heat Islands: Hotter Cities. America Institute of Biological Sciences.