*Corresponding author: nkgupta69@yahoo.co.in
EFFECT OF WATER STRESS ON PHOTOSYNTHETIC ATTRIBUTES, MEMBRANE
STABILITY AND YIELD IN CONTRASTING WHEAT GENOTYPES
SUNITA GUPTA1, N.K. GUPTA1*, AJAY ARORA2, V.P. AGARWAL1 AND A.K. PUROHIT1 1Swami Keshwanand Rajasthan Agricultural University, Bikaner-334006, Rajasthan 2Division of Plant Physiology, Indian Agricultural Research Institute, New Delhi-110012
Received on 21st April, 2011; Revised and accepted on 23rd January, 2012
SUMMARY
The effect of water stress on physiological parameters and yield components of drought tolerant (C-306) and drought sensitive (HD 2329) wheat genotypes was investigated under pot culture conditions. The stress condition was created at tillering, anthesis and post anthesis stages by withholding water supply for a period of 8 days. Water stress reduced the net rate of photosynthesis, transpiration and stomatal conductance in both the genotypes. Internal CO2 concentration increased significantly under water stress conditions. The reduction in relative water content and membrane stability index was significantly higher in HD 2329. The chlorophyll and carotenoid content decreased whereas sugar and proline content increased under water stress in both the genotypes. Genotype C-306 registered lesser reduction in leaf area, grain number, spikelet number, 1000–grain weight and harvest index in response to water stress. HD 2329 exhibited higher grain weight per plant under optimum irrigation (control) but under water stress C-306 showed 19% more grain weight per plant. It is suggested that the drought tolerance mechanism exist in wheat genotype C-306 owing to its better management of gas exchange parameters, stomatal regulation, membrane stability, photosynthetic pigments and osmotically active metabolites, particularly at anthesis stage.
Key words: Chlorophyll, membrane stability, photosynthesis, stress, transpiration, wheat, yield
INTRODUCTION
Water stress is one of the serious environmental threats for plant growth, development and yield. It affects the plants in different ways and induces various physiological and biochemical adaptations in plants. At the primary level, drought alters the plant water relation whereas at the cellular level, it affects the integrity of membranes and proteins, which in turn leads to metabolic dysfunction, mediated by general disruption of cellular compartment and loss of activity of membrane-based enzymes (Fariduddin et al. 2009). Water stress
stimulates senescence and enhances the remobilisation of pre-anthesis stored carbohydrates from leaves to the
grains (Guoth et al. 2009). The primary symptoms of
leaf senescence are the break down of chlorophyll and decline of photosynthetic activities (Gregersen and Holm 2007). Moreover, drought induces stomatal closure and consequently increases the leaf internal CO2 concentration (Cornic 2000). It also affects the PS II and rubisco activities (Sumesh et al. 2008). These
detrimental steps ultimately result in a decline in crop productivity.
some of the common metabolites that accumulate under stress conditions (Sumesh et al. 2008). Blum et al.
(1999) underlined that genetic differences in osmotic adjustment (OA) existed among wheat cultivars and that high OA cultivars tended to yield better than low OA. Anthocyanins are highly water soluble pigments that act as UV screens and osmolytes to alleviate the adverse effects of stresses (Wahid 2007).
Yield is the most important economic trait and grain production is the main selection criteria for drought tolerance in wheat. Many physiological traits have been linked with grain yield of wheat under water stress (Zhao
et al. 2007). Therefore, the present investigation was
planned to study these traits at vegetative and reproductive stages to facilitate the screening and selection of cultivars for water stress tolerance.
MATERIAL AND METHODS
Growth conditions: Two wheat (Triticum aestivum L.)
genotypes namely C-306 (drought tolerant) and HD 2329 (drought sensitive) were taken for study. Seeds of these genotypes were sown in ceramic pots of uniform size (30×30 cm) filled with 10 kg air dried sandy loam soil and farm yard manure in 6:1 ratio. The soil had bulk density of 1.50 g cm-3, pH 8.4, field capacity 11.8% and
permanent wilting point 2.8%. Each pot was supplemented with 60, 60 and 60 kg ha-1 of N, P and K
at the time of sowing. Additional urea was added after 1 month of sowing at 60 kg N ha-1. One hundred pots
were used for each genotype. After thinning, five plants were maintained in each pot. Ten pots per treatment were used at every stage for measurement of various physio-biochemical parameters. Plants were watered at regular intervals. Water stress conditions were created by withholding water supply for 8 days at tillering, anthesis and post anthesis stages. Pots were saturated with water before starting the moisture stress treatment. All the observations were taken on flag leaf of the plants.
Photosynthetic parameters: Net photosynthetic rate,
stomatal conductance, transpiration rate, and internal CO2 concentration of leaves were determined by a portable open flow, gas exchange system (CID-301, USA). These measurements were taken at 10.0 – 11.0 a.m. when relative humidity, temperature, photosynthetic
photon flux density and CO2 concentration ranged from 50 to 60%, 30 to 35ºC, 1200 μmol m-2s-1 and 350 to 360
μmol mol-1, respectively.
Pigments and osmolytes: Total chlorophyll and
carotenoid contents were estimated according to Arnon (1949). Total soluble sugars were extracted using the method of Dubois et al. (1956). Leaf sample (100 mg)
was homogenised in 5 ml of 80% ethanol and centrifuged at 10000xg for 10 min. Homogenate was centrifuged thrice and the supernatant fraction separated and pooled. Supernatant was taken in test tubes and dried in oven at 60ºC. Distilled water and freshly prepared anthrone was added to these tubes and boiled in water bath for 10 min. The tubes were cooled and mixture read at 620 nm. A standard curve was prepared by using glucose solution.
For proline estimation, samples were homogenised in 5 ml of 3% aqueous sulphosalicylic acid and centrifuged at 5000xg for 5 min (Bates et al. 1973). An
equal volume of glacial acetic acid and ninhydrin solution were added to the extract. The samples were heated to 100ºC for 1 hour and 5 ml toluene was added. The absorbance of the toluene layer was measured at 528 nm. The quantity of proline was calculated using standard curve.
Water status and membrane stability: Leaf relative
water content (RWC) was estimated according to Barrs and Weatherly (1992) and calculated as: RWC = [(Fresh mass – dry mass)/(saturated mass – dry mass)] × 100. For membrane stability index, the shoot portion (100 mg) of control and stressed plants were thoroughly washed and then placed in 10 ml of double distilled water at 40ºC for 30 min (Sairam et al. 1997). Electrical conductivity
was measured by conductivity meter (C1). Subsequently, the same samples were placed on boiling water bath (100ºC) for 10 min and their electrical conductivity was recorded again (C2). The membrane stability index (MSI) was calculated as: MSI = [1-(C1/C2)] × 100.
calculated as: HI= [Economic yield/Biological yield] × 100. The experiment was repeated for two consecutive years under similar conditions. Five replications were taken for each parameter. The data were analysed by one way analysis of variance and expressed as mean values ± SE.
RESULTS AND DISCUSSION
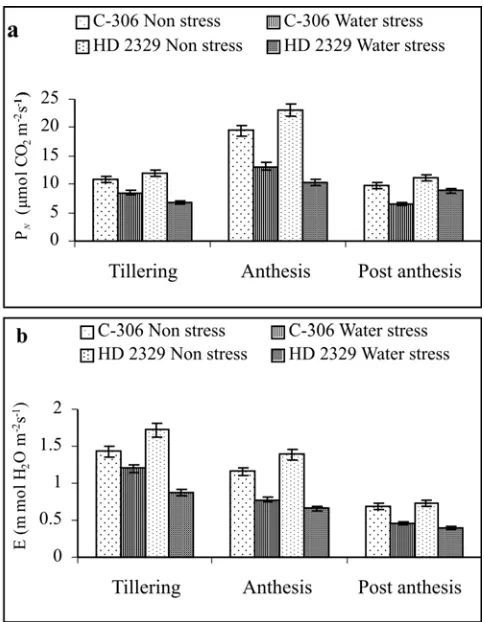
Wheat varieties respond differentially to water deficit in the form of changes in various physiological and biochemical processes. In the present investigation, the water stress conditions were created by withholding irrigation at tillering, anthesis and post anthesis stages in two wheat genotypes (C-306 and HD 2329). Net photosynthetic rate decreased significantly in both the genotypes under water stress conditions. Maximum reduction in rate of photosynthesis under water stress was 55.07% and 32.26 % in HD 2329 and C-306, respectively at anthesis stage (Fig. 1). The rate of
photosynthesis depends on stomatal and non stomatal components and each of the components has a unique response to environmental variations (Bethke and Drew, 1992). Transpiration rate also reduced significantly in both the genotypes under water stress conditions. The per cent reduction were 16.08-33.0 (C-306) and 46.57-52.51 (HD 2329) at different growth stages. The stomatal conductance also decreased while internal CO2 concentration increased on account of water stress conditions The magnitude of value was always higher in HD 2329 (Fig. 2). This reduction in transpiration rate and stomatal conductance and concomitant increase in intercellular CO2 concentration suggests that both stomatal and non stomatal factors were involved in the reduction of photosynthesis (Zhao et al. 2007).
Comparatively higher internal CO2 concentration in HD 2329 indicates that the main cause of its lower photosynthesis might be the photosynthetic capacity of mesophyll cells rather than its lower stomatal conductance. Siddique et al. (1999) reported that
Fig. 1. Effect of water stress on (a) photosynthesis and (b)
transpiration in wheat. Vertical bars show SE (n=5)
Fig. 2. Effect of water stress on (a) stomatal conductance (b)
internal carbon dioxide concentration in wheat. Vertical bars
exposure of plant to drought stress led to a significant decrease in photosynthetic rate and stomatal conductance and concomitant increase in intercellular CO2 concentration. It was also observed that the rate of transpiration decreased with the advancement of maturity. It might have occurred on account of the cumulative effect of decreased soil moisture content. The stomatal behaviour, which influences the water status of plant tissue during water stress, is of utmost importance in determining the growth rate of plant during drought (Yadava et al. 1994). Decrease in transpiration
rates and increase in leaf temperature have been reported as important parameters of drought tolerance in wheat genotypes (Ravichanadran and Munsge 1999).
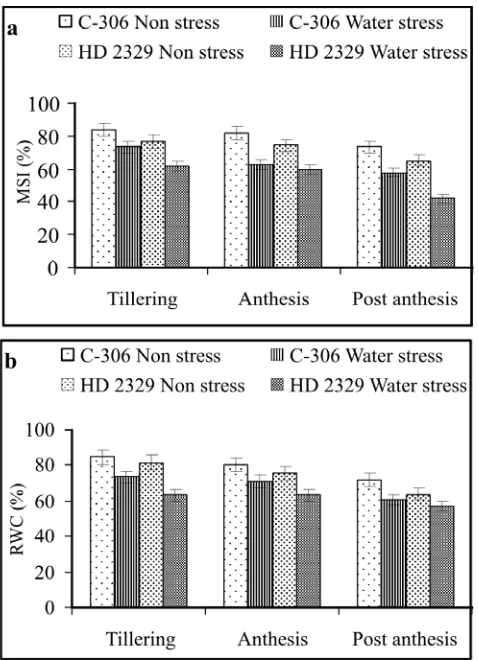
Membrane stability index decreased significantly under water stress in both the genotypes. C-306 always maintained higher stability (less injury) than HD 2329 under non stress as well as water stress conditions (Fig. 3). It is well known that the water stress causes accumulation of reactive oxygen species which result in membrane damage. Higher membrane stability in C-306 reflects the existence of stress resistance mechanism in this genotype. Lower membrane stability in susceptible genotypes of wheat, maize and groundnut has been reported by various workers (Gupta et al. 2000). Water
stress conditions significantly reduced the relative water content in both the genotypes, with greater decline in HD 2329 (Fig. 3). Islam et al. (1998) reported that per cent
reduction in relative water content was rapid in drought susceptible genotypes of wheat. Guoth et al. (2009)
observed that water status decreased earlier and at a higher rate in sensitive than in the tolerant cultivars of wheat. Thus, in the present investigation, a rapid reduction in water status of HD 2329 indicates its sensitivity to water stress.
Chlorophyll and carotenoid contents decreased significantly under water stress conditions in both the genotypes. The drought tolerant genotype C-306 always exhibited higher amount of these pigments under stress. In case of non stressed plant, it was higher in HD 2329. Gupta et al. (2000) reported that water stress invariably
reduced chlorophyll content but its reduction was lower in tolerant wheat genotypes. Carotenes are responsible for scavenging of singlet oxygen and hence their
comparative level in a genotype can determine its relative tolerance. From our data, it is inferred that a better stability in the level of these pigments under water stress might have kept C-306 in privileged situation (Table 1).
Accumulation of osmotically active metabolites under stress conditions is a common phenomenon in wheat and other crops. Our results showed that the levels of proline and soluble sugars enhanced under water stress in both the genotypes. The accumulation was comparatively higher in drought tolerant genotype C-306. Perusal of data show that the soluble sugars increased from 20.16 to 33.26% (C-306) and 8.27 to 13.60% (HD 2329) at various stages. Simultaneously, proline accumulation enhanced by 21.62 to 32.14% and 5.97 to 17.10% in C-306 and HD 2329, respectively
Fig. 3. Effect of water stress on (a) membrane stability index
and (b) relative water content in wheat genotypes. Vertical bars
Table 1. Effect of water stress on chlorophyll and carotenoid content in wheat genotypes. Values are means ±SE
---Genotype/ Chlorophyll content (mg g-1 fresh wt) Carotenoid content (μg g-1 fresh weight)
treatment Tillering Anthesis Post anthesis Tillering Anthesis Post anthesis
---C-306
Non stress 1.28±0.043 1.37±0.039 1.22±0.029 0.83±0.076 0.80±0.061 0.76±0.054 Water stress 1.14±0.063 1.00±0.034 0.96±0.054 0.79±0.068 0.68±0.065 0.63±0.042
HD 2329
Non stress 1.59±0.072 1.47±0.065 1.34±0.32 0.95±0.069 0.87±0.071 0.80±0.087 Water stress 1.11±0.051 0.90±0.025 0.83±0.28 0.77±0.072 0.63±0.047 0.56±0.076
---Table 2. Effect of water stress on soluble sugars and proline content in wheat genotypes. Values are means ±SE
---Genotype/ Soluble sugars (mg g-1 fresh wt) Proline (mg g-1 fresh wt)
treatment Tillering Anthesis Post anthesis Tillering Anthesis Post anthesis
---C-306
Non stress 10.45±1.32 12.98±1.23 19.10±1.89 0.58±0.023 0.57±0.071 0.63±0.037 Water stress 13.09±1.29 19.45±1.89 26.36±2.07 0.74±0.032 0.84±0.079 0.87±0.068
HD 2329
Non stress 15.75±1.47 14.86±1.62 21.41±1.78 0.63±0.042 0.63±0.058 0.67±0.049 Water stress 17.17±1.81 17.20±1.54 23.62±1.69 0.67±0.038 0.76±0.049 0.77±0.073
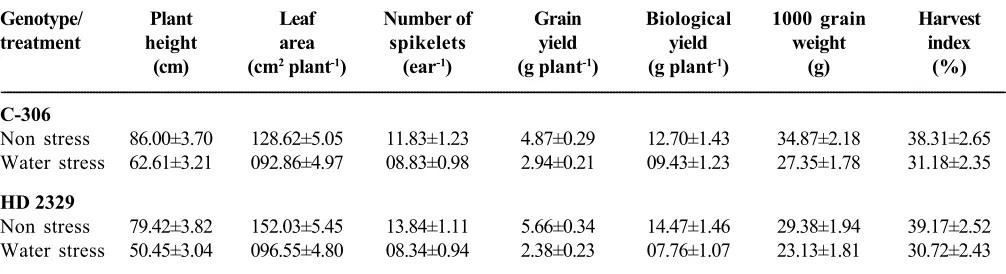
---Table 3. Effect of water stress on yield and yield components in wheat genotypes. Values are means ±SE
---Genotype/ Plant Leaf Number of Grain Biological 1000 grain Harvest
treatment height area spikelets yield yield weight index
(cm) (cm2 plant-1) (ear-1) (g plant-1) (g plant-1) (g) (%)
---C-306
Non stress 86.00±3.70 128.62±5.05 11.83±1.23 4.87±0.29 12.70±1.43 34.87±2.18 38.31±2.65 Water stress 62.61±3.21 092.86±4.97 08.83±0.98 2.94±0.21 09.43±1.23 27.35±1.78 31.18±2.35
HD 2329
Non stress 79.42±3.82 152.03±5.45 13.84±1.11 5.66±0.34 14.47±1.46 29.38±1.94 39.17±2.52 Water stress 50.45±3.04 096.55±4.80 08.34±0.94 2.38±0.23 07.76±1.07 23.13±1.81 30.72±2.43
---(Table 2). Blum et al. (1999) concluded that the
consistent genotypic differences in osmotic adjustment exist among wheat cultivars and those with high osmotic adjustment tended to yield better than lower osmotic adjustment under pre flowering drought.
There was a general reduction in yield and yield
C-306 (Table 3). Thus, it is concluded that higher yield of HD 2329 under non stress conditions might be on account of its higher yield potential. C-306 exhibited higher yield under water stress owing to the existence of drought tolerance mechanism through better management of gas exchange parameters, stomatal regulation, membrane stability, photosynthetic pigments and osmotically active metabolites at critical growth stages, particularly at anthesis stage.
REFERENCES
Arnon, D.I. (1949). Copper enzymes in isolated chloroplast: I. Polyphenol oxidase in Beta vulgaris. Plant Physiol. 24:
1-15.
Barrs, H.D. and Weatherly, P.E. (1992). A re-examination of the relative turgidity techniques for estimating water deficit in leaves. Aust. J. Biol. Sci. 15: 413-428.
Bates, L.S., Waldrenand, R.P. and Teare, I.D. (1973). Rapid determination of free proline for water stress studies.
Plant Soil.39: 205-207.
Bethke, P.C. and Drew, M.C. (1992). Stomatal and non stomatal components to inhibition of photosynthesis in leaves of Capsicum annum during progressive exposure to
NaCl salinity. Plant Physiol. 99: 219-226.
Blum, A., Jingxian, Z. and Nguyen, H.T. (1999). Consistent differences among wheat cultivars in osmotic adjustment and their relationship to plant production.
Field Crop Res. 64: 87-291.
Cornic, G. (2000). Drought stress inhibits photosynthesis by decreasing stomatal aperture – not by affecting ATP synthesis. Trends Plant Sci. 5: 187-188.
Dubois, M., Gilles, K.A., Hamilton, J.K., Robbersand, P.A. and Smith, F. (1956). Colorimetric method for determination of sugars and related substances. Anal. Chem. 28:
350-356.
Fariduddin, Q., Khanam, S., Hasan, S.A., Ali, B., Hayat, S. and Ahmad, A. (2009). Effect of 28-homobrassinolide on the drought stress-induced changes in photosynthesis and antioxidant system of Brassica juncea L. Acta Physiol. Plant. 31: 889-897.
Gregersen, P.L. and Holm, P.B. (2007). Transcriptome analysis
of senescence in the flag leaf of wheat. Plant Biotech. J. 5: 192-206.
Guoth, A., Tari, I., Galle, A., Csiszar, J., Pecsvaradi, A., Cseuz, L. and Erdei, L. (2009). Comparison of the drought stress responses of tolerant and sensitive cultivars during grain filling: changes in flag leaf photosynthetic activity, ABA levels and grain yield. J. Plant Growth Reglulation. 28: 167-176.
Gupta, N.K., Gupta, S. and Kumar, A. (2000). Exogenous cytokinin application increases chlorophyll and cell membrane stability index in wheat (Triticum aestivum
L.). Cereal Res. Comm. 28: 287-291.
Islam, M.S., Srivastava, P.S.L. and Deshmukh, P.S. (1998). Evaluation of screening techniques for drought tolerance in wheat (Triticum aestivum L.). Indian J. Plant Physiol. 3: 197-200.
Ravichanadran, V. and Munsge, H.B. (1999). Response of wheat to moisture stress at critical growth stages. Ann. Plant Physiol. 11: 208-211.
Sairam, R.K., Deshmukh, P.S. and Shukla, D.S. (1997). Tolerance to drought and temperature stress in relation to increased antioxidant enzyme activity in wheat. J. Agron. Crop Sci. 178: 171-177.
Siddique, M.R.B., Hamid, A. and Islam, M.S. (1999). Drought stress effects on photosynthetic rates and leaf gas exchange of wheat. Bot. Bull. Acad. Sin. 40: 141-145.
Sumesh, K.V., Sharma-Natu, P. and Ghildiyal, M.C. (2008). Starch synthase and heat shock proteins in relation to thermal tolerance of developing wheat grains. Biol. Plant. 52: 749-753.
Wahid, A. (2007). Physiological implications of metabolite biosynthesis for net assimilation and heat stress tolerance of sugarcane (Saccharum officinarum)
sprout. J. Plant Res. 120: 219-228.
Yadava, N., Yadav, V.K. and Kumar, A. (1994). Effect of benzyladenine on transpiration, water potential and its components in genotypes of wheat contrasting in drought tolerance. J. Agron. Crop Sci. 173: 61-68.