A Framework to Measure and Improve
Well-Being in Primary Care
Courtney M. Brown, MD, MSc,a,b,cZeina M. Samaan, MD,a,cMona E. Mansour, MD, MS,a,cAllison Glance, MS,b John F. Morehous, MD,aStuart Taylor, MS,bJesse Hawke, PhD,bRobert S. Kahn, MD, MPHa,b,c
abstract
Pediatricians aspire to optimize overall health and development, but there areno comprehensive measures of well-being to guide pediatric primary care redesign. The objective of this article is to describe the Cincinnati Kids Thrive at 5 outcome measure, along with a set of more proximal outcome and process measures, designed to drive system improvement over several years. In this article, we describe a composite measure of “thriving”at age 66 months, using primary care data from the electronic health record. Thriving is defined as immunizations up-to-date, healthy BMI, free of dental pain, normal or corrected vision, normal or corrected hearing, and on track for
communication, literacy, and social-emotional milestones. We discuss key considerations and tradeoffs in developing the measure. We then summarize insights from applying this measure to 9544 patients over 3 years. Baseline rates of thriving were 13% when including all patients and 31% when including only patients with complete data available. Interpretation of results was complicated by missing data in 50% of patients and nonindependent success rates among bundle components. There was considerable enthusiasm among other practices and sectors to learn with us and to measure system performance using time-linked trajectories. We learned to present our data in ways that balanced aspirational long-term or multidisciplinary goal-setting with more easily attainable short-term aims. On the basis of our experience with the Thrive at 5 measure, we discuss future directions and place a broader call to action for pediatricians, researchers, policy makers, and communities.
Thefirst 5 years of life are critical in establishing trajectories for lifelong health.1,2Cognitive, language, and social-emotional development in early childhood are foundational to entering kindergarten with skills for educational success.3Educational achievement, in turn, is linked with health throughout the lifecourse.4
Health care is the only institution with near-universal access to children in the first 5 years. Accordingly, pediatrics has embraced a role in promoting overall health and well-being to ensure school readiness.5–8Well-child care guidelines are comprehensive, expecting
pediatricians to provide
immunizations; address nutrition, development, behavior, vision, and hearing; and link families with dentists.9–11American Academy of Pediatrics policy statements call for pediatricians to assume a larger role in kindergarten readiness, promote high-quality early childhood education (ECE), and mitigate the effects of toxic stress and poverty.6,7,12Despite offering these wide-ranging guidelines, the literature has not included
a framework for measuring
pediatricians’effectiveness in efforts to comprehensively promote well-being.
a
Division of General and Community Pediatrics andbJames M. Anderson Center for Health Systems Excellence, Cincinnati Children’s Hospital Medical Center, Cincinnati, Ohio; andcDepartment of Pediatrics, University of
Cincinnati, Cincinnati, Ohio
Dr Brown designed and conceptualized the study and measures, analyzed the data, drafted and revised the manuscript, and submitted thefinal manuscript; Drs Samaan, Mansour, Morehous, and Kahn designed and conceptualized the study and measures, analyzed the data, and reviewed and revised the manuscript; and Ms Glance, Mr Taylor, and Dr Hawke designed the study measures, retrieved and analyzed the data, and reviewed and revised the manuscript; and all authors approved thefinal manuscript as submitted.
Dr Brown’s current affiliations are Division of Primary Care, Nationwide Children’s Hospital, Columbus, Ohio and Department of Pediatrics, College of Medicine, The Ohio State University, Columbus, Ohio.
DOI:https://doi.org/10.1542/peds.2019-1531
Accepted for publication Oct 7, 2019
Address correspondence to Courtney M. Brown, MD, MSc, Division of Primary Care, Nationwide Children’s Hospital, Livingston Ambulatory Center, 5th Floor, 380 Butterfly Gardens Drive, Columbus, OH 43215. E-mail: [email protected]
PEDIATRICS (ISSN Numbers: Print, 0031-4005; Online, 1098-4275).
Copyright © 2020 by the American Academy of Pediatrics
FINANCIAL DISCLOSURE:The authors have indicated they have nofinancial relationships relevant to this article to disclose.
FUNDING:Supported by the Cincinnati Children’s Hospital Medical Center through the All Children Thrive Community Health initiative.
POTENTIAL CONFLICT OF INTEREST:The authors have indicated they have no potential conflicts of interest to disclose.
Measurement is essential for improvement.13Yet, the typical pediatrician has no way of knowing what percentage of their 5-year-old patients are healthy and ready for kindergarten. Well-child care quality is typically measured by processes (eg, developmental screening rate14) or by usage outcomes (eg, well visit attendance15). Providers often measure and report quality metrics chosen by payers, which focus on health care–based processes that drive costs. However, modern well-child care aspires to broadly optimize health and development.7
Workgroups are exploring Medicaid quality metrics to incentivize health
care providers to promote school readiness, but this concept has not been operationalized in clinical care settings.16–18There currently are no clinical measures to track overall child well-being in primary care (PC). Such metrics could help pediatricians evaluate the care they deliver and drive health care redesign to achieve healthier, more school-ready patient populations.
The objective of this article is to describe the Cincinnati Kids Thrive at 5 (T@5) outcome measure, along with a set of proximal outcome and process measures, developed to drive a multiyear improvement initiative in
overall health and well-being at the time of kindergarten entry in a low-income, urban PC patient population. This PC initiative takes place in the context of the All Children Thrive (ACT) Learning Network,
a multisector effort to make
Cincinnati the healthiest place in the nation for children to grow up.19In this article, we describe the
development and implementation of our measurement system and share 2 years of outcome data from our patient population. We discuss what we have learned about the benefits and limitations of the T@5 measure and implications for system
improvement and research.
TABLE 1Components of Cincinnati Kids T@5 66-Month Outcome Measure
School Readiness Domain
T@5 Clinical Metrics Definition of Passinga Commentb
Physical well-being
Immunizations up-to-date
5 DTaP, 4 polio, 2 MMR, 2 varicella, 3 hepatitis B vaccinesc
We included vaccines administered at our clinics or historical immunizations entered into Epic.
Healthy BMI BMI between third and 85th percentile20 Height and wt are measured and recorded in the EHR by medical assistants or nurses at all visits (well and ill). The BMI is automatically calculated within the EHR. Free of dental pain Parent answered“no”to the following question:“In
the past 2 mo, has your child had pain in the teeth, mouth, or jaws?”
This question was adapted from the Early Childhood Oral Health Impact Scale.21Nurses or medical assistants ask parents this question verbally at every well-child visit (age 2–5 y) and record the answer in the EHR.
Normal or corrected vision
Normal vision screen in PC: LEA eye chart results: 20/20, 20/25, 20/30, or 20/40 in both left and right eye or normal spot vision test
Vision screening is performed by nurses or medical assistants annually at well-child visits beginning at age 3 y. LEA eye chart was used until 2016, then our clinics began testing using spot vision screener equipment. Children with corrective lenses are still screened with LEA. The staff member performing the test records the result in the EHR. Normal or corrected
hearing
Normal hearing screen in PC (defined as hearing 20 dB at 1000, 2000, and 4000 Hz) or normal hearing testing in audiology
Hearing screening is performed annually at well-child visits beginning at age 4 y. Hearing screening was performed using audiometer until 2018, then our clinics began using EarScan 3. The staff member performing the test records the result in the EHR.
Language development
Meeting communication milestones
Passing the Communication domain on the ASQ-322,23 ASQ-3 is administered on paper at the 4-y well visit. Nurses or providers enter results into the EHR.
Meeting literacy milestones
Score of 7 or higher on 5-question version of the GRTR-R screener24
The GRTR-R is administered verbally by nurses or medical assistants at the 4-y well visit, responses were recorded in the EHR, and summary scores were automatically calculated within the EHR.
Social-emotional well-being
Meeting social-emotional milestones
Passing score on the ASQ:SE25,26or Total Difficulties score is“Close to Average”or“Slightly Raised”on the SDQ27
ASQ:SE or SDQ is administered on paper or electronic tablets at the 3- and 5-y well-child visits. Nurses or providers enter results from paper screeners into the EHR. Electronic screening results are automatically imported into the EHR.
ASQ-3, Ages and Stages Questionnaire–3; ASQ:SE, Ages and Stages Questionnaire: Social-Emotional; DTaP, diphtheria, tetanus, acellular pertussis; GRTR-R, Get Ready to Read–Revised; MMR, measles, mumps, rubella; SDQ, Strengths and Difficulties Questionnaire.
aFor all bundle components except social-emotional milestones, we used the most-recent documented result and required a result in the last 18 mo. We accepted social-emotional
screening results from 36 to 66 mo because we only performed this screen at the 3-y-old and 5-y-old well-child visits.
bThese screens were part of routine child care before T@5 measure development, except dental screening and literacy screening. Dental and literacy screening were added to
well-child visits in July 2016.
DESCRIPTION OF THE T@5 MEASUREMENT SYSTEM
Description of the Cincinnati Kids T@ 5 Outcome Measure
We chose to measure“thriving”as a comprehensive, all-or-none bundle measure (Table 1). To be designated as“thriving,”children had to meet all of the following criteria at 66 months of age: immunizations up-to-date, healthy BMI, free of dental pain, normal or corrected vision, normal or corrected hearing, and on track for communication, literacy, and social-emotional milestones. These data elements were all recorded in the electronic health record (EHR) during routine well-child care.
Bundle measures are used in quality improvement (QI) because they align with the interests of individual patients and drive an integrated, system-wide response.28In
a traditional hospital-based example, each patient wants their entire hospitalization to be free of medical errors, not just their interactions with 3 out of 4 hospital units. To achieve that, multiple parts of the system must work together efficiently. In the case of our measure, each parent wants their child to enter kindergarten with no aspect of their health or
development interfering with their ability to learn. To achieve this, multiple sectors (eg, health care, ECE, family supports) need to work well together. For these reasons, we saw value in using a bundle measure, rather than measuring each
construct separately or assigning children a“thriving score.” In deciding which components to include in the measure, we reviewed the literature on factors affecting school performance.29–32We sought to include metrics that aligned with school readiness measures used by policy makers and educators.33,34We reasoned this approach could drive PC redesign and local multisector initiatives, in concert with larger, systemic efforts to monitor and improve population-level health and school readiness. We leveraged the infrastructure of the ACT Learning Network to solicit brief, ongoing feedback from local stakeholders on the definition of a“thriving child.”In an initial design phase, 24 parents were interviewed about their priorities for children’s health in their communities. Subsequently, groups of.200 parents, health care providers, and community service providers met for biannual learning sessions. T@5 data were also reviewed in multiple weekly or
monthly meetings that included parents, providers, and community service providers. Additional feedback was solicited from front-line PC staff at monthly staff meetings.
We included metrics that
represented domains measured by the Early Development Index, used in Australia and Canada for population-level monitoring of kindergarten readiness.33These include physical health, emotional maturity, social competence, language and cognitive skills, and communication and general knowledge. Similar domains are described in an American Academy of Pediatrics policy statement on school readiness7and the Maternal Child Health Bureau’s“Healthy and Ready to Learn”measure.35
Description of Proximal Measures to Drive Improvement and Assess Progress
The T@5 bundled outcome measure provides monthly snapshots of the patient population reaching 66 months of age, and it allows a system to set quantitative long-term goals to address early childhood determinants of lifelong health. However, it is influenced by too many factors over too much time to drive day-to-day or month-to-month QI. For
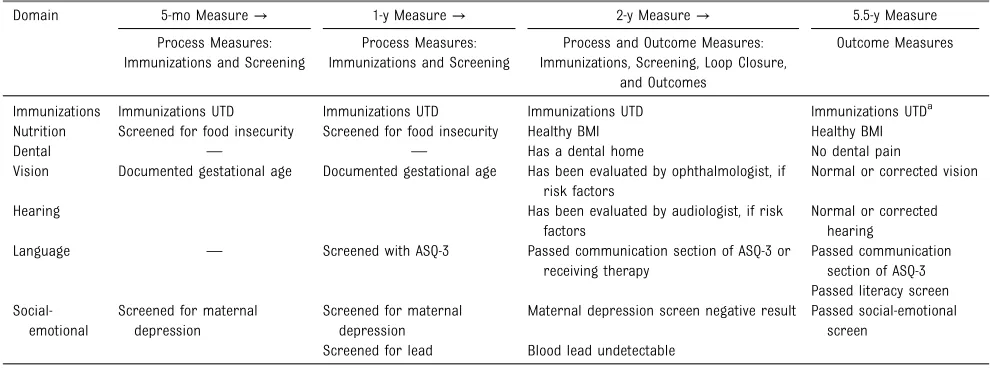
TABLE 2Trajectories of Measures to Drive Improvement in Thriving
Domain 5-mo Measure→ 1-y Measure→ 2-y Measure→ 5.5-y Measure
Process Measures: Immunizations and Screening
Process Measures: Immunizations and Screening
Process and Outcome Measures: Immunizations, Screening, Loop Closure,
and Outcomes
Outcome Measures
Immunizations Immunizations UTD Immunizations UTD Immunizations UTD Immunizations UTDa
Nutrition Screened for food insecurity Screened for food insecurity Healthy BMI Healthy BMI
Dental — — Has a dental home No dental pain
Vision Documented gestational age Documented gestational age Has been evaluated by ophthalmologist, if risk factors
Normal or corrected vision
Hearing Has been evaluated by audiologist, if risk
factors
Normal or corrected hearing
Language — Screened with ASQ-3 Passed communication section of ASQ-3 or
receiving therapy
Passed communication section of ASQ-3 Passed literacy screen
Social-emotional
Screened for maternal depression
Screened for maternal depression
Maternal depression screen negative result Passed social-emotional screen
Screened for lead Blood lead undetectable
ASQ-3, Ages and Stages Questionnaire–3; UTD, up-to-date;—, not applicable.
this reason, we built a theory of change for improving this comprehensive outcome measure from infancy forward. We developed additional measures that were more proximal or process oriented to serve as earlier indicators of progress (Table 2). This approach allowed us to examine system performance along a time-linked trajectory, with a plan to identify threats to school readiness earlier and intervene. Although specific interventions are beyond the scope of this article, we have included a simplified key driver diagram (Fig 1) to illustrate the rationale for our proximal measures. Table 2 does not include measures for every driver of thriving at 5. We began with a smaller number of measures that were driven primarily by the health care system and were feasible to track, with the intention of adding measures and goals as the work progressed. We developed a Thrive at 2 bundle measure to indicate whether the patient population at age 2 was“on track”to thrive at age 5. This allowed improvement work to
focus on thefirst 2 years of life (when impact on school readiness may be greatest), without having to wait several years to assess impact. We also tracked bundle measures of preventive service delivery in infancy,36,37and we developed process measures that were much narrower in scope as annual QI goals (eg, percentage of patients receiving protocol-adherent care for elevated lead levels38).
Population
We collected data from EHRs of 5 PC centers affiliated with Cincinnati Children’s Hospital Medical Center. These centers serve 35 000 patients (85% Medicaid, 10% uninsured; 67% African American, 3% Hispanic). Hardships such as food insecurity, unstable housing, or domestic violence are reported by 30% of patients.39Patients included in our denominator were those turning 66 months old who had at least 1 visit in the past 2 years and no evidence of transferring care to another PC provider.
Analysis
We applied the T@5 outcome measure to monthly cohorts of children in our patient population. Retrospective data (January 1, 2015 to June 30, 2016) were plotted on a control chart. In July 2016, we began tracking the measure prospectively. In this article, we discuss the T@5 measure based on analyses of 9544 total children who turned 66 months old between January 1, 2015 and September 30, 2018. This work was part of a broader PC redesign project that was determined institutional review board exempt.
KEY CONSIDERATIONS IN DEVELOPING THE T@5 OUTCOME MEASURE
Outcome Versus Process Measures
Most health care QI initiatives measure care delivery (eg screening performed, medication prescribed). We sought instead to measure actual child health outcomes. Outcomes are meaningful to children and their families and drive long-term costs.
FIGURE 1
Also, by measuring outcomes rather than processes, we challenged improvement teams to apply strategies beyond existing clinical care practices. For example, in attempting to improve language development, there is not strong evidence that the traditional screen-refer-treat pathway is effective or feasible for all families.40,41
Therefore, achieving goals related to the processes of screening and referral may not result in improved outcomes. When the goal is the percentage of children meeting communication milestones, improvement teams can test more innovative strategies, such as assisting with enrollment in high-quality child care. Although family well-being and parenting behavior are critical to child development, we included only child-level metrics in our 66-month outcome measure. We classified family- and community-level factors as drivers of thriving (see Fig 1). Measurement and improvement of family- and
community-level factors require more coordination with other disciplines than child-level factors. While beginning work on child-level factors, ACT has begun forging community partnerships and developing measures and interventions to address family well-being and social determinants of health. Our measure was designed for the health care setting, and we acknowledge that it does not encompass the entirety of school readiness.
Patient Population-Level Versus Visit-Level Reporting
We chose to report outcomes on the level of the patient population rather than the visit. This decision ensured patients were not excluded from the denominator if they missed a well visit. Missed well-child care has been associated with social hardships that could also negatively affect school readiness and health.42Patient population-level reporting also allowed us to include data from
multiple visits for each patient. Because the unit of analysis was the child (not the care provided at a particular visit), we could consider system designs that address different aspects of health and development at different visits. Finally, our long-term goal is to bring together each PC system’s patient population-level data into a city-wide population-level measure.
Multisector-Dependent Versus Health Care–Driven Outcomes
Child development is longitudinal and influenced by many factors that are outside the health care system’s control. Our measure is the outcome of all of a child’s care and experiences over the first 5 years of life, not just their health care. We recognized we could not change this outcome
independently. In the interest of setting aspirational goals and driving whole-system transformation, we committed to partnering with other sectors to work toward improving outcomes that matter to children and families.
Clinical Data From Everyone Versus Research Data From a Sample
We chose to use clinical data from all children in our patient population, rather than conducting a research study with a sample. This ensured every child was represented because those who participate in research may be different from those who do not. For practical purposes, we chose indicators that were feasible to collect during well visits, rather than lengthy scales. We used validated tools intended for PC use (eg, Ages and Stages Questionnaire22,23) when possible. We opted for usefulness in driving improvement, rather than perfection in measuring school readiness. We acknowledged the limitations of clinical data, including that questions may not be asked in a standardized way, and screening
tools (designed for high sensitivity) are likely to have false-positives.
Flexibility Versus Rigidity in Operational Definitions
Because we used clinical data, we neededflexibility in operational definitions. Our measurement system needed to adapt to inevitable changes in clinical operations over time. For example, when some clinics began using different
social-emotional screening tools, the code behind the measure was amended to allow either screen to count toward the bundle result. Although this meant we were not comparing
“apples to apples” over time, it was a necessary feature of a complicated clinical measure.
Useful for Most Versus Perfect for All
We considered including other components in the measure (eg, motor delay, pain from chronic disease) but ultimately omitted them for parsimony or because they would only apply to subpopulations. We recognized the measure was not appropriate for children with medical complexity or certain developmental disorders. For example, it is unrealistic to expect a child with autism to pass an age-appropriate social-emotional screen. Segmenting the population and measuring optimal well-being for subpopulations will be important future work. In the current iteration, we applied the T@5 metric to our patient population without exclusions. We suspected there was huge room for improvement among children who could biologically reach our definition of thriving, and we did not want to delay this new effort while we carefully considered how to parse the patient population. A recent
Pediatricsarticle describes domains of health for children with medical complexity and could be
T@5 IN OUR PATIENT POPULATION: INITIAL INSIGHTS
Baseline Rates of Thriving Were Low
The percentage of patients who were thriving based on our 66-month T@5 outcome measure was, at baseline, very low (mean 13%), as shown in Figure 2. The mean pass rate for the Thrive at 2 bundle measure was even lower (8%). Through previous QI work, our PC system has achieved high reliability in delivering preventive services at the visit level.37Low rates of thriving illustrate that reliable delivery of
select preventive services does not necessarily equal improved outcomes and that the system’s current performance is insufficient to ensure healthy, school-ready children. Although it is already known that health care is less influential than social determinants of health, tracking this data in our own patient population created a sense of urgency and purpose around redesigning our care system. These outcome
measures engaged health care providers and community members and helped launch strategic improvement efforts.
We considered possible explanations for the low baseline rate of thriving. First, there were missing data (discussed in the next section). Second, the low percentage of thriving children may reflect true deficits in well-being among low-income children because poverty has deleterious effects on health and development.44Third, we considered the possibility that poor performance on 1 or 2 bundle components was dragging down overall bundle performance in the population. However, when excluding BMI from the bundle (the most commonly failed
FIGURE 2
component), the baseline rate of thriving rose to just 22%. Fourth, we considered the validity of the measure. Because this type of bundled clinical measure has not been developed before, we cannot compare ourfindings to others in the literature. A study in which
researchers compare this health care–based metric with kindergarten readiness assessments conducted in the education sector could be used to help assess validity of this measure. The results of focused improvement projects are beyond the scope of this article and will be published separately. We would not yet expect changes in the T@5 outcome measure given the decisions to focus initial QI work on younger children and the narrow scope of early improvement efforts. For example, interventions targeting infants would not be reflected in the T@5 measure until 4.5 years later.
Missing Data Complicated Interpretation of Findings
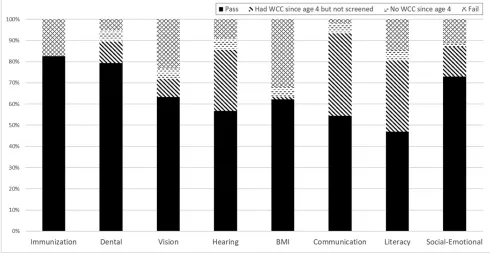
In Figure 3, we categorize the results for each bundle component into the
percentage of children who (1) passed, (2) had missing data due to missing a well visit, (3) had missing data despite attending a well visit, or (4) had a documented value that did not meet criteria for thriving (ie, actually measured as unhealthy). From June 1, 2016 to September 30, 2018, only 50% of patients had complete data. Because missing data were unlikely to be missing at random, we did not impute data. The large amount of missing data was worrisome and showed us we would need to vastly improve both attendance at well visits and our own screening and
documentation processes before the T@5 outcome measure could accurately estimate the well-being of our patient population. The missing data also indicated opportunity for improving health system performance in ways that increase the value families ascribe to attending well visits and completing screenings. We expect most PC practices would have missing data given well-documented challenges related to screening and well visit attendance.45
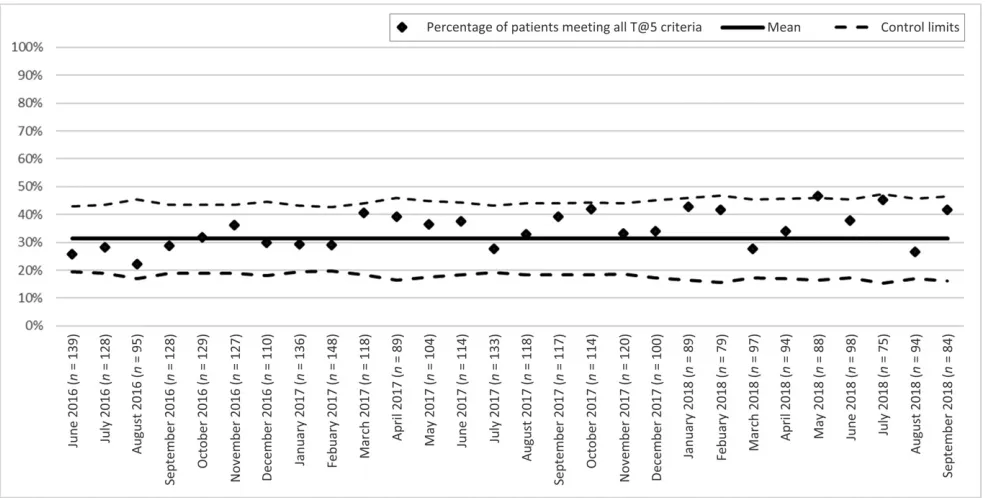
Because a large percentage of failures on individual components were due to missing data, we also examined the T@5 outcome measure excluding any patient with missing data for any component of the bundle (Fig 4). The mean was 31%, which we found surprisingly low. Missing data were unlikely to be missing at random; therefore, this statistic may not represent the rate of thriving that would be observed if all patients had complete data.
Our measure gave equal weight to all bundle components and also equally weighted failed screens and missing screens. In reality, different reasons for“failing”the measure probably affect school readiness to different degrees. This is a limitation, and a more-complex weighting scheme may be warranted in future work.
Bundle Components Are Not Independent
We expected some bundle
components would be correlated with one another, and failures of individual components would cluster in the same children. For example, a child with
FIGURE 3
hearing loss would be likely to have communication delay,46and children who had missed well visits would have missing data for multiple bundle components. In fact, of children who failed the bundle, 65% failed on$2 components. Bivariate correlation analyses revealed that almost all combinations of bundle components were correlated at a statistically significant level, although effect size for many of these correlations was small. These correlations rendered typical QI strategies for problem-solving and goal-setting (such as examining the frequency of failed components and targeting
components with the highest failure rates) less effective. Instead, more fundamental shifts in care delivery and more intense focus on underlying drivers of health and development may be needed to improve the well-being of a whole child.
Psychological Challenges of a Broad Measure With Slow Change Must be Managed Thoughtfully
Although we developed proximal measures and concrete QI goals, our
T@5 outcome measure was demoralizing to some health care providers because it was slow to change and dependent on factors outside the health care system. This feedback was provided at ACT meetings described above. As suggested by Schor,47it can be useful to categorize outcomes as those for which health care providers should be held accountable and those toward which they should contribute. Accordingly, we tested displaying data this way at our workgroup meetings, emphasizing the components of thriving that could be corrected quickly through traditional health care services (eg, by prescribing glasses) over those that would take months to years to see results and may require more innovative, multidisciplinary solutions (eg, by starting language therapy). This approach helped guide the development of both short- and long-term improvement strategies.
We Recruited Other Practices to Learn With Us
To achieve true population health, we must measure and improve
well-being across an entire community, not just our patient population. We began a T@5 learning collaborative with other local PC practices. Initially, each practice chose a feasible goal that aligned with some piece of T@5. We expect this learning collaborative will help us learn faster about both measurement and improvement. We found that 23% of our patient population at age 2 years left the patient population by age 5.5 years, and 13% of the patient population at age 5.5 years had not been part of the patient population at age 2. This underscores the idea that high-quality care from birth at a few PC practices is insufficient to improve our outcome measure at age 5.5 years. We need to study the mobility of our patient population further to
understand what percentage of families are transferring to other local practices, moving in and out of the geographic area, or failing to obtain health care at all after age 3 years. However, an entire network of practices committing to the principles behind T@5 could expose children to relevant interventions when they FIGURE 4
transfer care among local practices. A standardized“school readiness visit” at age 4 or 5 could help address problems before kindergarten entry, despite discontinuity in PC.
FUTURE DIRECTIONS AND CALLS TO ACTION
The Need to Consider the Validity of Clinically Collected Data
The T@5 measure uses clinically collected data and is therefore uniquely applicable to clinical QI. However, there are practical constraints on screening and data collection in a fast-paced clinical setting. Parents supervising children in the waiting room may skip or misread screening questions. Intake staff may not ask questions in the highly standardized way that would be expected in a research study. For the sake of both providing good clinical care and better QI measurement, there is a need to introduce greater rigor to clinical data collection methods or eliminate screening practices that have questionable validity in favor of acquiring data from other sectors that assess similar constructs in more robust ways. For example, ECE settings often evaluate development through direct assessment and include strength-based domains.
The Need to Share Data and Accountability for Outcomes Across Sectors
An early childhood environment in which all children thrive can only be achieved through a well-coordinated multisector effort. Peterson et al48 recently summarized opportunities for health care education
collaboration and the potential utility of sharing data. Shared data systems between PC and preschools could partially resolve problems with missing data and eliminate duplicate screenings in 2 environments (eg, bidirectional sharing of vision and hearing screen results). In addition, data sharing could address
limitations of clinically collected data and assess family- and community-level indicators of school readiness. Communities could achieve a more-accurate and comprehensive understanding of population-level school readiness by using health care–based measures in conjunction with traditional epidemiological data and data collected in other sectors (eg, social services). Furthermore, as evidenced by the correlations among bundle components, systemic changes that address the needs of the whole family and child are likely needed to substantially improve the percentage of children who are thriving. This will require engagement from families and professionals across the entire early childhood system, including shared assessments and shared care plans.
The Need to Manage the Psychology of Change When Tracking Long-Term Outcomes
When tracking a long-term outcome measure, the psychology of change must be managed carefully. Small successes must be celebrated.49 Short-term and long-term plans must always be kept in view, and those plans must be malleable. Locally, we are revisiting our theory of
improvement, developing additional process measures and prioritizing measures that are most health care sensitive, while simultaneously accelerating our work with community partners. We anticipate this strategy will keep teams
motivated and drive improvement on a shorter timescale.49
The Need to Enhance Population Management Capabilities of EHRs
We recognize our institution’s resources for data programming and retrieval are not available to the typical practice. EHRs’registry functions should be expanded to make complex measurement more widely accessible and enhance population management capabilities around pediatric well care outcomes.
EHRs have been used to manage health outcomes for registries of patients with chronic conditions. Managing school readiness could be approached similarly. This would allow thriving to be tracked with fewer institutional resources and would facilitate learning
collaboratives in which practices from different health care systems work to improve similar measures.
CONCLUSIONS
In conclusion, we developed the Cincinnati Kids T@5 measure, using clinical EHR data, to drive
a multiyear, multisector children’s health initiative. We discovered low baseline rates of thriving in our patient population, and we identified challenges with this measurement system, including missing data and interdependence of bundle
components. In our attempts to take a long view of system improvement and examine trajectories of measures over time, we learned that managing team psychology requires a delicate balance between short-term and long-term priorities. Moving forward, school readiness
ACKNOWLEDGMENTS
We thank Drs Megan Bair-Merritt, Tina Cheng, and Charles Homer for reading and providing feedback on a draft of this article.
ABBREVIATIONS
ACT: All Children Thrive ECE: early childhood education EHR: electronic health record PC: primary care
QI: quality improvement T@5: Thrive at 5
REFERENCES
1. Heckman JJ. Skill formation and the economics of investing in
disadvantaged children.Science. 2006; 312(5782):1900–1902
2. Pagani LS, Fitzpatrick C. Children’s school readiness: implications for eliminating future disparities in health and education.Health Educ Behav. 2014; 41(1):25–33
3. Knudsen EI, Heckman JJ, Cameron JL, Shonkoff JP. Economic, neurobiological, and behavioral perspectives on building America’s future workforce. Proc Natl Acad Sci USA. 2006;103(27): 10155–10162
4. Olshansky SJ, Antonucci T, Berkman L, et al. Differences in life expectancy due to race and educational differences are widening, and many may not catch up. Health Aff (Millwood). 2012;31(8): 1803–1813
5. High PC; American Academy of Pediatrics Committee on Early Childhood, Adoption, and Dependent Care and Council on School Health. School readiness.Pediatrics. 2008; 121(4). Available at: www.pediatrics. org/cgi/content/full/121/4/e1008
6. Garner AS, Shonkoff JP; Committee on Psychosocial Aspects of Child and Family Health; Committee on Early Childhood, Adoption, and Dependent Care; Section on Developmental and Behavioral Pediatrics. Early childhood adversity, toxic stress, and the role of the pediatrician: translating
developmental science into lifelong health.Pediatrics. 2012;129(1).
Available at: www.pediatrics.org/cgi/ content/full/129/1/e224
7. Council on Early Childhood; Council on School Health. The pediatrician’s role in optimizing school readiness.Pediatrics. 2016;138(3):e20162293
8. Schor EL, Abrams M, Shea K. Medicaid: health promotion and disease prevention for school readiness.Health Aff (Millwood). 2007;26(2):420–429
9. Simon GR, Baker C, Barden GA III, et al; Committee on Practice and Ambulatory Medicine; Bright Futures Periodicity Schedule Workgroup. 2014 recommendations for pediatric preventive health care.Pediatrics. 2014; 133(3):568–570
10. Duby JC. Early childhood behavioral health: can the medical neighborhood move us forward?Pediatrics. 2018; 141(5):e20180156
11. Coker TR, Moreno C, Shekelle PG, Schuster MA, Chung PJ. Well-child care clinical practice redesign for serving low-income children.Pediatrics. 2014; 134(1). Available at: www.pediatrics. org/cgi/content/full/134/1/e229
12. American Academy of Pediatrics Committee on Early Childhood, Adoption, and Dependent Care. . Quality early education and child care from birth to kindergarten.Pediatrics. 2005; 115(1):187–191
13. Berwick DM, James B, Coye MJ. Connections between quality measurement and improvement.Med Care. 2003;41(suppl 1):I30–I38
14. Earls MF, Hay SS. Setting the stage for success: implementation of
developmental and behavioral screening and surveillance in primary care practice–the North Carolina Assuring Better Child Health and Development (ABCD) Project.Pediatrics. 2006;118(1). Available at: www. pediatrics.org/cgi/content/full/118/1/ e183
15. Thompson JW, Ryan KW, Pinidiya SD, Bost JE. Quality of care for children in commercial and Medicaid managed care.JAMA. 2003;290(11):1486–1493
16. Howard C, Homer C, Gillooly M, Vinci RJ, Bair-Merritt MH. School readiness: the next essential quality metric for children.Health Affairs Blog. July 18, 2018. Available at: https://www.
healthaffairs.org/do/10.1377/ hblog20180711.857544/full/. Accessed April 10, 2019
17. New York State Department of Health. First 1000 days on Medicaid initiative. 2017. Available at: https://www.health. ny.gov/health_care/medicaid/redesign/
first_1000.htm. Accessed April 10, 2019
18. Oregon Pediatric Improvement Partnership. Using kindergarten readiness as an accountability metric for coordinated care organizations in Oregon. Available at: www.oregon-pip.o rg/Issue%20Brief%20-%20Kindergarten %20Readiness%20Accountability%20Fi nal.pdf. Accessed April 10, 2019
19. Kahn RS, Iyer SB, Kotagal UR.
Development of a child health learning network to improve population health outcomes; presented in honor of Dr Robert Haggerty.Acad Pediatr. 2017; 17(6):607–613
20. Barlow SE; Expert Committee. Expert committee recommendations regarding the prevention, assessment, and treatment of child and adolescent overweight and obesity: summary report.Pediatrics. 2007;120(suppl 4): S164–S192
21. Pahel BT, Rozier RG, Slade GD. Parental perceptions of children’s oral health: the Early Childhood Oral Health Impact Scale (ECOHIS).Health Qual Life Outcomes. 2007;5:6
22. Brookes Publishing Co. ASQ-3. Available at: https://brookespublishing.com/ product/asq-3/. Accessed April 24, 2019
23. Squires J, Bricker D, Potter L. Revision of a parent-completed development screening tool: Ages and Stages Questionnaires.J Pediatr Psychol. 1997; 22(3):313–328
24. Iyer SN, Sawyer MI, Germany M, Super DM, Needlman RD. Development of a 5-item parent questionnaire to screen preschool children for reading problems.Clin Pediatr (Phila). 2014; 53(6):571–578
25. Brookes Publishing Co. ASQ:SE-2. Available at: https://brookespublishing. com/product/asqse-2/. Accessed April 24, 2019
asq-se-technical-report.pdf. Accessed April 24, 2019
27. Goodman R. Psychometric properties of the strengths and difficulties
questionnaire.J Am Acad Child Adolesc Psychiatry. 2001;40(11):1337–1345
28. Nolan T, Berwick DM. All-or-none measurement raises the bar on performance.JAMA. 2006;295(10): 1168–1170
29. Taras H. Nutrition and student performance at school.J Sch Health. 2005;75(6):199–213
30. Jackson SL, Vann WF Jr, Kotch JB, Pahel BT, Lee JY. Impact of poor oral health on children’s school attendance and performance.Am J Public Health. 2011; 101(10):1900–1906
31. Schoon I, Parsons S, Rush R, Law J. Children’s language ability and psychosocial development: a 29-year follow-up study.Pediatrics. 2010;126(1). Available at: www.pediatrics.org/cgi/ content/full/126/1/e73
32. Zins JE, Bloodworth MR, Weissberg RP, Walberg HJ. The scientific base linking social and emotional learning to school success.J Educ Psychol Consult. 2007; 17(2–3):191–210
33. Brinkman SA, Gregory TA, Goldfeld S, Lynch JW, Hardy M. Data resource profile: the Australian early development index (AEDI).Int J Epidemiol. 2014;43(4):1089–1096
34. Schachter RE, Strang TM, Piasta SB. Teachers’experiences with a state-mandated kindergarten readiness assessment.Int Res J. 2017; 39(1):80–96
35. Child Trends. Kindergarten readiness national outcome measure. Available at: https://www.childtrends.org/project/
kindergarten-readiness-national-outcome-measure. Accessed April 23, 2019
36. Brown CM, Samaan ZM, Morehous JF, Perkins AA, Kahn RS, Mansour ME. Development of a bundle measure for preventive service delivery to infants in primary care.J Eval Clin Pract. 2015; 21(4):642–648
37. Samaan ZM, Brown CM, Morehous J, Perkins AA, Kahn RS, Mansour ME. Implementation of a preventive services bundle in academic pediatric primary care centers.Pediatrics. 2016;137(3): e20143136
38. Brown CM, Samaan ZM, Glance A, Haering A, Steele B, Newman N. Standardizing clinical response to results of lead screening: a quality improvement study.Pediatrics. 2019; 143(6):e20183085
39. Beck AF, Klein MD, Kahn RS. Identifying social risk via a clinical social history embedded in the electronic health record.Clin Pediatr (Phila). 2012;51(10): 972–977
40. Siu AL; US Preventive Services Task Force. Screening for speech and language delay and disorders in children aged 5 years or younger: US preventive services task force recommendation statement.Pediatrics. 2015;136(2). Available at: www. pediatrics.org/cgi/content/full/136/2/ e474
41. Brown CM, Beck AF, Steuerwald W, et al. Narrowing care gaps for early language delay: a quality improvement study.Clin Pediatr (Phila). 2016;55(2): 137–144
42. Van Berckelaer AC, Mitra N, Pati S. Predictors of well child care adherence
over time in a cohort of urban Medicaid-eligible infants.BMC Pediatr. 2011;11(1):36
43. Barnert ES, Coller RJ, Nelson BB, et al. A healthy life for a child with medical complexity: 10 domains for
conceptualizing health.Pediatrics. 2018; 142(3):e20180779
44. Rosenberg SA, Zhang D, Robinson CC. Prevalence of developmental delays and participation in early intervention services for young children.Pediatrics. 2008;121(6). Available at: www. pediatrics.org/cgi/content/full/121/6/ e1503
45. King TM, Tandon SD, Macias MM, et al. Implementing developmental screening and referrals: lessons learned from a national project.Pediatrics. 2010; 125(2):350–360
46. Lieu JEC, Tye-Murray N, Karzon RK, Piccirillo JF. Unilateral hearing loss is associated with worse speech-language scores in children. Pediatrics. 2010;125(6). Available at: www.pediatrics.org/cgi/content/full/ 125/6/e1348
47. Schor EL. The future pediatrician: promoting children’s health and development.J Pediatr. 2007;151(suppl 5):S11–S16
48. Peterson JW, Loeb S, Chamberlain LJ. The intersection of health and education to address school readiness of all children.Pediatrics. 2018;142(5): e20181126
DOI: 10.1542/peds.2019-1531 originally published online December 18, 2019;
2020;145;
Pediatrics
Morehous, Stuart Taylor, Jesse Hawke and Robert S. Kahn
Courtney M. Brown, Zeina M. Samaan, Mona E. Mansour, Allison Glance, John F.
A Framework to Measure and Improve Well-Being in Primary Care
Services
Updated Information &
http://pediatrics.aappublications.org/content/145/1/e20191531
including high resolution figures, can be found at:
References
http://pediatrics.aappublications.org/content/145/1/e20191531#BIBL
This article cites 33 articles, 14 of which you can access for free at:
Subspecialty Collections
_sub
http://www.aappublications.org/cgi/collection/system-based_practice
System-Based Practice
e_management_sub
http://www.aappublications.org/cgi/collection/administration:practic
Administration/Practice Management
_sub
http://www.aappublications.org/cgi/collection/community_pediatrics
Community Pediatrics following collection(s):
This article, along with others on similar topics, appears in the
Permissions & Licensing
http://www.aappublications.org/site/misc/Permissions.xhtml
in its entirety can be found online at:
Information about reproducing this article in parts (figures, tables) or
Reprints
http://www.aappublications.org/site/misc/reprints.xhtml
DOI: 10.1542/peds.2019-1531 originally published online December 18, 2019;
2020;145;
Pediatrics
Morehous, Stuart Taylor, Jesse Hawke and Robert S. Kahn
Courtney M. Brown, Zeina M. Samaan, Mona E. Mansour, Allison Glance, John F.
A Framework to Measure and Improve Well-Being in Primary Care
http://pediatrics.aappublications.org/content/145/1/e20191531
located on the World Wide Web at:
The online version of this article, along with updated information and services, is
by the American Academy of Pediatrics. All rights reserved. Print ISSN: 1073-0397.