RVC OPEN ACCESS REPOSITORY – COPYRIGHT NOTICE
This is the peer-reviewed, manuscript version of the following article:
Gorton, M., Angell, R., Dries, L., Urutyan, V., Jackson, E. and White, J. (2015) 'Power, buyer trustworthiness and supplier performance: Evidence from the Armenian dairy sector',
Industrial Marketing Management, 50, 69-77.
The final version is available online via http://dx.doi.org/10.1016/j.indmarman.2015.05.024. © 2015. This manuscript version is made available under the CC-BY-NC-ND 4.0 license
http://creativecommons.org/licenses/by-nc-nd/4.0/.
The full details of the published version of the article are as follows:
TITLE: Power, buyer trustworthiness and supplier performance: Evidence from the Armenian dairy sector
AUTHORS: Gorton, M., Angell, R., Dries, L., Urutyan, V., Jackson, E. and White, J. JOURNAL TITLE: Industrial Marketing Management
VOLUME/EDITION: 50 PUBLISHER: Elsevier
1
Power, buyer trustworthiness and supplier performance:
evidence from the Armenian dairy sector
Matthew Gorton1, Robert Angell2,Liesbeth Dries3, Vardan Urutyan4, Elizabeth
Jackson5 and John White6
1 Newcastle University Business School, Newcastle University, Newcastle upon
Tyne, UK. matthew.gorton@newcastle.ac.uk
2 Cardiff Business School, Cardiff University, Cardiff, UK. angellrj@Cardiff.ac.uk
3 Wageningen University, The Netherlands. liesbeth.dries@wur.nl
4 ICARE Armenia and Texas A&M University, USA.vardan@icare.am
5 Department of Production & Population Health, Royal Veterinary College,
Hatfield. eljackson@rvc.ac.uk
6 Plymouth Business School, University of Plymouth, Plymouth, UK.
john.white@plymouth.ac.uk
Corresponding author: Dr. Matthew Gorton, Newcastle University Business School, 5 Barrack Road, Newcastle upon Tyne, NE1 4SE. Tel: 01912081576.
Email: matthew.gorton@newcastle.ac.uk
ACKNOWLEDGEMENT
2 Power, buyer trustworthiness and supplier performance: evidence from the
Armenian dairy sector
Abstract
The paper presents a Multiple Indicators and MultIple Causes (MIMIC) model for
explaining the relationships between buyer-seller power, buyer trustworthiness and
supplier satisfaction / performance. The model draws on an organizational supply chain
perspective of power and is verified using data relating to dairy farmers’ relationships
with their main buyer in Armenia. The analysis indicates that buyers are more
trustworthy where there is greater competition for supplies. Buyer trustworthiness is
also positively correlated with both the size of a supplier, as well as a supplier being a
member of a marketing cooperative. Buyer trustworthiness has a positive impact on
suppliers’ satisfaction (regarding their relationship with their main buyer) and enhances
the quality and quantity of suppliers’ output.
Keywords
3 1. Introduction
The nature of buyer-supplier relationships has long been recognized as a factor
influencing business performance. Early work on supply chain management (e.g.
Spekman, 1988, p. 78) regarded collaboration between firms in a supply chain as being
built on a “win-win” model. However, this ignores how asymmetries in power affect
the distribution of outcomes (Hingley, 2005a), particularly in explaining why buyers
and sellers often enter into relationships for which they do not desire long-term mutual
benefits and ‘have no qualms about “win-lose” scenarios’ (Cox, 2004b, p. 411). Power
asymmetry has thus become an important topic within supply chain research (Nyaga,
Lynch, Marshall, & Ambrose, 2013). This recognizes that less powerful actors may be
vulnerable to opportunism with power asymmetry amplifying the potential for conflict
and disaffection (Nyaga et al., 2013).
Previous studies investigate the effect of power asymmetry between buyers and
suppliers on: relationship trust (Handfield & Bechtel, 2002; Kumar, Scheer, &
Steenkamp, 1995), relationship strength (Maloni & Benton, 2000), relationship
orientation (Ganesan, 1994), supplier responsiveness (Handfield & Bechtel, 2002),
supplier performance (Benton & Maloni, 2005), and relationship satisfaction (Benton
& Maloni, 2005). Such studies typically consider the relationships between a small
number of variables / constructs with single measures of power asymmetry so that
‘future research could develop a more in-depth assessment of power asymmetry
measures and examine how perceptions of power use and their implications differ at
different levels of asymmetry’ (Nyaga et al., 2013, pp. 59-60). The first contribution of
this paper is thus to introduce a more comprehensive model, incorporating five
4
and supplier performance. For this a Multiple Indicators and MultIple Causes (MIMIC)
model is developed and verified using data on Armenian milk producers’ (farms)
relationships with their main buyer (e.g. dairy processors). MIMIC models, which are
underutilized in the literature on buyer-supplier relationships, are suited to this task
(Diamantopoulos, Riefler, & Roth, 2008), including, in this case, a set of manifest
(directly observable) variables (measures of buyer-supplier power) which impact on a
latent variable (trust), which, in turn, impacts on another set of manifest variables
(satisfaction and supplier performance).
While numerous studies acknowledge asymmetric power in contemporary
supply chains, there is less agreement on what should be the response of the actors
concerned and policy makers. One viewpoint is that weaker partners have to accept and
learn to live with the imbalance of power, recognizing that they have limited room for
maneuver (Hingley, 2005b). Others seek to identify strategies for improving the
position of weaker actors (i.e. sources of countervailing power) in buyer-seller
relationships (Etgar, 1976). The second contribution of this paper is to assess the extent
to which membership of a marketing cooperative can improve a buyer’s trustworthiness
by providing countervailing power to suppliers. While the theory of countervailing
power is long established (Galbraith, 1954), with a recognition that marketing
cooperatives may act as a mechanism for achieving this (Hendrikse & Bijman, 2002),
empirical evidence remains scarce. The latter may reflect that the generic literature on
buyer-supplier relationships overwhelmingly draws on manufacturing and retail cases,
where marketing cooperatives are relatively uncommon, rather than agriculture which
has a far stronger tradition of cooperative buying and selling (Jang & Klein, 2011).
Considering the potential role of marketing cooperatives as a source of countervailing
5
producers within supply chains characterized by increasingly concentrated and
powerful downstream actors (FAO, 2014a).
Finally, while the literature on power and trust in buyer-supplier relations is
extensive, to date it draws overwhelmingly on data and examples from North America
and Western Europe (Zhao, Huo, Flynn, & Yeung, 2008) so that many important
regions of the world remain under-studied. There is thus a need to extend research to
other locations, considering the determinants of constructs such as trust in emerging
economies, which may have far higher levels of opportunistic behavior (Burgess &
Steenkamp, 2006). The third contribution of the paper addresses this and the call of
Cannon, Doney, Mullen, and Petersen (2010) for the examination of buyer trust and
supplier performance in a wider range of different geographical contexts.
The Armenian dairy sector is an exemplary case for investigating the
relationships between asymmetric power in buyer-seller relationships, buyer
trustworthiness and supplier performance as it is characterized by sufficient variance in
these variables for robust modelling. The dairy industry requires close relationships
between producers and manufacturers given the highly perishable nature of the good,
the flow of production (twice daily milking) and typically daily collections (Bijman,
2012; Dries, Germenji, Noev, & Swinnen, 2009). As in most emerging and transitional
economies, Armenian dairy processors confront a supply base characterized by
suppliers that vary significantly in size with a large number of small-scale producers,
which are generally poorly capitalized. The Armenian sample analyzed in this paper
records a mean herd size of 13.36 cows, with 50% of farms having eight cows or fewer
and an average yield of 2,246 kg per milking cow. Worldwide there are 122 million
dairy farms, with a mean herd size of 3 cows and an average yield of 2,100kg per
6
largest dairy market, the average herd size is 6.7 cows with a mean yield of 2,282 kg
per milking cow (FAO, 2014b). In the EU, the mean herd size and yield is higher (34
cows and 7,068 kg respectively), but this masks important variations with some New
Member States having much smaller-sized operations, for example in Romania the
mean herd size and yield is 6 cows and 3,917 kg respectively (European Commission,
2013). Armenia thus shares many characteristics of dairy sectors in other emerging and
transitional economies, enhancing the applicability of the analysis to other regional and
national contexts.
2. Conceptual Framework and Hypotheses
The quality and quantity of a manufacturer’s output is highly dependent on the
capabilities and performance of its suppliers (Benton & Maloni, 2005). Specifically,
previous research identifies that supplier performance depends on the actions of both
buyers and sellers (Maloni & Benton, 2000), the balance of power in the buyer-supplier
dyad (Benton & Maloni, 2005; Kumar et al., 1995) and the degree of relationship trust
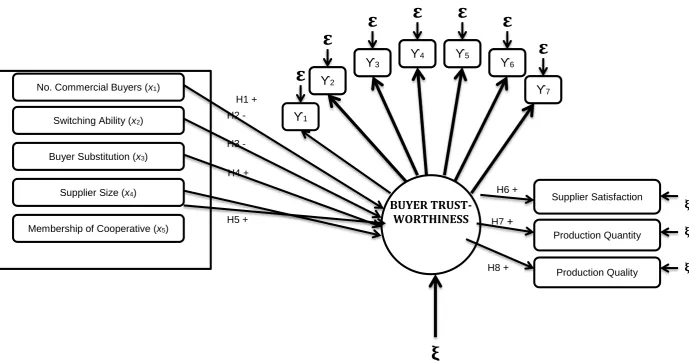
(Meehan & Wright, 2012). The model depicted in Figure 1 seeks to capture the
associative relationships between buyer-seller power, buyer trustworthiness, and
supplier satisfaction / improvements in output performance (quality & quantity of
supply). The remainder of this section briefly reviews the literature on power and trust
and details how they are conceptualized in this paper, before justifying each hypothesis
in turn.
7
The literatures on power and trust are both large and multidisciplinary.
Pinnington and Scanlon (2009) identify three main viewpoints on power: personal,
social, and organizational supply chain perspectives. The literature on personal power
derives from French and Raven (1959) and later amendments (Raven, 1993), and
identifies six bases of power: reward, coercion, legitimate, expert, referent, and
informational. These bases vary in terms of the necessity of surveillance and social
dependence. French and Raven’s (1959) approach informed much early research on
supply chain relationships (e.g. Hunt & Nevin, 1974) but has been criticized for
associating power with control and having an undue focus on the negative, subjugating
connotations of power with no recognition of mutuality (Pinnington & Scanlon, 2009).
The social power literature focuses on the sources and application of power in relation
to social groups, drawing on the insights of Foucault (1977). For the latter, the self is a
constructed identity that implicates us in our subordination to a regime of power. This
paper adopts the third, organizational supply chain approach to power (Cox, 2004a;
Cox, Ireland, Lonsdale, Sanderson, & Watson, 2002).
The organizational supply chain approach assumes that power in buyer-seller
relationships depends on the relative strategic significance and the availability of
alternatives (scarcity) to the resources that are exchanged between the two parties (Cox
et al., 2002). Power thus depends on the relative positions of each actor, it is not an
absolute concept, and emerges from the specific context of the relationship. This
implies that actors behave and interact with others differently, depending on their
relative power sources.
Regarding how actors exercise their power, this paper follows the logic of
Kumar et al. (1995). The latter draws on bilateral deterrence theory to explain the
8
likelihood of opportunistic behavior is reduced where power between a buyer and seller
is symmetric as the stakes each has in the relationship, the costs of conflict and dangers
of a retaliatory strike are similar. However, increasing asymmetry reduces the
impediments to the more powerful firm acting opportunistically as it has less need to
be cooperative, trustworthy or committed (Kumar et al., 1995). The greater the relative
power of a buyer vis-à-vis a supplier, therefore, the less likely the former is to be
trustworthy. Following Doney and Cannon (1997, p. 36) trust is defined for the purpose
of this study as ‘the perceived credibility and benevolence of a target of trust’. Buyer
trustworthiness therefore refers to the extent to which a supplier perceives its primary
buyer as reliable (credible) and interested in the supplier's best interests (benevolent)
(Dyer & Chu, 2003).
It is proposed that buyer trustworthiness depends on five dimensions of the
relative power of buyers and suppliers, which following the logic of Cox (2001) capture
the relative strategic significance and scarcity of resources exchanged between the two
parties. Specifically these are: the potential number of other commercial buyers
realistically available to the supplier (x1), the ease with which the supplier can switch
to a different main buyer (x2), the ease with which the buyer can replace the supplier
(x3), the size of the supplier (x4), and whether the supplier is a member of a marketing
cooperative (x5). The first four measures capture substitutability, scarcity and the
attractiveness of the supplier’s resources (Cox et al., 2002; Ramsay, 1996) while
membership of a marketing cooperative is considered as a potential mechanism for
providing suppliers with countervailing power (Galbraith, 1954). Buyer trustworthiness
is assumed to influence suppliers’ satisfaction, and stimulate improvements in the
9
Based on the model presented in Figure 1, eight hypotheses are proposed and
the rationale for each is detailed in turn.
2.1 The number of potential buyers
The number of potential buyers for a supplier’s output varies across markets. The most
restrictive case is a monopsony (single buyer). With a monopsony, the buyer can act
opportunistically with suppliers remaining highly dependent on that buyer owing to a
lack of alternatives. As such, power resides almost entirely with the buyer (Cox et al.,
2002). In markets where a seller faces a large number of potential buyers, the level of
dependency is lower (Christopher, 2011), so that if the buyer acts opportunistically, it
risks the danger of the seller terminating the relationship. In the case of a monopsony,
the seller has no alternatives, however, so for the buyer the danger of conflict and
retaliatory action by the supplier is weak (Kumar et al., 1995). This implies that:
H1: The potential number of commercial buyers for a supplier’s output positively
influences buyer trustworthiness.
2.2 Suppliers’ switching ability
The ability of a supplier to switch to another buyer depends on more factors than simply
the number of potential buyers. For the seller, switching costs are the expenses
associated with changing from one buyer to another. Three types are commonly
acknowledged: (i) transaction costs, (ii) learning costs, and (iii) artificial or contractual
costs (Klemperer, 1987). In a B2B context, transaction costs have received most
attention (Williamson, 1983), namely the costs of searching for, negotiating,
monitoring and enforcing a business relationship. To meet the requirements of a
10
little value outside of that specific relationship (high asset specificity). Such
investments are an important form of switching cost, which may tie a supplier to a
particular buyer (Heide & John, 1988; Williamson, 1983). Consequently, when supplier
switching costs are high, power typically rests with the buyer (Cox, 2004a) so that
suppliers are ‘captive’ (Gereffi, Humphrey, & Sturgeon, 2005). High switching costs
therefore increase the likelihood that opportunistic behavior on the part of the buyer
goes unpunished by the seller (they do not exit the relationship), so that:
H2: The difficulty of a supplier switching to another main buyer negatively influences
buyer trustworthiness.
2.3 Buyers’ substitutability of suppliers
The ability of a buyer to switch to a different supplier affects the balance of power. In
a market characterized by numerous suppliers possessing similar capabilities, the
balance of power is tilted towards the buyer (Cox, 2004a). There is empirical evidence
for this: in the pharmaceutical market competition between suppliers, with a high
degree of substitutability between them in the case of generic drugs, is critical for large
buyers to obtain more favorable terms (Ellison & Snyder, 2010). The more generic the
suppliers’ output, the less the substitution of suppliers influences a buyer’s goals and
outcomes, making switching decisions between suppliers less risky. A negative
association between the ease with which a supplier can be substituted and buyer
trustworthiness is therefore proposed:
H3: The ease with which the buyer can substitute the supplier negatively influences
buyer trustworthiness.
11
Research on agri-food markets suggests that buyers prefer to maintain relationships
with a small number of larger suppliers rather than a mass of small-scale producers
(Fearne & Hughes, 2000; Hingley, 2005a). The former reduces transaction costs
(particularly negotiation and monitoring costs), yields economies of scale and typically
gives the buyer greater control over the offering (Christopher, 2011; White, 2000). This
logic has underpinned the rationalization of the global agri-food supply base, with the
marginalization and exclusion of some small-scale producers from restructured supply
chains (Van Der Meer, 2006).Larger suppliers are thus of greater strategic importance
to buyers than smaller counterparts (Kähkönen & Virolainen, 2011). Ceteris paribus,
the buyer should consequently value a relationship with a larger producer to a greater
extent than with a smaller one, so that:
H4: The size of a supplier positively influences buyer trustworthiness
2.5 Membership of a marketing cooperative
Galbraith (1954) refers to countervailing power as the mechanism by which power
evolves between buyers and sellers. He argues that the motive for countervailing action
emerges where power is asymmetric, so that weaker parties are impelled to cooperate
with others in a similar position for their own protection and with the hope of capturing
some of the gains of the currently stronger actor(s). Galbraith (1954) acknowledges a
number of potential mechanisms for realizing countervailing power, citing, as an
example, the emergence of European consumer cooperatives in the face of oligopolistic
producers. Global agri-food markets are characterized by increasing concentration at
processing and retail levels (Dobson, Waterson, & Davies, 2003), while most branches
of agricultural production, in contrast, remain characterized by family farms and
12
supply chains thus identify power being skewed toward downstream buyers (e.g.
Bourlakis & Weightman, 2004; Fearne & Duffy, 2004; Hingley, Lindgreen, &
Casswell, 2006; Simons, Francis, Bourlakis, & Fearne, 2003; Touboulic, Chicksand, &
Walker, 2012). In this environment, individual farms lack bargaining power so that
collective action between suppliers becomes an attractive option (Hendrikse & Bijman,
2002). Marketing cooperatives are one form of collective action, which may generate
countervailing power with membership decreasing the likelihood of buyer
opportunism. This is because any loss in supply from a collective group of sellers would
be more damaging to the buyer than the termination of a relationship with a single
seller. In other words, the strategic importance to the buyer of a collective group of
suppliers is greater than that of a supplier independently (Kumar et al., 1995), so that :
H5: A supplier’s membership of a marketing cooperative positively influences buyer
trustworthiness.
2.6 Supplier satisfaction
Satisfaction in a buyer-seller context can be defined as ‘a positive affective state
resulting from the appraisal of all aspects of a firm’s working relationship with another
firm’ (Lam, Shankar, Erramilli, & Murthy, 2004, p. 295). Ganesan (1994) argues that
trustworthiness and satisfaction are related in that actors are more likely to be
dissatisfied with a relationship in which the other party acts opportunistically and is
perceived to be untrustworthy. Such exploitative relationships generate feelings of
anger and resentment (Ganesan, 1994). Conversely, a relationship in which actors are
concerned about one another’s welfare engenders satisfaction. This can be
13 H6: Buyer trustworthiness positively influences supplier’s satisfaction with the
relationship with their main buyer.
2.7 Improvements in suppliers’ production quantity and quality
Handfield and Bechtel (2002) conceptualize that trust in a buyer-supplier relationship
is positively associated with supplier responsiveness. They argue that suppliers ‘go out
of their way (beyond contractual agreements)’ for trustworthy buyers (Handfield &
Bechtel, 2002, p. 373) and present supporting empirical evidence. Similarly, Gow and
Swinnen (2001) contend that buyer trustworthiness increases supplier responsiveness.
They explain this by drawing on theories of private contract enforcement, reasoning
that in markets characterized by high levels of buyer opportunism suppliers will be less
willing to make relationship-specific investments. However, if a buyer is perceived to
be trustworthy, a supplier will be more confident about investing. This is particularly
the case when the buyer pays on time (Gow & Swinnen, 1998). Investment by suppliers
is likely to be critical, positively impacting on their performance, especially in markets
characterized by undercapitalized firms with deficiencies in both the quantity and
quality of output (Swinnen & Vandeplas, 2010). This suggests that:
H7: Buyer trustworthiness positively influences improvements in suppliers’ production
quantity.
H8: Buyer trustworthiness positively influences improvements in suppliers’ production
quality.
3. Overview of Armenian dairy farmer – milk buyer relationships
By the end of the Soviet era, there were around 1,000 sovkhozy (state farms) and
14
Collectively these farms maintained approximately 800,000 cattle and supplied 40
relatively large-scale and over 100 small-scale milk processing facilities. After the
collapse of the Soviet Union, the dairy sector suffered as real incomes declined. The
volumes of dairy goods produced by the former sovkhozy and kolkhozy, which were
privatized in the mid-1990s, dropped from 130,000 to about 5,500 tons per year. Most
ceased to function and were partially replaced by more than 150,000 micro dairy
‘farms’ which became the main suppliers of raw milk supplying a population for
Armenia of 3 million people (Alpha Plus Consulting & DAI 2003).
From 1995 onwards the dairy sector started to recover. A few privatized dairy
processors restarted production, albeit at much reduced volumes. Many new small
plants emerged, largely producing cheese often with inadequate food safety systems.
Outside of the capital city, Yerevan, home-made products largely dominated
consumption (Urutyan, 2009).
The United States Department of Agriculture (USDA) provided significant
financial, technical and marketing support to revitalize the Armenian dairy sector. The
USDA Marketing Assistance Project (MAP) ran from 1992 until 2005. It issued around
328 loans totaling $11 million to new or expanding agribusinesses (Urutyan,
Aleksandryan, & Hovhannisyan, 2006). USDA MAP and later the Center for
Agribusiness and Rural Development Foundation (CARD), a spin-off organization of
MAP, contributed to the development of the dairy sector by helping processors to
modernize their equipment and apply good manufacturing practices and by supporting
the establishment of milk marketing cooperatives and milk collection centers in many
villages.
By 2012 there were around 180,000, mostly small, dairy farms in Armenia
15
ICARE, 2013). The total dairy herd was 303,000 cows in 2012 (Table 1) with almost
50% of the produced milk delivered to dairy processors. The rest was used on farm and
within the household. Milk yields per cow are about 30% of the EU average (Eurostat,
2012).
Table 1 here
In autumn 2013 there were 70 dairy processors operating in Armenia, none of
which were foreign owned. Not all processors provide prompt payments to milk
producers (Urutyan, 2009). In Armenia, farmers or cooperatives do not own a
processing company, and usually their relationship with dairy processors is based on
informal contracts. Cooperative - dairy processor relationships emerged in the early
2000s after USDA MAP introduced a development program which established more
than 30 milk marketing cooperatives. Marketing cooperatives possess cooling tanks and
storage facilities (mostly donated), which enable them to continuously procure milk
from farmers.
4. Model Operationalization
4.1 Data Collection
As the focus of the study is dairy farmer – milk processor relationships, sampling was
restricted to primary producers who sell cows’ milk. Consequently, those farmers
without dairy cows or who did not sell any of the milk produced were excluded from
16
commercial dairy farms, agricultural companies and household producers (providing
they marketed at least some milk).
Respondents were drawn from Armenian regions (marzes) with significant
commercial milk production. Quotas, in proportion to the region’s share of national
output, were selected (Table 2). Data collection occurred thus in all regions apart from
Yerevan City, Armavir and Vayots Dzor where milk production is of minor importance
(collectively less than 10% of national output). Respondents were identified using a
combination of sources, namely: local and regional authorities, agricultural agencies,
local livestock experts and village mayors. In total, the sample comprised 300 useable
responses. Data collection occurred via face to face interviews, conducted on-farm,
using a standardized questionnaire.
Table 2 here
4.2 Variable Measurement
Appendix A details the measures used to operationalize the MIMIC model. The
construct buyer trustworthiness is based on Doney and Cannon’s (1997) scale of trust
(y1 - y7), which has been applied and verified extensively in the context of
buyer-supplier relationships (Ivens, 2005; Terawatanavong, Whitwell, Widing, & O'Cass,
2011; Wagner, Coley, & Lindemann, 2011). As discussed above, five formative
variables captured each of the dimensions of relative power between buyers and
suppliers, namely: the supplier’s estimate of the potential number of other commercial
buyers for their milk (x1), the perceived ease with which the supplier can switch to
another main buyer (x2), the perceived ease with which the buyer can replace the
17
the supplier was a member of a milk marketing cooperative (x5). The number of milking
cows is the most commonly used measure of the size of dairy farm operations (Foltz,
2004). The three endogenous indicators were supplier satisfaction (SAT) and measures
of the degree to which the relationship with the main buyer was perceived to have
improved the quantity of output (QNT) and product quality (QLT). All questions
referred to the supplier’s relationship with their main buyer.
Appendix B lists the means and standard deviations for all of the variables
included in the research model. The minimum and maximum values are also provided
for each of the continuous measures. A correlation matrix is reproduced in Appendix
C. The tables in Appendices B and C confirm the suitability of variables in the model
and the standard deviations do not reveal any restrictions in range across measures
(Winklhofer & Diamantopoulos, 2002). The exception to this was the supplier size
variable, which was positively skewed. Consequently, as discussed below, we based
analysis of this variable on estimation techniques known to counteract issues of
multivariate normality (MVN).
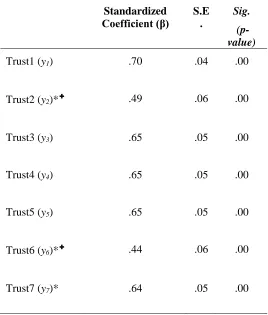
4.3 Buyer Trustworthiness: Construct Specification and Modification
Prior to specifying the MIMIC model, an exploratory factor analysis in SPSS 21 using
varimax rotation revealed that the seven items for the reflective component of the buyer
trustworthiness construct loaded on a single factor with an acceptable level of internal
consistency (α = .75) (Hair, Black, Babin, Anderson, & Tatham, 2010). Further, this
same construct was specified within the Mplus 7.0 package using the more restrictive
confirmatory factor analysis framework (Muthén & Muthén, 2012). The initial model
yielded a reasonable fit to the data as denoted by conventional standards outlined in the
18
.94; TLI = .91; RMSEA = .07). However, closer inspection of the standardized
estimates (Table 3) revealed that two reflective items in the buyer trustworthiness scale
(Trust2 and Trust6), both with reverse order scales, had low factor loading scores
(<.50), compromising convergent validity, and making them candidates for deletion
(Iacobucci, 2010). The use of reversed-scaled items in creating unidimensional
constructs for structural equation modeling has long been considered as problematic,
despite the benefit of reducing acquiescence bias (Herche & Engelland, 1996). To
improve the measurement properties of the construct (Anderson & Gerbing, 1988) these
two items were removed.
Table 3 here
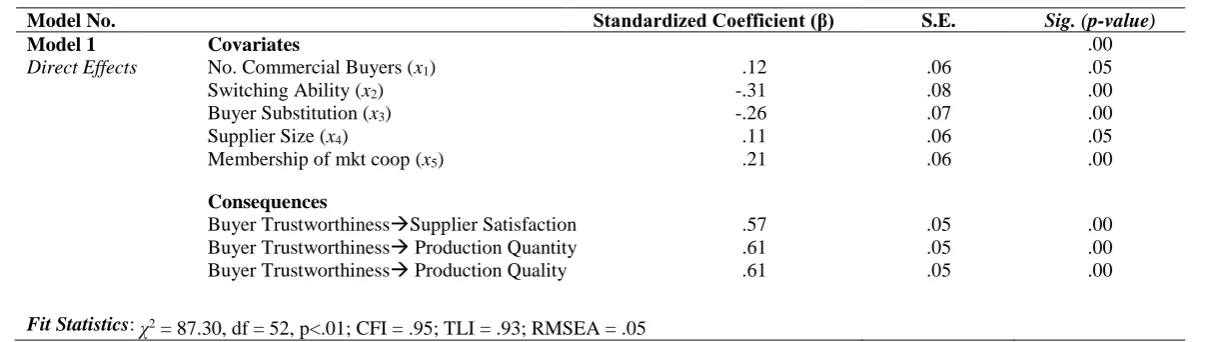
Following these initial checks, the MIMIC model for the buyer trustworthiness
construct, with formative covariates and consequences, was specified and each
hypothesis assessed.
4.4 MIMIC Model
Robust maximum likelihood (MLR) in Mplus 7.0 (Muthén & Muthén, 2012), known
for its lower sensitivity to deviation from multivariate normality (Chou, Bentler, &
Satorra, 1991), was selected to estimate the model. The main difference between the
MIMIC and (aforementioned) measurement model was the inclusion and specification
of five formative variables representing the dimensions of power (i.e. the potential
number of other commercial buyers, supplier’s switching ability, buyer’s ability to
substitute the supplier, supplier size and supplier membership of a marketing
19
improvement in suppliers’ production quantity, perceived improvement in suppliers’
production quality). The resulting model had a reasonable model fit (χ2 = 87.30, df =
52, p<.01; CFI = .95; TLI = .93; RMSEA = .05). The selected covariates account for
22% of variation in buyer trustworthiness, with the latter explaining 32% of the
variance in supplier satisfaction, 37% of perceived improvements in suppliers’
production quantity and 38% of perceived improvements in suppliers’ production
quality.
Next, we evaluated specific relationships (i.e. standardized paths) between
variables in the model (Table 4). It is worth noting that each of the covariates (formative
indicators) has a statistically significant effect on the endogenous construct (buyer
trustworthiness). The number of potential other commercial buyers (x1)has a positive
effect on buyer trustworthiness confirming H1 (β = .12; p=.05). From the total sample,
9.7% indicated that they had no other potential commercial buyers for their milk, with
an average of 2.03 other commercial buyers reported (see Appendix B). A significant
proportion of suppliers thus have no alternative marketing options (monopsony) but
this is not universally the case.
Switching ability (x2) (β = -.31; p<.01) and buyer substitution (x3) (β = -.25;
p<.01) has a negative effect on trustworthiness supporting H2 and H3. Consequently,
as it becomes easier to be replaced as a supplier and, the difficulty of switching to
another buyer increases, levels of buyer trustworthiness correspondingly decrease. As
the size of a supplier (x4) increases, buyer trustworthiness also increases (β = .11;
p=.05). H4 istherefore accepted. Finally, membership of a marketing cooperative (x5)
20
accepted. The model also supports each of three hypothesized consequences of buyer
trustworthiness (H6, H7, H8). As such, when buyer trustworthiness increases, so do
supplier satisfaction (β = .57; p<.01), suppliers’ production quantity (β = .61; p < .01)
and suppliers’ production quality (β = .61; p <. 01).
Table 4 here
5. Discussion
Drawing on an organizational supply chain perspective of power and Kumar et al.’s
(1995) application of bilateral deterrence theory, this paper presents a novel model of
the relationships between buyer-supplier power, buyer trustworthiness and supplier
satisfaction / performance. All hypotheses are accepted and the findings verify the
viability of the framework.
The results support a key tenet of the organizational supply chain perspective
(Cox, 2001, 2004b; Cox et al., 2002), namely that the execution of power in
buyer-seller relationships depends on the relative positions of each actor. Specifically, buyers
are perceived to be more trustworthy where there is greater competition in the buyer’s
market, i.e. where there are more alternative buyers that a supplier can choose from and
when it is easier for suppliers to switch to them. The analysis also shows that greater
buyer trustworthiness has a significant, positive effect on suppliers’ satisfaction with
the relationship and their performance both in terms of output quantity and quality. This
supports the notion that high levels of buyer opportunism curb suppliers’ willingness
to ‘go the extra mile’ (Handfield & Bechtel, 2002, p. 373) or make investments (Gow
21
quantity of suppliers’ output. Such an outcome thus impedes attempts to improve
productivity and international competitiveness.
5.1 Managerial implications
For suppliers, the results reveal three strategies to improve their relative power
and position vis-à-vis buyers: grow in size, positively differentiate themselves from
other suppliers in a way in which is beneficial to buyers so that they are less easily
substitutable, and / or join a marketing cooperative. Generally, larger suppliers are of
greater value to buyers, lowering transaction costs, particularly when the supply base
is very fragmented. In the case of milk, being highly perishable, bulky and costly to
transport, it is size relative to other suppliers on the domestic market which matters as
there is minimal international trade in fresh milk. For goods which can be procured
across borders, relative size on the international market will be more important.
The second strategy for suppliers to improve their position vis-à-vis buyers is to
reduce the degree to which they can be substituted by competitors. This involves
differentiating themselves from other suppliers in a way in which is valued by the buyer
and not easily copied by others. Regarding the form of differentiation, it would be best
for the supplier to look at attributes that are valued by a number of buyers. If suppliers
differentiate themselves in a manner which is valued only by their current main buyer,
it would increase their dependence on the latter and involve risky, relationship-specific
investments.
Thirdly, for managers, the analysis demonstrates the benefit of joining a
marketing cooperative as a solution for curbing buyer opportunism where suppliers
individually lack power. In the Armenian case, milk buyers have generally been
22
transaction costs given a fragmented supply base. In other cases, when production is
less fragmented, buyers may be more wary of dealing with marketing cooperatives as
the benefit to the buyer of lower transaction costs can be more than offset by the extra
rents accrued by suppliers acting collectively.
Finally, many treatments of power recommend that parties maximize their
power over other actors. Being the most powerful actor does bring enormous
advantages and these should not be ignored or downplayed (Hingley, 2005b). However,
if the power imbalance toward buyers is so great, supplier trust in that buyer is
compromised and the former will be reluctant to invest in a relationship in which they
are so vulnerable. This hurts improvements in supplier performance. Thus, in some
regards, high power imbalance can be counterproductive, particularly where the buyer
seeks to stimulate improvements in the quality and quantity of suppliers’ output. Buyers
that forego some of the potential to exploit a favorable power imbalance in the
short-term may yield long-short-term benefits in supplier performance.
5.2 Policy Implications
The results demonstrate that competition policy matters not just for downstream
customers but also that monopsonies can be detrimental to suppliers. In the Armenian
case the number of other commercial buyers available to a supplier is a significant
determinant of buyer trustworthiness. Other research demonstrates that the lack of
alternative buyers also depresses the prices received by suppliers for their output and
can lead to the latter being charged vastly inflated fees for inputs provided by buyers
(Perekhozhuk, Glauben, Teuber, & Grings, 2014; Sadler, 2006; Sauer, Gorton, &
White, 2012). An effective competition authority which breaks up monopsonies will
23
weak social safety nets, tends to depend heavily on the returns to their output. At the
same time as improving suppliers’ position, breaking up monopsonies also improves
downstream (consumer) welfare (Perekhozhuk et al., 2014). Small-scale producers are
often ignorant of the prices and services received by their counterparts and in such an
environment there is a case for a publically funded market information service (Sadler,
2006; Shepherd, 1997). To be successful the latter should be combined with an effective
competition policy which breaks up monopolies and monopsonies.
Second, the results support initiatives to establish marketing cooperatives. This
has been a policy objective in Armenia, financially supported by USDA MAP (Cocks,
Gow, & Dunn, 2003), as well as in the EU (Bijman, 2012) and some other emerging
economies (FAO, 2014a). Marketing cooperatives have the potential to strengthen the
bargaining power of farmers as well as reduce transaction costs and improve the
coordination of operations (Bijman, 2012). However in practice, marketing
cooperatives have not always delivered these benefits (Bhuyan, 2007). Establishing and
maintaining a marketing cooperative demands effective leadership and recognition of
the importance of ‘people’ related factors (Bhuyan, 2007; Bijman, 2012). This requires
attention from both domestic policy makers and international donor programmes,
particularly for capacity building and managerial and organizational assistance. There
is a clear rationale for educating farmers about the benefit of marketing cooperatives
and using successful cases to demonstrate what can be achieved.
In the context of Armenia, as in much of Central and Eastern Europe, a further
complication for extending the role of marketing cooperatives is related to the Soviet
legacy and farmers’ negative perceptions of kolkhozy. In Armenia, most farmers
confuse marketing cooperatives with former kolkhozy (Urutyan, 2009). Moreover, even
24
marketing cooperatives, namely user-control, user-benefit, and user-ownership. These
problems are not insurmountable (Cocks et al., 2003) but require integrated policy
support that aids cooperative decision-making (governance and accounting),
understanding (education and training), and upgraded production practices (traditional
agricultural extension).
6. Limitations and future research
The MIMIC model presented has been verified with data for Armenia. While this
country’s dairy sector shares many of the characteristics of agri-food markets in other
emerging and transitional economies, testing the model in other contexts is warranted.
Ideally, replication studies should involve the collection of data from more than one
point in time to better capture the evolution of buyer-supplier relationships and evaluate
the importance of length of relationships.
In the model presented, in keeping with organizational supply chain
perspectives (Cox et al., 2002), power is assumed to be based on the relative position
of buyers and sellers within a specific dyad. There may be other sources of power that
affect the degree of buyer trustworthiness; for example, political connections and links
to organized crime. These are not captured in the study and may be difficult for
researchers to measure in an accurate, verifiable manner.
The results establish that marketing cooperatives can provide countervailing
power and curb buyer opportunism. However, their establishment has often proved
problematic. Case study research considering successful and unsuccessful marketing
cooperatives, particularly in emerging and transitional economies, could generate
insights into how they can be best managed, for instance regarding rules governing
25
collective bargaining with buyers. Such research would generate practical lessons to
guide the management of new and established marketing cooperatives.
References
Allen, D. W., & Lueck, D. (1998). The nature of the farm. Journal of Law &
Economics, 41(2), 343-386. doi: 10.1086/467393
Alpha Plus Consulting, & DAI (2003). Milk and Dairy Goods in Armenia: Market
Survey and Analysis. Yerevan.
Anderson, J. C., & Gerbing, D. W. (1988). Structural equation modeling in practice:
A review and recommended two-step approach. Psychological Bulletin,
103(3), 411-423. doi: 10.1037/0033-2909.103.3.411
Bagozzi, R. P., & Yi, Y. (2012). Specification, evaluation, and interpretation of
structural equation models. Journal of the Academy of Marketing Science,
40(1), 8-34. doi: 10.1007/s11747-011-0278-x
Benton, W. C., & Maloni, M. (2005). The influence of power driven buyer/seller
relationships on supply chain satisfaction. Journal of Operations
Management, 23(1), 1-22. doi: 10.1016/j.jom.2004.09.002
Bhuyan, S. (2007). The “people” factor in cooperatives: an analysis of members'
attitudes and behavior. Canadian Journal of Agricultural Economics, 55(3),
275-298. doi: 10.1111/j.1744-7976.2007.00092.x
Bijman, J. (2012). Support for farmers' cooperatives. Brussels.: Report prepared
26 Bourlakis, M. A., & Weightman, P. W. H. (2004). Introduction to the UK food supply
chain. In M. A. Bourlakis & P. W. H. Weightman (Eds.), Food Supply Chain
Management (pp. 1-10). Oxford: Blackwell.
Burgess, S. M., & Steenkamp, J.-B. E. M. (2006). Marketing renaissance: How
research in emerging markets advances marketing science and practice.
International Journal of Research in Marketing, 23(4), 337-356. doi:
10.1016/j.ijresmar.2006.08.001
Cannon, J. P., Doney, P. M., Mullen, M. R., & Petersen, K. J. (2010). Building
long-term orientation in buyer–supplier relationships: The moderating role of
culture. Journal of Operations Management, 28(6), 506-521. doi:
10.1016/j.jom.2010.02.002
Chou, C.-P., Bentler, P. M., & Satorra, A. (1991). Scaled test statistics and robust
standard errors for non-normal data in covariance structure analysis: A
Monte Carlo study. British Journal of Mathematical and Statistical
Psychology, 44(2), 347-357. doi: 10.1111/j.2044-8317.1991.tb00966.x
Christopher, M. (2011). Logistics and Supply Chain Management (4th ed.). Harlow:
Financial Times/Prentice Hall.
Cocks, J., Gow, H. R., & Dunn, D. J. (2003). Meeting private grades and standards in
transition agriculture: Experiences from the Armenian dairy industry.
International Food and Agribusiness Management Review, 6(1), 3-11.
Cox, A. (2001). Understanding buyer and supplier power: A framework for
procurement and supply competence. Journal of Supply Chain Management,
27 Cox, A. (2004a). The art of the possible: relationship management in power
regimes and supply chains. Supply Chain Management-an International
Journal, 9(5), 346-356. doi: 10.1108/13598540410560739
Cox, A. (2004b). Business relationship alignment: on the commensurability of
value capture and mutuality in buyer and supplier exchange. Supply Chain
Management-an International Journal, 9(5), 410-420. doi:
10.1108/13598540410560793
Cox, A., Ireland, P., Lonsdale, C., Sanderson, J., & Watson, G. (2002). Supply chains,
markets and power: managing buyer and supplier power regimes. London:
Routledge.
Diamantopoulos, A., Riefler, P., & Roth, K. P. (2008). Advancing formative
measurement models. Journal of Business Research, 61(12), 1203-1218.
doi: 10.1016/j.jbusres.2008.01.009
Dobson, P. W., Waterson, M., & Davies, S. W. (2003). The patterns and implications
of increasing concentration in European food retailing. Journal of
Agricultural Economics, 54(1), 111-125. doi:
10.1111/j.1477-9552.2003.tb00053.x
Doney, P. M., & Cannon, J. P. (1997). An examination of the nature of trust in
buyer-seller relationships. Journal of Marketing, 61(2), 35-51. doi:
10.2307/1251829
Dries, L., Germenji, E., Noev, N., & Swinnen, J. F. M. (2009). Farmers, vertical
28 Eastern Europe. World Development, 37(11), 1742-1758. doi:
10.1016/j.worlddev.2008.08.029
Dyer, J. H., & Chu, W. (2003). The role of trustworthiness in reducing transaction
costs and improving performance: Empirical evidence from the United
States, Japan, and Korea. Organization Science, 14(1), 57-68. doi:
10.1287/orsc.14.1.57.12806
Ellison, S. F., & Snyder, C. M. (2010). Countervailing power in wholesale
pharmaceuticals. Journal of Industrial Economics, 58(1), 32-53. doi:
10.1111/j.1467-6451.2010.00408.x
Etgar, M. (1976). Channel domination and countervailing power in distributive
channels. Journal of Marketing Research, 13(3), 254-262. doi:
10.2307/3150735
European Commission. (2013). EU Dairy Farms Report. Brussels: European
Commission.
Eurostat. (2012). Agriculture, Fishery and Forestry Statistics: Main results –
2010-11. Luxembourg: Publications Office of the European Union.
FAO. (2014a). Cooperatives and Producers Organizations Retrieved 25th March
2014, 2014, from http://www.fao.org/partnerships/cooperatives/en/
FAO. (2014b). FAOSTAT Database. Rome: FAO.
Fearne, A., & Duffy, R. (2004). Partnerships and alliances in UK supermarket
networks. In M. A. Bourlakis & P. W. H. Weightman (Eds.), Food Supply
29 Fearne, A., & Hughes, D. (2000). Success factors in the fresh produce supply chain:
insights from the UK. British Food Journal, 102(10), 760-772. doi:
10.1108/00070700010362194
Foltz, J. D. (2004). Entry, exit, and farm size: assessing an experiment in dairy price
policy. American Journal of Agricultural Economics, 86(3), 594-604. doi:
10.1111/j.0002-9092.2004.00603.x
Foucault, M. (1977). Discipline and Punish: The birth of the prison. London:
Penguin.
French, J. R. P., Jr., & Raven, B. (1959). The bases of social power. In D. Cartwright
(Ed.), Studies in Social Power (pp. 150-167). Ann Arbor, MI: Institute for
Social Research, University of Michigan.
Galbraith, J. K. (1954). Countervailing power. American Economic Review, 44(2),
1-6. doi: 10.2307/1818317
Ganesan, S. (1994). Determinants of long-term orientation in buyer-seller
relationships. Journal of Marketing, 58(2), 1-19. doi: 10.2307/1252265
Gereffi, G., Humphrey, J., & Sturgeon, T. (2005). The governance of global value
chains. Review of International Political Economy, 12(1), 78-104. doi:
10.1080/09692290500049805
Gow, H. R., & Swinnen, J. F. M. (1998). Up- and downstream restructuring, foreign
direct investment, and hold-up problems in agricultural transition.
European Review of Agricultural Economics, 25(3), 331-350. doi:
30 Gow, H. R., & Swinnen, J. F. M. (2001). Private enforcement capital and contract
enforcement in transition economies. American Journal of Agricultural
Economics, 83(3), 686-690. doi: 10.2307/1245100
Hair, J. F., Black, W. C., Babin, B. J., Anderson, R. E., & Tatham, R. L. (2010).
Multivariate Data Analysis (7th ed.). Upper Saddle River, NJ: Prentice Hall
Handfield, R. B., & Bechtel, C. (2002). The role of trust and relationship structure
in improving supply chain responsiveness. Industrial Marketing
Management, 31(4), 367-382. doi: 10.1016/S0019-8501(01)00169-9
Heide, J. B., & John, G. (1988). The role of dependence balancing in safeguarding
transaction-specific assets in conventional channels. Journal of Marketing,
52(1), 20-35. doi: 10.2307/1251683
Hendrikse, G., & Bijman, J. (2002). On the emergence of new growers' associations:
self-selection versus countervailing power. European Review of
Agricultural Economics, 29(2), 255-269. doi: 10.1093/eurrag/29.2.255
Herche, J., & Engelland, B. (1996). Reversed-polarity items and scale
unidimensionality. Journal of the Academy of Marketing Science, 24(4),
366-374. doi: 10.1177/0092070396244007
Hingley, M. K. (2005a). Power imbalance in UK agri-food supply channels:
Learning to live with the supermarkets? Journal of Marketing Management,
21(1-2), 63-88. doi: 10.1362/0267257053166758
Hingley, M. K. (2005b). Power to all our friends? Living with imbalance in
supplier–retailer relationships. Industrial Marketing Management, 34(8),
31 Hingley, M. K., Lindgreen, A., & Casswell, B. (2006). Supplier-retailer relationships
in the UK fresh produce supply chain. Journal of International Food &
Agribusiness Marketing, 18(1-2), 49-86. doi: 10.1300/J047v18n01_04
Hu, L., & Bentler, P. M. (1999). Cutoff criteria for fit indexes in covariance structure
analysis: Conventional criteria versus new alternatives. Structural
Equation Modeling: A Multidisciplinary Journal, 6(1), 1-55.
Hunt, S., & Nevin, J. R. (1974). Power in a channel of distribution: sources and
consequences. Journal of Marketing Research, 11(2), 186-193. doi:
10.2307/3150557
Iacobucci, D. (2010). Structural equations modeling: Fit Indices, sample size, and
advanced topics. Journal of Consumer Psychology, 20(1), 90-98. doi:
10.1016/j.jcps.2009.09.003
IFCN, & ICARE. (2013). Dairy Report 2013. Kiel, Germany: International Farm
Comparison Network.
Ivens, B. S. (2005). Flexibility in industrial service relationships: The construct,
antecedents, and performance outcomes. Industrial Marketing
Management, 34(6), 566-576. doi: 10.1016/j.indmarman.2004.10.007
Jang, W., & Klein, C. (2011). Supply chain models for small agricultural enterprises.
Annals of Operations Research, 190(1), 359-374. doi:
10.1007/s10479-009-0521-8
Kähkönen, A.-K., & Virolainen, V. M. (2011). Sources of structural power in the
context of value nets. Journal of Purchasing and Supply Management, 17(2),
32 Klemperer, P. (1987). Markets with consumer switching costs. The Quarterly
Journal of Economics, 102(2), 375-394. doi: 10.2307/1885068
Kumar, N., Scheer, L. K., & Steenkamp, J.-B. E. M. (1995). The effects of perceived
interdependence on dealer attitudes. [Article]. Journal of Marketing
Research, 32(3), 348-356. doi: 10.2307/3151850
Lam, S. Y., Shankar, V., Erramilli, M. K., & Murthy, B. (2004). Customer value,
satisfaction, loyalty, and switching costs: An illustration from a
Business-to-Business service context. Journal of the Academy of Marketing Science,
32(3), 293-311. doi: 10.1177/0092070304263330
Maloni, M., & Benton, W. C. (2000). Power influences in the supply chain. Journal
of Business Logistics, 21(1), 49-74.
Meehan, J., & Wright, G. H. (2012). The origins of power in buyer–seller
relationships. Industrial Marketing Management, 41(4), 669-679. doi:
10.1016/j.indmarman.2011.09.015
Muthén, L., & Muthén, B. (2012). Mplus User’s Guide (7th ed.). Los Angeles, CA:
Muthén & Muthén.
NSS. (2013a). Food Security and Poverty in Armenia in 2012 January-December.
Yerevan: National Statistical Service of Armenia.
NSS. (2013b). Regional Statistical Yearbook: Agriculture. Yerevan: National
Statistical Service of Armenia.
Nyaga, G. N., Lynch, D. F., Marshall, D., & Ambrose, E. (2013). Power asymmetry,
33 partner. Journal of Supply Chain Management, 49(3), 42-65. doi:
10.1111/jscm.12011
Perekhozhuk, O., Glauben, T., Teuber, R., & Grings, M. (2014). Regional-level
analysis of oligopsony power in the Ukrainian dairy industry. Canadian
Journal of Agricultural Economics, forthcoming. doi: 10.1111/cjag.12037
Pinnington, B. D., & Scanlon, T. J. (2009). Antecedents of collective-value within
business-to-business relationships. European Journal of Marketing,
43(1/2), 31-45. doi: 10.1108/03090560910923229
Ramsay, J. (1996). Power measurement. European Journal of Purchasing & Supply
Management, 2(2–3), 129-143. doi: 10.1016/0969-7012(96)00002-0
Raven, B. H. (1993). The bases of power: origins and recent developments. Journal
of Social Issues, 49(4), 227-251. doi: 10.1111/j.1540-4560.1993.tb01191.x
Sadler, M. (2006). Vertical coordination in the cotton supply chains in Central Asia.
In J. F. M. SWinnen (Ed.), The Dynamics of Vertical Coordination in Agrifood
Chains in Eastern Europe and Central Asia: Case Studies (pp. 73-114).
Washington: World Bank.
Sauer, J., Gorton, M., & White, J. (2012). Marketing, cooperatives and price
heterogeneity: evidence from the CIS dairy sector. Agricultural Economics,
43(2), 165-177. doi: 10.1111/j.1574-0862.2011.00574.x
Shepherd, A. (1997). Market Information Services: Theory and Practice. Rome: FAO.
Simons, D., Francis, M., Bourlakis, M., & Fearne, A. (2003). Identifying the
determinants of value in the UK red meat industry: a value chain analysis
34 Spekman, R. E. (1988). Strategic supplier selection: Understanding long-term
buyer relationships. Business Horizons, 31(4), 75-81. doi:
10.1016/0007-6813(88)90072-9
Swinnen, J. F. M., & Vandeplas, A. (2010). Market power and rents in global supply
chains. Agricultural Economics, 41, 109-120. doi:
10.1111/j.1574-0862.2010.00493.x
Terawatanavong, C., Whitwell, G. J., Widing, R. E., & O'Cass, A. (2011).
Technological turbulence, supplier market orientation, and buyer
satisfaction. Journal of Business Research, 64(8), 911-918. doi:
10.1016/j.jbusres.2010.09.003
Touboulic, A., Chicksand, D., & Walker, H. W. (2012). Power in large buyer–small
supplier relationships in sustainable supply chains. Piccola Impresa/Small
Business(2), 13-28. doi: 10.14596%2Fpi.24
Urutyan, V. (2009). The Role of Milk Marketing Cooperatives in the Recovery of the
Armenian Dairy Sector. Paper presented at the 19th Annual World Forum
& Symposium of the International Food and Agribusiness Management
Association Budapest, Hungary.
Urutyan, V., Aleksandryan, M., & Hovhannisyan, V. (2006). The Role of Specialized
Agricultural Credit Institutions in the Development of the Rural Finance
Sector of Armenia: Case of Credit Clubs. Paper presented at the International
Association of Agricultural Economists Annual Meeting, Gold Coast,
35 Van Der Meer, C. L. J. (2006). Exclusion of small-scale farmers from coordinated
supply chains. In R. Ruben, M. Slingerland & H. Nijhoff (Eds.), Agro-food
Chains and Networks for Development, Amsterdam (pp. 209-218).
Dordrecht: Springer.
Wagner, S. M., Coley, L. S., & Lindemann, E. (2011). Effects of suppliers' reputation
on the future of buyer-supplier relationships: the mediating roles od
outcome fairness and trust Journal of Supply Chain Management, 47(2),
29-48. doi: 10.1111/j.1745-493X.2011.03225.x
White, H. M. F. (2000). Buyer-supplier relationships in the UK fresh produce
industry. British Food Journal, 102(1), 6-17. doi:
10.1108/00070700010310605
Williamson, O. E. (1983). Markets and Hierarchies: Analysis and antitrust
implications. New York: Free Press.
Winklhofer, H. M., & Diamantopoulos, A. (2002). Managerial evaluation of sales
forecasting effectiveness: A MIMIC modeling approach. International
Journal of Research in Marketing, 19(2), 151-166. doi:
10.1016/S0167-8116(02)00066-6
Zhao, X., Huo, B., Flynn, B. B., & Yeung, J. H. Y. (2008). The impact of power and
relationship commitment on the integration between manufacturers and
customers in a supply chain. Journal of Operations Management, 26(3),
36 Table 1: Armenian Dairy Sector Indicators, 2008-2012
Unit 2008 2009 2010 2011 2012
Number of cows 1,000 head 283 274 273 283 303
Production of milk 1,000 tons 662 616 601 602 618
Average milk yield per cow kg 1992 2027 2035 2127 2039
Average fat content % 3.8 3.75 3.77 3.79 3.79
Average protein content % 2.93 2.94 3.03 3.02 3.02
Milk delivered to processors 1,000 tons 310 264 225 241 324
Household / on farm use 1,000 tons 352 352 376 361 294
37 Table 2: Quota sampling plan
Milk production by region Proportional sampling
Final sample
‘000 tonnes
% of total
Yerevan City 2.2 0.4 1 0
Aragatsotn 76.5 12.4 37 20
Ararat 38.2 6.2 19 23
Armavir 37.4 6.0 18 0
Gegharkunik 116.3 18.8 56 57
Lori 77.7 12.6 38 39
Kotayk 53.5 8.7 26 20
Shirak 101.5 16.4 49 71
Syunik 57.2 9.3 28 60
Vayots Dzor 21.1 3.4 10 0
Tavush 36.6 5.9 18 10
Total 618.2 100.0 300 300
38 Table 3: Reflective Measurement Model for Buyer Trustworthiness
Standardized Coefficient (β)
S.E .
Sig. (p-value)
Trust1 (y1) .70 .04 .00
Trust2 (y2)*✚ .49 .06 .00
Trust3 (y3) .65 .05 .00
Trust4 (y4) .65 .05 .00
Trust5 (y5) .65 .05 .00
Trust6 (y6)*✚ .44 .06 .00
Trust7 (y7)* .64 .05 .00
39 Table 4: MIMIC Model – Antecedents & Consequences
Model No. Standardized Coefficient (β) S.E. Sig. (p-value)
Model 1 Covariates .00
Direct Effects No. Commercial Buyers (x1) .12 .06 .05
Switching Ability (x2) -.31 .08 .00
Buyer Substitution (x3) -.26 .07 .00
Supplier Size (x4) .11 .06 .05
Membership of mkt coop (x5) .21 .06 .00
Consequences
Buyer TrustworthinessSupplier Satisfaction .57 .05 .00
Buyer Trustworthiness Production Quantity .61 .05 .00
Buyer Trustworthiness Production Quality .61 .05 .00
40 Figure 1: Conceptual Model
Direct Effects
ξ
ε
ε
ε
ε
ε
ε
ε
ϒ1 ϒ2ϒ3 ϒ4 ϒ5 ϒ6
ϒ7
BUYER TRUST-WORTHINESS
Switching Ability (x2) No. Commercial Buyers (x1)
Buyer Substitution (x3)
Supplier Size (x4)
Membership of Cooperative (x5)
Supplier Satisfaction
Production Quantity
Production Quality ξ
ξ ξ + + + H8 + H7 +
41 Appendix A: Variable operationalization for MIMIC model
Formative Variables: Dimensions of Relative Supplier – Buyer Power
No. Commercial Buyers (x1) Supplier estimate of potential number of other commercial
buyers for their milk
Switching Ability (x2) Ease of which supplier can switch to another main buyer. 5
point scale where 1 = very easy and 5 = very difficult
Buyer Substitution (x3) Ease with which buyer perceived as being able to replace
supplier. 5 point scale where 1 = very difficult and 5 = very easy
Supplier Size (x4) Number of milking cows of productive age
Cooperation (x5) Membership of milk marketing cooperative. Dummy
variable where 1 = member and 0 non-member
Latent Variable
Buyer trustworthiness 7 item scale of trust derived from (Doney and Cannon (1997)). Likert scale, where 1 = strongly agree and 5 = strongly disagree. The specific items are:
(y1): Our main buyer keeps the promises it makes
(y2): Our main buyer is not always honest with us (RS)*
(y3): Our main buyer is genuinely concerned that our
business succeeds
(y4): When making important decisions, our main buyer
considers our welfare as well as its own
(y5): We trust our main buyer keeps our best interests in
mind
(y6): We find it necessary to be cautious with our main
buyer (RS)*
(y7)Our main buyer is trustworthy
Endogenous Indicators
Supplier satisfaction (SAT) Overall supplier satisfaction with their relationship with their main buyer. 5 point scale, where 1 = very dissatisfied and 5 = very satisfied
Production Quantity (QNT) “Being able to sell to our main buyer has improved production quantity”, Likert scale where 1 = strongly disagree and 5 = strongly agree
Production Quality (QLT) “Being able to sell to our main buyer has improved production quality”, Likert scale where 1 = strongly disagree and 5 = strongly agree
42 Appendix B: Summary Statistics for Variables included in the Model
Variable Mean S.D Min. Max.
Trust1 (y1) 4.08 .78 1 5
Trust2 (y2) 3.93 1.07 1 5
Trust3 (y3) 3.85 .76 1 5
Trust4 (y4) 3.44 .93 1 5
Trust5 (y5) 4.27 .64 2 5
Trust6 (y6) 2.95 1.14 1 5
Trust7 (y7) 3.76 1.04 1 5
No. of other commercial buyers (x1) 2.03 1.87 0 20
Switching Ability (x2) 2.16 .97 1 5
Buyer Substitution (x3) 2.80 1.05 1 5
Supplier Size (x4) 13.36 8.55 3 100
Membership of mkg. co-op (x5) NA NA NA NA
Satisfaction (SAT) 4.02 .73 2 5
Production Quantity (QNT) 3.80 .98 1 5
Production Quality (QLT) 3.63 .88 1 5


![From tools to technosphere [Von den Werkzeugen zur Technosphäre]](data:image/gif;base64,R0lGODlhAQABAIAAAP///wAAACH5BAEAAAAALAAAAAABAAEAAAICRAEAOw==)