Article
Preparation and Evaluation of a Coconut
Shell-Based Activated Carbon for CO
2/CH
4Separation
Amna Abdeljaoued1,2, Nausika Querejeta Montes3, Inés Durán3, Noelia Álvarez-Gutiérrez3, Covadonga Pevida García3, Mohamed Hachemi Chahbani1,4
1LR11ES54-Laboratory of “chemical processes and industrials systems”, Gabès University, Gabès, Tunisia 2National School of Engineers of Gabes (ENIG), Gabès University, Omar Ibn Elkhattab Street, Zrig, Gabès
6029, Tunisia
3 Instituto Nacional del Carbón, INCAR- CSIC, c/ Francisco Pintado Fe 26, 33011 Oviedo, Spain. 4 Higher Institute of Applied Sciences and Technology of Gabes, University of Gabes, Omar Ibn
Elkhattab Street, Zrig, Gabes 6029, Tunisia
* Correspondence: [email protected]
Abstract: Biomass is a widely distributed and renewable source of carbon. The main objective of this work is to produce an activated carbon from coconut shells with suitable characteristics to separate CO2 from biogas. The textural characterization of the adsorbent has been determined. Pure component adsorption isotherms of CO2 and CH4 at 30, 50 and 70 °C have been measured. Moreover, the performance of the produced activated carbon, as potential adsorbent for CO2 capture from a CO2/CH4 gas mixture has been evaluated under dynamic conditions in a purpose-built fixed-bed setup.
Keywords: biogas purification; coconut shells; biomass valorization; textural characterization; adsorption isotherms; breakthrough curves.
1 Introduction
Biogas is a biofuel that is naturally produced by decomposition of various types of organic matter. Upgrading of biogas has gained important attention due to the steady growth in global energy demand, coupled with the depletion of fossil fuel resources, their unaffordable prices and the environmental damage they cause. Biogas consists mainly of methane and carbon dioxide. The energy content of raw biogas is much lower than natural gas due to the presence of carbon dioxide. Thus, to increase its heating value, the carbon dioxide content must be reduced. On the economic side, the removal of CO2 is the most critical step in biogas upgrading.
Among the various processes proposed to remove CO2 from biogas, namely adsorption, absorption, membrane and cryogenic separation, pressure swing adsorption (PSA) processes are often used [1-7].
The selection of the adsorbent is a key factor for the efficient operation of a pressure swing adsorption unit. The properties of the adsorbents are one of the most important aspects of unit performance for a determined cycle configuration [8]. A wide variety of solid adsorbents has been investigated for the separation of CO2 from gas streams, such as calcium oxides, zeolites, activated carbons, hydrotalcites, metal–organic framework (MOF) materials and supported amines [9]. The use of biomass as precursor for the preparation of carbonaceous materials for greenhouse gas emissions abatement has shown a lot of interest [10-15].
It is well known that activated carbons can be synthesized from a wide range of precursors given that they present low levels of inorganic compounds (ash content) and high carbon content. Many carbonaceous materials such as peat, wood, lignite, coal and nut shells are being used in the commercial production of activated carbons. The coconut shell is appropriate for the
production of microporous activated carbons because of its excellent natural structure and low ash content [16, 17].
Two conventional methods for biomass activation have been reported: physical and chemical activation procedure. Chemical activation is considered an ineffective environmental procedure as it uses solvents to dissolve reagents, extract and wash products, separate mixtures, clean reaction apparatus and disperse products for practical applications. On the contrary, physical activation is considered as eco-friendly compared to chemical activation. In this study, a single step physical activation method was selected.
The main purpose of this work is to produce an activated carbon from dry coconut shells (CNS) using a single step physical activation method and to evaluate the textural characteristics and the performance of the produced adsorbent to separate CO2 from biogas streams.
2 Material and methods 2.1Precursor material
Coconut shells were selected as precursor material for the preparation of the activated carbon. The raw material was ground and sieved and a particle size between 1 and 3 mm was selected. Proximate analysis was conducted in a Setaram TAG24 thermogravimetric analyzer according to the UNE 32-004-84 standard. Ultimate analyses were carried out in a LECO VTF-900 and in a LECO CHNS-932, respectively.
2.1.1 Non-isothermal profile
Non-isothermal mass loss profile of the precursor material in carbon dioxide atmosphere was determined using a thermogravimetric analyzer (Setaram TGA92) in order to elucidate optimal activation time and temperature.
The sample was placed in a platinum crucible (70μL) and was dried for one hour at 100 °C in nitrogen flow; then the sample was heated up to 1000 °C at a heating rate of 15 °C/min under a total flow rate of 50 mL/min of carbon dioxide (activating agent) and maintained at this final temperature during 30 min.
2.2Activated carbon production
Once the activation conditions were selected, the production of the activated carbon was initiated. A vertical tubular kiln was used for that purpose. The sample was placed in a quartz jacketed reactor and then introduced in the vertical tubular kiln. The experimental set-up has been described elsewhere [18].
After a drying step, the reactor was purged with N2 for 30 minutes at room temperature to remove air from the system, and then heated up to 900 °C at a heating rate of 10 °C/min with a gas flow rate of 100 mL/min of carbon dioxide. The temperature was controlled by a thermocouple introduced inside the reactor. The sample was kept at this temperature in carbon dioxide atmosphere for 73 min. Then the gas was switched to nitrogen and the sample was cooled down to ambient temperature.
The CO2 adsorption capacity of the synthetized activated carbon was tested in a Setaram TGA 92 thermogravimetric analyzer following the procedure described elsewhere [19].
2.2.1 Textural characterization
The produced activated carbon was characterized by physical adsorption of N2 at -196 °C in a Micromeritics ASAP 2010 and adsorption of CO2 at 0 °C using a Micromeritics TriStar 3000 volumetric apparatus.
measured using an Accupyc 1330 apparatus at 35 °C. Dubinin–Radushkevich (DR) equation and Dubinin-Astakhov (DA) equations were used to calculate the micropore volume (W0) [21] assuming a density of the adsorbed phase of 0.808 cm3/g for N2 and 1.023 cm3/g for CO2, a cross sectional area of 0.162 nm2 for N2 and 0.187 nm2 for CO2 and finally an affinity coefficient of 0.34 for N2 and 0.36 for CO2. The average micropore width was calculated by means of the Stoeckli– Ballerini relation [22]. The apparent density was determined at 0.1 MPa in a Micromeritics Autopore IV 9500 mercury porosimeter.
2.3Adsorption isotherms
In order to assess the performance of the prepared activated carbon for biogas upgrading, pure CO2 and CH4 adsorption isotherms measurements were carried out using a high pressure magnetic suspension balance, Rubotherm-VTI.
Three different temperatures (30, 50, and 70 °C) and pressure up to 10 bars were selected for the study. Prior to adsorption, the measuring cell is filled with approximately 1 g of sample, which is dried under vacuum at 100 °C for 120 min. The cell is then cooled down to the measuring temperature, and then pressurized with the desired gas in a stepwise mode. The variation of the weight of the adsorbent sample as well as temperature and pressure are collected and recorded when equilibrium is achieved. Experiments with helium were performed to account for the buoyancy correction. The absolute amount of CO2 and CH4 adsorbed over the pressure range tested were estimated following the procedure described in a previous work [23].
2.4Breakthrough measurements
In order to study the performance of the synthesized adsorbent for CO2/CH4 separation under dynamic conditions, breakthrough experiments with binary gas mixtures were performed in a lab-scale fixed-bed reactor packed with the adsorbent material. The experimental set-up is described in detail elsewhere [24].
The amount of gas flow into the fixed bed was monitored with a mini CORIFLOW meter from Bronkhorst. The composition of the gas of the outlet flow was determined using a dual channel micro-gas chromatograph, Varian CP-4900, fitted with a thermal conductivity detector (TCD) in which He and Ar were used as the carrier gases.
The column was packed with the coconut shell activated carbon to evaluate the dynamics of adsorption of CO2 and CH4. A simulated biogas CO2/CH4 mixture (50/50 vol. %) was fed (30 mL/min STP) to the adsorption unit and the adsorption performance of the sample was evaluated under isothermal conditions (30 °C) and at atmospheric pressure. The adsorbed gases were completely desorbed by flowing 50 mL/min STP of He and raising the temperature of the bed to 180 °C under atmospheric pressure.
Six consecutive adsorption-desorption cycles were conducted to test the reproducibility of the system, where adsorption proceeded until saturation and desorption was extended to full regeneration of the activated carbon bed. During the adsorption step, the CO2 and CH4 concentrations in the column effluent gas were continuously monitored as a function of time (breakthrough curve), and equilibrium dynamic adsorption capacity of the adsorbent was calculated after the outlet CO2 concentration equaled that of the inlet stream.
Breakthrough time, tb, defined as the time it takes for CO2 detection at the outlet adsorption column, and equilibrium CO2 adsorption capacity, were determined as an average of the values obtained from the six consecutive cycles [25].
3.1Precursor material
The results obtained from the proximate and ultimate analyses of CNS are summarized in Table 1. Proximate analysis shows that coconut shells are characterized by low ash content (0.42 wt. %), which is a desirable feature for activated carbons production. Ultimate analysis shows that the raw material possesses a high carbon content (i.e. 51.6 wt. %) and low hydrogen and oxygen contents. In addition, the absence of sulfur in the raw material eliminates the possibility of sulfur dioxide emission during the production process. These data make CNS a promising material to be used as an activated carbon precursor.
Table 1. Proximate and ultimate analyses of the raw coconut shells (CNS).
Proximate analysis (wt %) Ultimate analysis (wt %, daf)
Sample Moisture Ash (db) C H N S O
CNS 12.55 0.42 51.6 5.6 0.1 0 42.7
db: dry basis; daf: dry ash free basis.
3.1.1 Non-isothermal profile
Weight loss of the coconut shells during heat treatment under carbon dioxide is shown in Figure 1. The figure shows that the greater weight losses for CCS mainly occur between 27 and 627 °C. The initial weight loss below 100 °C corresponds to moisture and other guest molecules adsorbed on the material. Waste agricultural biomass commonly consists of cellulose, hemi-cellulose and lignin. The second and third peaks in the DTG curve (derivative of the TG curve) correspond to the decomposition of hemi-cellulose and that of cellulose, respectively.
Figure 1. Mass loss and rate of mass loss profiles for CNS. The black line corresponds to the TG curve and the red line represents the DTG curve.
Based on the experimental results of the mass loss profile, the activation temperature was set at 900 °C and three activation times were selected, 35, 73 and 115 minutes, which correspond to the following yields, as estimated from equation 1: 21.51, 16.92, and 10.47 %, respectively.
of the sample after activation (g)
(%) = 100 (1) of dried sample (g)
mass Yield
initial mass
3.2 CNS activated carbon characterization and evaluation 3.2.1 Textural characterization
-3.5 -3 -2.5 -2 -1.5 -1 -0.5 0 0.5
0 5 10 15 20 25 30 35 40 45 50
20 120 220 320 420 520 620 720 820 920
D
T
G
(
m
g
/ m
in
)
T
G
(
m
g)
Figures 2 and 3 show the adsorption isotherms of N2 and CO2 at -196 and 0 °C, respectively, on the activated carbon produced from CNS.
Based on IUPAC (International Union of Pure and Applied Chemistry) classification the N2 adsorption isotherm is of type I; this indicates that the produced activated carbon is strictly microporous. As can be noted from Figure 2, the nitrogen uptake is high at low relative pressure (p/p0 < 0.1) and can be explained by micropores filling. As expected, the use of CO2 as activating agent in a single step physical activation method mainly develops microporosity in biomass activated carbons [26].
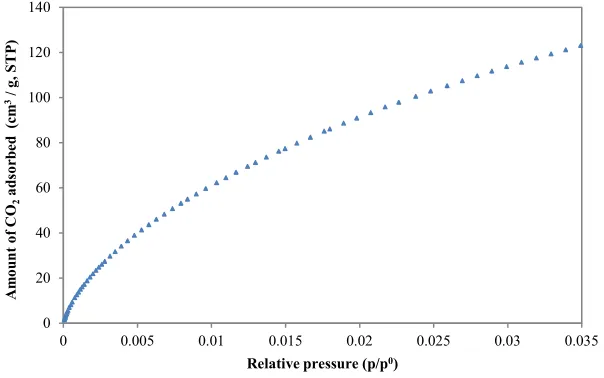
Figure 2. Adsorption isotherm of N2 at -196 °C for the synthetized activated carbon. CO2 adsorption in Figure 3 assesses the narrower microporosity (< 1 nm). The shape of the CO2 isotherm is characteristic of activated carbons with a wide narrow micropore size distribution.
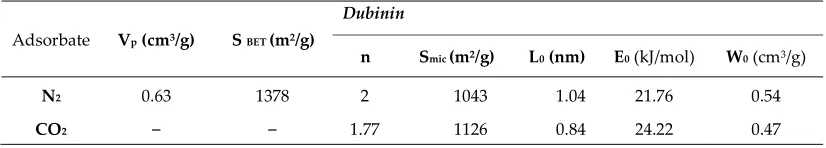
Figure 3. Adsorption isotherms of CO2 at 0 °Cfor the synthetized activated carbon. As shown in Table 2, the BET surface area obtained, 1378m2/g, is significantly high and it is within the acceptable range for a commercial activated carbon (500-1500 m2/g). Micropores (W0) account for more than 85 % of the total volume of pores (Vp). It is also observed that average narrow micropore size, L0 as estimated from CO2 adsorption, is close to the average micropore size, L0 as estimated from N2 adsorption.
0 50 100 150 200 250 300 350 400 450
0 0.1 0.2 0.3 0.4 0.5 0.6 0.7 0.8 0.9 1
A
m
ou
n
t
of
N2
ad
so
rb
ed
(
cm
3/ g
, S
T
P
)
Relative pressure (p/p0)
0 20 40 60 80 100 120 140
0 0.005 0.01 0.015 0.02 0.025 0.03 0.035
A
m
ou
n
t
of
C
O2
ad
so
rb
ed
(
cm
3/ g
, S
T
P
)
Table 2. Main textural characteristics of the produced CNS activated carbon.
Adsorbate Vp (cm3/g) S BET (m2/g)
Dubinin
n Smic (m2/g) L0 (nm) E0 (kJ/mol) W0 (cm3/g)
N2 0.63 1378 2 1043 1.04 21.76 0.54
CO2 ̶ ̶ 1.77 1126 0.84 24.22 0.47
3.2.2 Adsorption Isotherms
Three different models to account for the equilibrium of adsorption, namely Sips, Toth and Dual-Site Langmuir (D-S), were used to fit the experimental adsorption isotherm data collected at 30, 50 and 70 °C (equations 2- 8).
The first isotherm model used for the representation of the experimental data is the Sips model whose equation is given as follow:
1
1
2
1
n s
n
q bP
q
bP
where q represents the concentration of the adsorbed gas and qs the saturation capacity, P the
adsorption pressure and b the affinity constant. The parameter n indicates the heterogeneity of the system and its value is usually greater than unity; therefore, the larger the value of n, the more heterogeneous is the system.
qs was considered temperature independent whereas n and b were considered temperature
dependent as shown in equations (3) and (4) [27].
0 0
0
exp
Q
T
1 3
b b
RT
T
0
0
1 1
1 T 4
n n
T
In the equations above, b0, n0 and α are the constants associated with the
temperature-dependent equations; R is the ideal gas constant and T is the temperature. Q is the isosteric heat of adsorption at a fractional loading of 0.5 and T0 is the reference temperature which, in this
case, is 30 °C.
The second isotherm model used for the fitting of the experimental data is the Toth model which is represented by equation 5:
*
* *
1 *
(5)
1
s
t t
b P
q
q
b P
Where q* is the concentration of the adsorbed species, q*s is the saturation capacity and P is
the adsorption pressure. The parameters b* and t are specific for the adsorbate-adsorbent pairs.
Thus, as n in the Sips equation, the parameter t characterizes the heterogeneity of the system. However, t is usually less than unity.
* 0
0
1
T
6
t t
T
In equation 6, t0 and α⁎ are the constants associated with the temperature dependency of t.
The dependence of b⁎ with temperature is similar to the dependence of b in the Sips model, but
in this case, Q accounts for the isosteric heat of adsorption at zero fractional loading.
Finally, the third isotherm model applied for the fitting of the experimental data is the Dual-Site Langmuir model (D-S) (equation 7). This model describes the adsorption of a pure component on a heterogeneous adsorbent which is composed of two homogeneous but energetically different sites [28- 30].All assumptions of Langmuir model apply to each site, with no interactions between the two.
1 1 2 2
1 2
7
1
1
s s
q b P
q b P
q
b P
b P
where qs1 and qs2 are respectively the saturation capacities at sites 1 and 2, so the total
saturation capacity is the sum of those of each site (qs = qs1 + qs2); b1 and b2 are the affinity or free
energy parameters for sites 1 and 2, respectively, which are considered temperature dependent as expressed in equation 8, where the subscript j represents the free energy level of site 1 or 2, b0,j are the pre-exponential factors or the adsorption entropies, and Ej are their corresponding
adsorption energies.
0, exp j=1,2 8
j
j j
E
b b
RT
The comparison between experimental and fitted data of adsorption of pure CO2 and CH4 on the CNS activated carbon is shown in Figure 4 and 5. The experimental adsorption isotherms of pure CO2 and CH4 on the CNS activated carbon at 30, 50, and 70 °C are shown as symbols. The dashed lines with symbols correspond to the Sips, Toth and Dual Site Langmuir (D-S) model fitting.
Adsorption capacity is one of the key factors to estimate the gas separation aptitude of an adsorbent. As can be noted CO2 uptake capacities of CO2 and CH4 increased by increasing the pressure but decrease when the temperature increase. This is the expected behaviour for a physical adsorption based process. The produced activated carbon presents a significantly higher CO2 adsorption capacity when compared to that of CH4 over the entire pressure and temperature range evaluated.
0 0.5 1 1.5 2 2.5 3 3.5 4 4.5 5
0 2 4 6 8 10 12
A
bs
ol
ut
e
qu
an
ti
ty
a
ds
or
b
ed
(
m
m
ol
/
g)
Pressure (bar)
D-S 30°C Exp 30°C Exp 50°C
Exp 70°C D-S 50°C D-S 70°C
Sips 30°C Sips 50°C Sips 70°C
Figure 4. CH4 isotherm at different temperatures (dashed line with symbols for Sips, Toth and Dual-Site Langmuir models fitting and symbols for experimental data).
Figure 5. CO2 isotherm at different temperatures (dashed line with symbols for Sips, Toth and Dual-Site Langmuir models fitting and symbols for experimental data).
Fitting of the models to the experimental data was done with the Excel tool Solver, and the values of the different fitting parameters were calculated by minimizing the minimum residual sum of squares (SSR) i.e., by minimizing the differences between the predicted and experimental amounts adsorbed at all temperatures for a particular adsorbate-adsorbent system. The objective function that was used in Solver is given by equation 9.
31
2
exp, mod,
1
( )
SSR % 100 (9)
N
i i
T i
T
q q
N
Where qexp,iand qmod,i are the experimental and predicted amounts adsorbed, respectively, and
N is the number of data points.
Figures 4 and 5 show high degree of goodness of the fit between experimental and predicted values for the three models. The optimal fitting parameters and the values of the minimum residual sum of squares (SSR) are reported in Table 3.
Table 3. Fitting parameters of the dual-site Langmuir, Sips and Toth models to pure component CO2 and CH4 adsorption isotherms for CNS activated carbon.
Model Component T (°C) qs1, qs2, qsand qs*
(mol/kg) b
1, b2, b and b*
(kPa) nt (Sips) (Toth)
*
SSR (%)
Dual-site CH4
30
1.00 6.63
0.0137 - -
0.04 0.0012
50 0.0078 0.0008 - -
70 0.0049 0.0006 - -
CO2
30
1.86 10.50
0.0235 - -
0.20 0.0017
50 0.0133 0.0010 - -
70 0.0078 0.0006 - -
0 1 2 3 4 5 6 7 8 9
0 2 4 6 8 10 12
A
b
so
lu
te
q
ua
n
ti
ty
a
d
so
rb
ed
(m
m
ol
/
g
)
Pressure (bar)
Exp 70°C Exp 30°C Exp 50°C
D-S 30°C D-S 50°C D-S 70°C
Sips 30°C Sips 50°C Sips 70°C
Sips
CH4
30
8.32 0.0013 1.21 0.25 0.03
50 0.0008 1.20
70 0.0006 1.18
CO2
30
14.25 0.0016 1.30 0.22 0.12
50 0.0009 1.31
70 0.0006 1.29
Toth
CH4
30
11.64 0.0022 0.54 0.21 0.03
50 0.0013 0.56
70 0.0008 0.57
CO2
30
20.73 0.0039 0.47 0.12 0.13
50 0.0022 0.47
70 0.0013 0.48
As can be noted in Table 3, the maximum adsorption capacities predicted by the three models for CO2 are always much higher than those for CH4. Such difference in adsorption capacity is advantageous for the separation via adsorption. The Toth’s predictions of the adsorbed amounts at saturation are higher than those estimated by Sips and dual site Langmuir, respectively. This difference can be explained by the fact that experimental data only correspond to fractional loadings of up to about 0.5 [31].
It can be observed that the temperature increase reduces the values of b*, b1, b2 and b. This
suggests that an increase in temperature leads to less attracted molecules to the surface, in other words, molecules have a weaker affinity towards the adsorbent at higher temperature.
The n constant in Sips model and the t constant in the Toth model reflect the degree of heterogeneity of the system. As can be seen in Table 3, the heterogeneity of the system remains practically unchanged with the temperature increase.
3.2.3 Breakthrough curves
Figure 7 shows an example of six-consecutive adsorption and desorption experiments for a 50/50 vol. % CO2/CH4 binary gas mixture fed to the fixed-bed adsorption unit at 1 bar. He was used as carrier gas during the preconditioning and regeneration steps. It is observed that during the initial period preceding the saturation of the bed, both components in the feed gas, CO2 and CH4, are completely adsorbed on the CNS activated carbon bed. Then, as expected according to the data from the adsorption isotherms (see Figures 4 and 5), CH4 breaks through first.
Figure 6. Complete breakthrough adsorption experiments consisting of six consecutive adsorption-desorption cycles for a 50/50 vol. % CO2/CH4 binary gas mixture at 1 bar. (Solid lines
with symbols represent the concentration profiles of CH4, CO2 and He. The blue solid line represents the temperature).
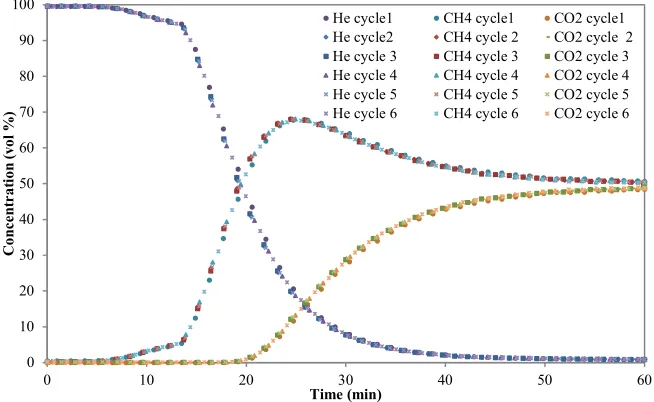
Figure 7. Breakthrough curves for a 50/50 vol. % CO2/CH4 binary gas mixture at 1 bar. (Symbols represent CO2 and CH4 concentrations for different cycles).
From Figure 7, it has to be noted that consecutive breakthrough curves overlap showing that the adsorbent was totally regenerated in each cycle and it maintained a stable adsorption performance over the six consecutive adsorption-desorption cycles. On the basis of the timing observed in the CH4 and CO2 concentration fronts, the CO2/CH4 separation is technical feasible on the coconut shell-based activated carbon. For instance, the CO2 adsorption front reaches the bed outlet after approximately 18 min whereas for CH4 a much shorter time is required (6 min).
The CO2 and CH4 adsorption capacities of the produced activated carbon are estimated to be 1.86 and 0.52 mol/kg, respectively, at 30°C and 1 bar.
0 20 40 60 80 100 120 140 160 180 200
0.00 20.00 40.00 60.00 80.00 100.00 120.00
0.00 100.00 200.00 300.00 400.00 500.00 600.00 700.00 800.00
Time (min)
T
em
pe
ra
tu
re
(
°C
)
C
on
ce
nt
ra
ti
on
(v
ol
%
)
He CH4 CO2 T
0 10 20 30 40 50 60 70 80 90 100
0 10 20 30 40 50 60
C
on
ce
nt
ra
ti
on
(v
ol
%
)
Time (min)
He cycle1 CH4 cycle1 CO2 cycle1
He cycle2 CH4 cycle 2 CO2 cycle 2
He cycle 3 CH4 cycle 3 CO2 cycle 3
He cycle 4 CH4 cycle 4 CO2 cycle 4
He cycle 5 CH4 cycle 5 CO2 cycle 5
For the design of the Pressure Swing Adsorption process, it is essential to determine precisely the breakthrough time of CO2 at the adsorption pressure chosen. This could be done experimentally or using a simulation tool with a model already validated. CH4, separated from CO2, has to be collected from the bed exit during the period preceding the breakthrough of CO2. Just before CO2 breaks through, collection of CH4 should be stopped and the bed undergoes the next step according to the retained PSA cycle design (equalization, depressurization, regeneration, etc.).
4 Conclusions
Coconut shells can be used as suitable raw material to produce a microporous activated carbon for CO2 adsorption from biogas streams.
Pure component CO2 and CH4 adsorption isotherms were carried out at three different
temperatures. As expected, CO2 is the strongest adsorbate. Afterwards, breakthrough
experiments consisting of six consecutive adsorption–desorption cycles were conducted in a purpose-built lab-scale fixed-bed reactor. The activity of the synthesized activated carbons was maintained throughout the experiments, showing a very good cyclability and regenerability under the evaluated conditions.
From the preliminary data presented, it can be concluded that the synthesized coconut shell-based activated carbon shows suitable characteristics to be applied to the CO2 separation from biogas streams. Further research is currently ongoing.
Acknowledgements
This work was funded by The Tunisian Ministry of Higher Education and Scientific Research.
References
[1] S. C.Sarkar; A.Bose, A. Role of activated carbon pellets in carbon dioxide removal. Energy Convers.Manage. 1997, 38, S105-S110.
[2] M. S .Horikawa; F.Rossi; M. L.Gimenes; C. M. M Costa; M. G. C .da Silva,. Chemical absorption of H2S for biogas
purification. Braz. J. Chem. Eng. 2004, 21 (3), 415-422.
[3] Z. Y, Yeo; T. L, Chew; P. W. Zhu.; , A. R .Mohamed; S.-P. Chai, Conventional processes and membrane technology for carbon dioxide removal from natural gas: A review. J. Nat. Gas Chem. 2012, 21 (3), 282-298.
[4] M. J .Tuinier; van Sint Annaland, M. Biogas Purification Using Cryogenic Packed-Bed Technology. Ind. Eng. Chem. Res. 2012, 51 (15), 5552-5558.
[5] Nobuyuki Shigaki , Yasuhiro Mogi, Takashi Haraoka and Ikuhiro Sumi.Reduction of Electric Power Consumption in CO2-PSA with Zeolite 13X Adsorbent.Energies 2018, 11(4), 900.
[6] Gang Xu, Feifei Liang, Yongping Yang , Yue Hu, Kai Zhang and Wenyi Liu.An Improved CO2 Separation and Purification System Based on Cryogenic Separation and Distillation Theory. Energies 2014, 7(5), 3484-3502.
[7] Amna Abdeljaoued, Frederico Relvas, Adélio Mendes,Mohamed Hachemi ChahbaniSimulation and experimental results of a PSA process for production of hydrogen used in fuel cells. Journal of Environmental Chemical Engineering 2018, 6, 338– 355.
[8] BJ .Maring and PA .Webley. A new simplified pressure/vacuum swing adsorption model for rapid adsorbent screening for CO2 capture applications. Int. J. Greenh. Gas Control 2013; 15, 16–31.
[9] Imen Ghouma , Mejdi Jeguirim , Uta Sager , Lionel Limousy , Simona Bennici , Eckhard Däuber , Christof Asbach , Roman Ligotski , Frank Schmidt and Abdelmottaleb Ouederni .The Potential of Activated Carbon Made of Agro-Industrial Residues in NOx Immissions Abatement. Energies 2017, 10(10), 1508.
[10] S. Choi, J.H. Drese, C.W. Jones, ChemSusChem 2 (2009) 796–854. [11] H. Wei, S. Deng, B. Hu, ChemSusChem 5 (2012) 2354–2360.
[12] A. Samanta, A. Zhao, G.K.H. Shimizu, P. Sarkar, R. Gupta, Ind. Eng. Chem. Res. 51 (2012) 1438–1463.
[13] Mejdi Jeguirim and Lionel Limousy .Biomass Chars: Elaboration, Characterization and Applications Energies 2017, 10(12), 2040.
[14] N. Álvarez-Gutiérrez, M.V. Gil, M. Martínez, F. Rubiera and C. Pevida. Phenol-Formaldehyde Resin-Based Carbons for CO2 Separation at sub-atmospheric pressures.Energies 2016, 9(3), 18
[15] C. Guizani, M. Jeguirim, S. Valin, L. Limousy, S. Salvador. Biomass Chars: The Effects of Pyrolysis Conditions on Their Morphology, Structure, Chemical Properties and Reactivity. Energies 2017, 10(6), 796
[17] C. John Kirubakaran, K. Krishnaiah, S. K. Seshadrit. Experimental Study of the Production of Activated Carbon from Coconut Shells in a Fluidized Bed Reactor. Ind. Eng. Chem. Res. 1991,30, 2411-2416.
[18] M.V. Gil, N. Álvarez-Gutiérrez, M. Martínez, F. Rubiera, C. Pevida, A. Morán. Carbon adsorbents for CO2 capture from
bio-hydrogen and biogas streams: Breakthrough adsorption study. Chem. Eng. J. 2015, 269,148–158.
[19] M.G. Plaza, A.S.Gonzalez, J.J.Pis, F.Rubiera, C.Pevida . Production of microporous biochars by single-step oxidation:Effect of activation conditions on CO2capture.Applied energy 114 (2014) 551-562.
[20] S. Brunauer, P.H. Emmett, E. Teller, Adsorption of gases in multimolecular layers, J. Am. Chem. Soc. 60 (1938) 309–319 [21] M.M. Dubinin.Porous structure and adsorption properties of active carbons, in: P.L. Walker (Ed.), Chemistry and Physics of
Carbon, Marcel Dekker Inc., New York, 1966, pp. 51–119.
[22] F. Stoeckli, L. Ballerini, Evolution of microporosity during activation of carbon, Fuel 70 (1991) 557–559.
[23] S. García; J .J .Pis; F.Rubiera; C.Pevida, . Predicting mixed-gas adsorption equilibria on activated carbon for precombustion CO2 capture. Langmuir 2013, 29 (20), 6042-6052.
[24] S.García; M. V .Gil; C. F .Martín,.; J. J. Pis; F.Rubiera.; C.Pevida. Breakthrough adsorption study of a commercial activated carbon for pre-combustion CO2 capture. Chem. Eng. J. 2011, 171 (2), 549- 556.
[25] M. V .Gil; N.Álvarez-Gutierrez.; Martínez.M; F. Rubiera; ́ C.Pevida; A.Moran. Carbon adsorbents for CO2 capture from
biohydrogen and biogas streams: Breakthrough adsorption study. Chem. Eng. J. 2015, 269, 148-158.
[26] F.Rodríguez-Reinoso, M .Molina-Sabio, M.T.González. The use of steam and CO2 as activating agents in the preparation of
activated carbons. Carbon.1995, 33, 15––23.
[27] D.D. Do, Adsorption Analysis: Equilibria and Kinetics, Imperial College Press, London, 1998.
[28] I. Langmuir. The adsorption of gases on plane surfaces of glass, mica and platinum. J. Am. Chem. Soc. 1918, 40, 1361-1403.
[29] J. A Ritter; S. J Bhadra; A. D Ebner. On the use of the dual process Langmuir model for correlating unary equilibria and predicting mixed-gas adsorption equilibria. Langmuir 2011, 27, 4700-4712.
[30] S. J. Bhadra; A. D Ebner; J. A Ritter. On the use of the dual process Langmuir model for predicting unary and binary isosteric heats of adsorption. Langmuir 2012, 28, 6935-6941.
[31] I.A.A.C. Esteves, M.S.S. Lopes, P.M.C. Nunes, J.P.B. Mota, Adsorption of natural gas and biogas components on activated carbon, Sep. Purif. Technol. 2008, 62, 281–296.
[32] N. Álvarez-Gutiérrez, S. García, M.V. Gil, F. Rubiera, C. Pevida. Dynamic performance of biomass-based carbons for CO2/CH4 separation. Approximation to a pressure swing adsorption process for biogas upgrading. Energy & Fuels 2016, 30,