Palpation on Virtual Model of Soft Tissue
Min Li · Jelizaveta Konstantinova ·
Emanuele L. Secco · Allen Jiang ·
Hongbin Liu · Thrishantha
Nanayakkara · Lakmal D. Seneviratne ·
Prokar Dasgupta · Kaspar Althoefer ·
Helge A. Wurdemann
the date of receipt and acceptance should be inserted later
Abstract This paper explores methods that make use of visual cues aimed at generating actual haptic sensation to the user, namely pseudo-haptics. We propose a new pseudo-haptic feedback based method capable of conveying 3D haptic information and combining visual haptics with force feedback to en-hance the user’s haptic experience. We focused on an application related to tumor identification during palpation and evaluated the proposed method in an experimental study where users interacted with a haptic device and graph-ical interface while exploring a virtual model of soft tissue, which represented stiffness distribution of a silicone phantom tissue with embedded hard inclu-sions. The performance of hard inclusion detection using force feedback only, pseudo-haptic feedback only, and the combination of the two feedbacks were compared with the direct hand touch. The combination method and direct hand touch had no significant difference in the detection results. Compared with the force feedback alone, our method increased the sensitivity by 5%, the
M. Li
School of Mechanical Engineering, Xi’an Jiaotong University, Xi’an 710049, Shaanxi, China. Tel.: +862982663707
Fax: +862982664257
E-mail: [email protected]
J. Konstantinova·E. L. Secco·A. Jiang·H. Liu·T. Nanayakkara·L. D. Seneviratne·K. Althoefer·H. A. Wurdemann
Department of Informatics, Kings College London, London, WC2R 2LS, UK. E. L. Secco
Department of Mathematics and Computer Science, Hope University, Liverpool, UK. L. D. Seneviratne
College of Engineering, Khalifa University of Science, Technology and Research, Abu Dhabi, U.A.E.
P. Dasgupta
positive predictive value by 4%, and decreased detection time by 48.7%. The proposed methodology has great potential for robot-assisted minimally inva-sive surgery and in all applications where remote haptic feedback is needed.
Keywords Haptic feedback·Pseudo-haptic feedback·Rigid tool-soft tissue interaction·Tumor identification
1 Introduction
Haptic Feedback (HF) creates a sensation of touch when a user interacts with a remote object. Most current HF systems provide graphical feedback of the contact area through computer graphics, and single-point Force Feedback (FF) through a haptic interface, such as actuated joysticks or input devices like the PHANToM Omni [10]. Such HF techniques greatly distort the representation of object properties [11].
the breast tissues [21, 30]. In our previous research [17], a virtual-environment tissue model was created based on the reconstructed surface of an artificial soft-tissue organ using a Kinect depth sensor and the organ’s stiffness distri-bution acquired during rolling indentation measurements on a phantom tissue sample. With this tissue model, users can explore the stiffness distribution in the virtual environment with the aid of a haptic device. However, the proposed palpation method required more time for the users to detect the hard nodules than manual palpation [17].
In this paper, a PHF method is combined with FF to establish whether the combination of the two cues can strengthen the end-user haptic perception of the interaction between a rigid tool and a soft tissue and whether it can reduce the time required of nodule detection during palpation. This combina-tion feedback method is applied to the problem of the identificacombina-tion of hard inclusions representing tumors inside a soft tissue. Here, a soft tissue model for palpation is created based on rolling indentation [18, 19] tests on a soft tissue silicone phantom. This paper has the following contributions:
1) Generating a haptic tissue model that is capable of representing tissue stiffness distribution of the examined soft tissue;
2) Presenting three-dimensional haptic information using PHF; 3) Augmenting FF with PHF in an experimental and validation study.
2 Methods
2.1 Overview
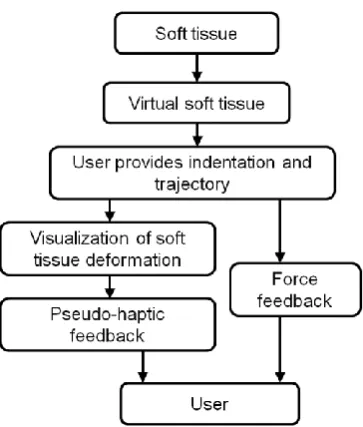
The proposed method aims at providing HF of the interaction between a rigid tool and a soft tissue within a virtual environment. Fig. 1 depicts the method flow chart: a deformable virtual soft tissue model was developed based on a mechanical characterization of a silicone phantom tissue; then our method allowed the experience of a reaction force via both PHF and FF while exploring the tissue and identifying embedded hard inclusions.
In the following paragraphs, the description of the soft tissue computer model, visualization of soft tissue deformation, PHF, FF, and combination of the two feedbacks are reported.
2.2 Soft tissue virtual model
The model was based on previous experimental acquisitions from a silicone block. According to the 2003 American joint committee on cancer staging, T1 stage tumors are 20 mm or less in greatest dimension [35]. The silicone block was a 120×120×25mm3rectangular cuboid containing three differently-sized spherical hard nodules (A: 10 mm, B: 8 mm, and C: 6 mm in diameter). The nodules were buried at a depth of 6 mm measured from each spheres top to the silicone surface. The phantom tissue was made from RTV6166 (ratio 3 : 7, Young’s modulus 15.3 kPa), which is commonly used to fabricate artificial visceral tissue samples [19, 27]. The nodules were made from a rubber eraser STAEDTLER Mars plastic 526 50 (Young’s modulus about 1.59 MPa). The ratio of Young’s modulus of the hard nodules to the silicone block was about 104 which was within the range of the ratios of elastic modulus of cancerous breast tissues to fat tissue (ranging from 4 to 124) reported in [30]. 59 straight rolling trajectories (121 mm long and parallel to thex-axis with an interval of 4 mm along they-axis between every two trajectories) were defined. The speed was set at 30 mm s−1. Indenter-silicone interaction forces were recorded with a Nano 17 (ATI technologies) force/torque sensor (resolution: 0.003 N). Nor-mal and horizontal reflected forces were recorded at 100 Hz. The experiments were repeated at different indentation depths varied between 2 and 7 mm at intervals between paths of 1 mm. The indentation depth was kept constant during one scan. Thus, six 159×59 normal and horizontal force matrices were created, which allowed us to obtain stiffness distribution maps for the whole silicone block surface to be used for our experimental studies.
2.3 Visualization of soft tissue deformation
Mass-spring models and finite element modeling are two standard techniques used to simulate soft tissue deformation during rigid-tool/soft tissue inter-action on the soft tissue computer model [24]. Both techniques have some disadvantages: mass-spring models ignore the impact of the indenter diameter on the soft tissues deformation while the use of finite element modeling cannot usually achieve real-time performance due to high computational complexity [27].
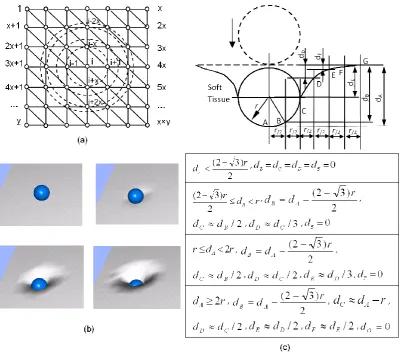
equa-tions. The tissue surface was lubricated, thus the contact between the indenter and simulated soft tissue can be defined as frictionless. The posterior part of the soft tissue was defined as fixed. The results have shown that the inves-tigated different hyperelastic material properties have virtually no impact on the deformation curvature of the soft tissue surface (see Fig. 2). In Fig. 2, although the difference between the two curvatures was comparatively larger in the case of indentation depth -2r when an indenter with a diameter of 10 mm was used, the difference was still less thanr/100 compared to the radius of the indenterr. Thus, one geometrical deformable soft tissue model applies to those hyperelastic materials we examined. In the scope of this research, we assume that it can be applied to any hyperelastic material. Specifically, it refers to tissues like kidney, liver and breast tissues in our paper.
Employing the above geometrical deformable soft tissue model, we pro-posed to graphically display the silicone block surface by using a mesh of connected triangles, whose vertices form a graph of nodes (see Fig. 3(a)). For a nodei at the center of an indentation (caused by a spherical indenter), its perpendicular vertex was updated as a function of the indentation depth. The perpendicular vertices of other affected nodes on the mesh (such as nodei-1, i+1,i-x andi+x, in Fig. 3(a)) were then updated as a function of the distance between the node i and the soft tissue surface deformation presented in Fig. 3 (c), where the indentation depth dA was defined as the distance between the soft tissue surface and the largest displacement point (bottom point of the indenter). According to this modeling method, the indentation depth was then divided into four ranges, where the demarcation points are (2-√3)·r/2, r, and 2r for the (a), (b), (c), and (d) cases, respectively (see Fig. 3 (c)). As the indentation depth increases, the number of the affected vertices of the triangle also increases, and thus, tissue deformation increases(see Fig. 3(b)). Therefore, the depths of the subsequent neighboring points dB,dC,dD,dE, dF, dG, which were at a distance of r/2 apart − were defined as functions of dA. It is important to note that, for soft tissues with curved surfaces, the aforementioned model can be accepted under the assumption that the relevant area around the indentation center is planar.
2.4 Pseudo-haptic feedback and rigid-tool / soft tissue interaction
During palpation, human operators use fingers to slide and press the surface of the soft tissue to perceive its stiffness. Generally, if the indentation depth increases during this exploration procedure, the reflecting force also increases. In particular, if the finger approaches a relatively hard area of a soft tissue with buried hard nodules beneath the surface, then the reaction forces (the lateralfh and normal forcesfn) increase.
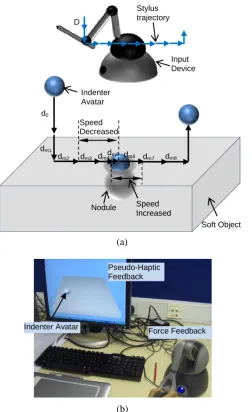
avatar (i.e. the cursor displacement) was introduced in our PHF method. Pre-cisely, an illusion of a resistance to motion occurs when the cursor’s speed becomes slower than the user’s expectation, returning the impression of a stiffness increase. To create this illusion, the relative movement speed of the cursor can be appropriately reduced or increased with respect to the speed of the movement at the user’s input console such as a joystick or a pen-like input stylus (see Fig. 4 (a)).
Since the proposed method operates in real time (i.e. the user’s input oc-curs at the same time as the oc-cursor on the display is being updated), the oc-cursor displacement (d) is varied in a function of the corresponding displacement at the user input device (D), according to a cursor/user input ratio (R =d/D) ratio (see Fig. 4 (a)). Whenever the end-user moves the input stylus (a pen-like device located at the end effecter of the operator input device) towards a hard area (hard nodule in a soft tissue) across a certain distance (D), the cursor/user input ratio R is reduced accordingly. A default ratioRo is intro-duced to characterize the ratio between the two displacements in the object’s default soft regions. Hence, in order to make the user experience the illusion of a resistance to the input motion, when the subject approaches a harder area (a hard nodule in a soft tissue, e.g. a tumor in a soft tissue organ)R is reduced to a smaller valueRm(Rm <Ro), and as a consequence, the modified cursor displacementdm becomes smaller than the default cursor displacement do(dm=Rm·D,do=Ro·D). Thus, virtual forces are perceived through visual perception since the user experiences an imaginary force against the motion direction provided at the input console. After the hard nodule has been passed, the default cursor/user input ratioRo is applied again. Specifically, the modi-fied cursor/user input ratios at normal and tangential directions (Rn andRh) are defined as follows:
∆fn=fn−fnl, (1)
Rn=R0/(fn+ 1), (2)
Rh=R0/(fh+ 1), (3)
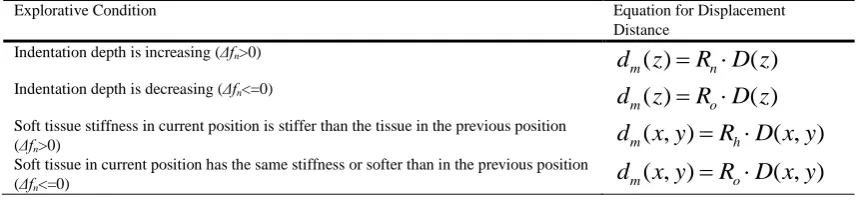
where the reaction force values (tangential reaction forcefh and normal force fn) are acquired from the force matrices obtained by physically exploring the surface with the rolling indentation:fhl is the normal reaction force value at the previous cursor position;Rnis the modified normal cursor/user input ratio and Rh is the modified horizontal cursor/user input ratio. In summary, the cursor displacement distance is modified according to the set of rules reported within Table 1.
2.5 Force feedback
has been implemented and based on the indentation depth caused by the indenter avatar displacement over the soft tissue model. The indenter avatar displacement is controlled by the effective displacement of the stylus of the haptic device. The force calculation is based on a look-up table of measured object deformation/force pairs. This method assumes a constant palpation velocity of the soft tissue surface.
In practice, the current cursor position and the previous cursor position were read by the program first; in case of a contradiction event between the cursor position and the original contour of the soft tissue, the horizontal and normal force values were acquired through a look-up table. Then the projection of the vector pointing from the previous cursor positionPl to the current cursor position Pc on the horizontal planeVh was used to represent the horizontal force direction, namely:
Vh≡
−−→
PlPc, (4)
wherePl (xl,yl) andPc(xc,yc) were defined as the previous and current cursor positions, respectively. The horizontal component vector of the force direction Vh was then transformed to a unit vector with the same direction as the horizontal component vector. The horizontal force was generated along the same direction of the unit vector of horizontal force direction:
c
Vh=
Vh
|Vh|
. (5)
Finally, the normal reaction force was not generated when the indentation depth decreased. When the force in the look-up table exceeded the maximum force (3.3 N) of PHANToM Omni, the force was set to 3.3 N.
2.6 Combined pseudo-haptic feedback and force feedback
With the aim to further improve on what can be achieved in an HF system, a new method was introduced which combines PHF with FF in order to en-hance the haptic perception of the user while interacting with soft tissue and embedded hard inclusions. Since the two mechanisms, namely the PHF and FF, are diverse, they can be easily combined and will not technically have an adverse effect on each other [8]. FF is fed to the hand of the user through a haptic device, while the PHF information is fed to the user via a graphical interface (see Fig. 4 (b)). Therefore, the force perception of the user is the results of a combination of sensations based on the proprioceptive and visual sensors of the subject.
2.7 Experimental evaluation for hard nodule identification
particular virtual environment, and how long the task takes for the user to complete it. An experimental validation study aimed at measuring the benefits of the proposed method was performed. The experiment considered four tests in order to (a) define the efficiency of the proposed method, (b) explore the advantages or shortcomings of using a combined PHF and FF method, (c) evaluate the feasibility of this method as a replacement for manual palpation (direct touch by hand).
Twenty participants (age range: 23−42) were involved in the trials: 6 women and 14 men. One had palpation experience and one was left-handed. The following four tests were performed by each subject in a pseudo-random fashion. For each test, the same stiffness distribution was used, but the ori-entation of the silicone block and silicone block model was changed randomly from time to time to ensure that the participants did not learn the locations of the nodules from the tests conducted earlier. During the test a stopwatch was used in order to measure the time required by the subject to detect the nodules. The instrument allowed a precision of the time measurement of±1 s.
Test 1: Manual Palpation
At first, participants were asked to do an acquaintance trial run by pal-pating transparent silicone blocks containing or not containing visible hard inclusions inside. During the real tests, participants were asked to manually palpate the silicone block with hard nodules embedded at unknown locations covered by a black plastic sheet. Then they were asked to determine at which locations they believed to have sensed hard nodules. The time needed for the detection was recorded until they thought they had found all the nodules.
Test 2: PHF
Participants were again asked to do a practice run with visible hard nodule locations. Then, they were asked to palpate the virtual soft tissue block with the embedded hard nodules (that are invisible to the participant) inside using only PHF, and to indicate the positions of the hard nodules they believed to have found. The time taken to detect all nodules was recorded.
Test 3: FF
The procedure was the same as in Tests 1 & 2. The subjects were asked this time to perform palpation relying on FF only and then to indicate the different positions where they believed to have found hard inclusions. Again, the time needed to detect nodules was recorded.
Test 4: Combination of PHF and FF
A practice run of the test was first conducted. Then, participants were asked to palpate the virtual soft tissue block with hidden nodules by using the combined feedback method and then asked to indicate the different positions where they believed to have found hard inclusions. The time needed to detect all nodules was recorded for each participant.
At the end of the four tests, every participant was asked whether there was any difference in perception with combined feedback versus FF alone.
have good properties even for a small number of trials (less than 30) and/or an extreme probability, were calculated for sensitivity at a 95% confidence level. The measures of the performance of the palpation methods were compared in pairs. It was conducted by comparing the observed probabilities (p1 andp2) with a combined interval (CI), which was calculated using the method de-scribed in [31]. Ifp1−p2 >CI, there is a significance between the two tests. Wilcoxon signed-rank test [3, 31] was used to compare the time consumed by each pair of feedback method modes. Using this test, one can decide whether the sample size distributions are identical without checking the normal distri-bution [3].
3 Results
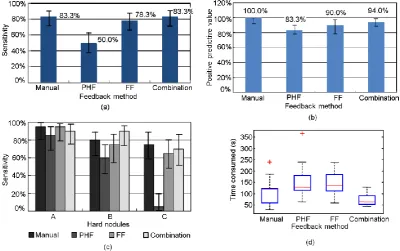
Fig. 5 (a) presents the nodule detection sensitivities of nodule A, B, and C obtained by using different palpation techniques. In general, there was a pos-itive correlation between the detection sensitivities and nodule size −bigger nodules had higher detection sensitivities (mX represents the overall detec-tion sensitivity of nodule X: mA = 91.3%, mB = 76.3%, mC = 53.75%). Compared with FF only, the proposed combination technique improved the sensitivity Se of the middle sized nodule B dramatically from 75 to 90%, but reduced the sensitivity Se of the largest nodule slightly from 95 to 90%. This indicates that the combined technique was particularly suitable for detecting middle-sized nodules.
Fig. 5 (b) presents the overall nodule detection sensitivity of each feed-back method. The bestSe was achieved with the combined technique utilizing both PHF and FF (83.3% with 95% confidential interval 71.9−90.7%). The technique using only pseudo-haptic feedback had a sensitivitySeof 50% (37.7 −62.3%) overall. The performance of FF was better with a sensitivitySe of 78.3% (66.3−86.9%).
Fig. 5 (c) presents the PPV. Compared to PHF and FF, PPV of the combination method was larger.
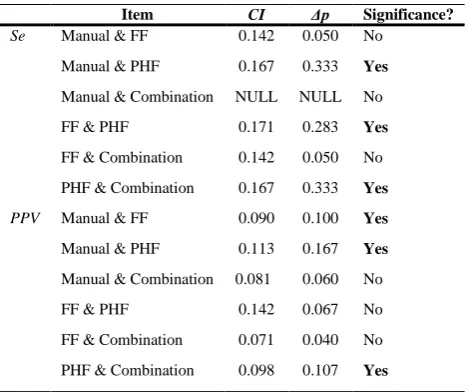
Sensitivities Se and Positive Predictive Values PPV were compared in pairs. Table 2 shows the test results. While manual palpation showed sig-nificant better performance than FF with regards toPPV, the combination method showed no significant difference from manual palpation with regards to bothSe andPPV.
The majority of the participants (n = 16, 80%) surveyed stated that the perception using the combination method was enhanced when compared to the perception from FF alone.
4 Discussion
Although PHF on hard nodule detection was the least effective method among the experimentally investigated methods, PHF has been proven to be able to express haptic information effectively in rigid tool-soft object interaction in virtual environments. PHF provides a low-cost method to simulate soft object stiffness and hard inclusions and can be useful in applications where haptic sensations are needed and where budgets are limited. For instance, video game applications may rely on PHF with no need for expensive haptic devices.
In regards to medical applications the proposed technique presents a de-parture from the empirical mathematical models widely used in medical sim-ulators. Instead, it uses a model based on real organ experimental data − a palpation simulation based on data from an indentation probing test of a sili-cone block. This model presented a stiffness behavior similar to the behavior of the tested silicone block and the applied methodology could be easily ex-tended to real organs palpation. Following the preliminary validation of the proposed concept reported in this paper, different tissue characteristics and shapes, as well as participants with different expertise can be addressed in further validation. For this reason, ti should be noticed that:
Cancerous formations are typically stiffer compared to the surrounding healthy soft tissues [30, 21]. Many tumor identification methods, for example, elastography, are based on this fact [26]. Tumors are also commonly modeled as homogeneous [7, 20, 34]. Therefore, we assume that the tumors are stiffer than the surrounding healthy soft tissues and they are homogeneous in this paper. However, the quantitative measurements of tumor stiffness suggest a wide variability between tumor types [25] and some tumors may have fat containing regions that appear less stiff [28]. The role of differential stiffness on tissue stiffness identification needs to be investigated in the future research. In this paper, only finite element modeling was used to compare the de-formation of different hyperelastic materials during indentation. Experimental data would be required to further confirm the results we acquired using finite element modeling in the future study.
In our method, a rolling indentation probe was used to palpate the soft tis-sue based on the assumption that a single probe might be enough to substitute bi-digital palpations [18, 34]. The comparison between probing and bi-digital palpations may need further investigation.
5 Conclusions
A 3D pseudo-haptic feedback method is proposed to express haptic percep-tion through a visual display. A low-cost combined pseudo-haptic feedback and force feedback method to enhance the perception of haptic feedback has been conceived, implemented and shown to be capable of identifying hard inclusions inside a soft tissue. The performance of the combination of the pseudo-haptic feedback and force feedback was comparable with the performance of the gold standard of manual interaction, which identifies hard nodules through a user’s direct touch sensation. Compared to sole pseudo-haptic feedback or force feed-back, the proposed combined feedback technique enabled participants to detect hard nodules in soft tissue more quickly. The survey showed that participants using the pseudo-haptic feedback combined with force feedback method had an enhanced experience of palpation perception. Our combined feedback method which has been evaluated to successfully augment haptic perception can find future applications in medical palpation simulators. We demonstrated the po-tential of our combined feedback method in medical simulators: a lot of work and effort and user studies remain to show how that this technique can be efficiently used in a real medical simulator
Acknowledgements The research leading to these results has received funding from the National Natural Science Foundation of China (approval no. 51175412), the China Scholar-ship Council, the GSTT charity, the National Institute for Health Research (NIHR) Biomed-ical Research Centre based at Guy’s and St Thomas’ NHS Foundation Trust and King’s College London, and the European Commission’s Seventh Framework Programme under grant agreement 287728 in the framework of EU project STIFF-FLOP. The views expressed are those of the authors and not necessarily those of the NHS, the NIHR or the Department of Health.
References
1. Altman DG, Bland J (1994) Diagnostic test 1: Sensitivity and specificity. BMJ 308:1552 2. Bibin L, Anatole L, Bonnet M, Delbos A, Dillon C (2008) SAILOR: a 3-D medical simulator of loco-regional anaesthesia based on desktop virtual reality and pseudo-haptic feedback. In: ACM Sysmposium on Virtual Reality Software and Technology (VRST) 2008, pp 97-100
3. Conover WJ (1980) Practical Nonparametric Statistics. 2nd ed., John Wiley & Sons, pp 225-226
4. Ernst MO, Banks MS (2002) Humans integrate visual and haptic information in a sta-tistically optimal fashion. Nature 415(6870):429-33
5. Fawcett T (2006) An introduction to ROC analysis. Pattern Recognit Lett, 27(8):861-874 6. De Gersem G (2005) Reliable and enhanced stiffness perception in soft-tissue
telemanip-ulation. The Int J of Robotics Res 24(10): 805-822
7. Gwilliam JC, Mahvash M, Vagvolgyi B, Vacharat A, Yuh DD, and Okamura AM (2009) Effects of haptic and graphical force feedback on teleoperated palpation. In: Proceedings of IEEE International Conference on Robotics and Automation 2009, pp 677682. 8. Hachisu T, Cirio G, Marchal M, Lcuyer A (2011) Pseudo-haptic feedback augmented
with visual and tactile vibrations. In: IEEE International Symposium on Virtual Reality Innovation 2011, pp 327-328
10. Hayward V, Astley O, Cruz-Hernandez M, Grant D, Robles-De-La-Torre G (2004) Hap-tic interfaces and devices. Sensor Rev 24(1):16-29
11. Kim SY, Kyung KU, Park J, Kwon, DS (2007) Real-time area-based haptic render-ing and the augmented tactile display device for a palpation simulator. Adv Robotics 21(9):961-981
12. Kimura T, Nojima T (2012) Pseudo-haptic feedback on softness induced by grasping motion. Isokoski P and Springare J (Eds.): EuroHaptics 2012, pp 202-205
13. Klatzky RL, Lederman SJ, Langseth S (2003). Watching a cursor distorts haptically guided reproduction of mouse movement. J of Exp Psychol: Appl 9(4):228-235
14. Lecuyer A, Burkhardt JM, Coquillart S, Coiffet P (2001) Boundary of illusion: an experiment of sensory integration with a pseudo-haptic system. In: Proceedings of the 2001 IEEE Virtual Reality Conference, pp 115-122
15. Lecuyer A, Burkhardt JM, Tan CH (2008) A study of the modification of the speed and size of the cursor for simulating pseudo-haptic bumps and holes. ACM Trans on Appl Percept 5(3):1-21
16. Li M, Liu H, Seneviratne LD, Althoefer K (2012) Tissue stiffness simulation and abnor-mality localization using pseudo-haptic feedback. In: IEEE International Conference on Robotics and Automation 2012, pp 5359-5364
17. Li M, Faragasso A, Konstantinova J, Aminzadeh V, Seneviratne LD,Dasgupta P, Al-thoefer K (2014) A novel tumor localization method using haptic palpation based on soft tissue probing data. In: IEEE International Conference on Robotics and Automation. IEEE Robotics and Automation Society, Piscataway, USA, pp 4188-4193
18. Liu H, Li, J, Song X, Seneviratne LD, Althoefer K (2011) Rolling indentation probe for tissue abnormality identification during minimally invasive surgery. IEEE Trans on Robotics 27(3):450-460
19. Liu H, Noonan DP, Challacombe BJ, Dasgupta P, Seneviratne LD, Althoefer K (2010) Rolling mechanical imaging for tissue abnormality localization during minimally invasive surgery. IEEE Trans on Biomed Eng 57(2):404-14
20. Liu H, Sangpradit K, Li M, Dasgupta P, Althoefer K, and Seneviratne LD (2014) In-verse finite-element modeling for tissue parameter identification using a rolling indentation probe. Med Biol Eng Comput 52(1):17-28
21. Masuzaki R, Tateishi R, Yoshida H, Sato T, Ohki T, Goto T, Yoshida H, Sato S, Sugioka Y, Ikeda H, Shiina S, Kawabe T, and Omata M (2007) Assessing liver tumor stiffness by transient elastography. Hepatol Int 1(3):394-397
22. Mensvoort K, Vos P, Hermes DJ, Liere RV (2010) Perception of mechanically and optically simulated bumps and holes. ACM Trans on Appl Percept 7(2):10:1-24
23. Nakao Megumi, Kuroda T, Komori M, Oyama H (2003) Evaluation and user study of haptic simulator for learning palpation in cardiovascular surgery. In: International Con-ference on Artificial Reality and Telexistence 2003, pp 203-208
24. Nedel LP, Thalmann D (1998) Real-time muscle deformations using mass-spring sys-tems. In: Proceedings Computer Graphics International 1998, IEEE Computer Society, Washington, DC, USA, pp 156-165
25. Netti PA, Berk DA, Swartz MA, Grodzinsky AJ, and Jain RK (2000) Role of extracel-lular matrix assembly in interstitial transport in solid tumors, Cancer Res 60(9):2497-2503 26. Salomon G, Kollerman J, Thederan I, Chun FKH, Budaus L, Schlomm T, Isbarn H, Heinzer H, Huland H, and Graefen M (2008) Evaluation of Prostate Cancer Detection with Ultrasound Real-Time Elastography: A Comparison with Step Section Pathological Analysis after Radical Prostatectomy. Eur Urol 54(6):1354-1362
27. Sangpradit K, Liu H, Dasgupta P, Althoefer K, Seneviratne LD (2011) Finite-element modeling of soft tissue rolling indentation. IEEE Trans on Biomed Eng 58(12):3319-3327. 28. Venkatesh SK, Yin M, Glockner JF, Takahashi N, Araoz PA, Talwalkar JA, and Ehman RL (2008) MR elastography of liver tumors: preliminary results. AJR Am J Roentgenol, 190(6):1534-1540.
29. Wallis S (2013) Binomial Confidence Intervals and Contingency Tests: Mathematical Fundamentals and the Evaluation of Alternative Methods. J. of Quant Linguist, 20(3), pp 178-208.
31. Wilcoxon F (1946) Individual comparisons of grounded data by ranking methods. J Econ Entomol 39:269
32. Wilson EB (1927) Probable inference, the law of succession, and statistical inference. J of Am Statistical Assoc 22:209-212
33. Woodward W, Strom E, Tucker SL, McNeese MD, Perkins GH, Schechter NR, Singletary SE, Theriault RL, Hortobagyi GN, Hunt KK, Buchholz T (2003) Changes in the 2003 American Joint Committee on Cancer staging for breast cancer dramatically affect stage-specific survival. J Clin Oncol 21(17):324-348
34. Yamamoto T and Abolhassani N (2012) Augmented reality and haptic interfaces for robotassisted surgery. Int J Med Robot Comput Assist Surg 8:45-56.
(a)
(b)
(c)
Fig. 2
On the left panels the deformation curvature of silicone (RTV6166 gel) and porcine
kidney at different indentation depths are reported, by using 6mm (a), 8mm (b), and 10mm (c)
indenter, according to 3D finite element simulation; on the right panels the difference
between the displacement curvatures are reported
0 r/2 r 3r/2 2r 5r/2 3r 7r/2 4r 9r/2 -r/100 -r/200 0 r/200 r/100 Distance D if fe re n c e e -r/2 -r -r/4 -2r -3r/2 0 r/2 r 3r/2 2r 5r/2 3r 7r/2 4r 9r/2
-2r -3r/2 -r -r/2 0 Distance In d e n ta tion d e p th d e p th
Silicone Porcine Kidney
0 r/2 r 3r/2 2r 5r/2 3r 7r/2 4r 9r/2 -r/100 -r/200 0 r/200 Distance D if fe re n c e e -r/2 -r -r/4 -2r -3r/2
0 r/2 r 3r/2 2r 5r/2 3r 7r/2 4r 9r/2 -2r -3r/2 -r -r/2 0 Distance In d e n ta tion d e p th
Silicone Porcine Kidney
0 r/2 r 3r/2 2r 5r/2 3r 7r/2 4r 9r/2 -r/100 -r/200 0 r/200 r/100 Distance D if fe re n c e e -r/2 -r -r/4 -2r -3r/2
0 r/2 r 3r/2 2r 5r/2 3r 7r/2 4r 9r/2 -2r -3r/2 -r -r/2 0 Distance In d e n ta tion d e p th d e p th
Fig. 3
(a) Mesh representation for the soft object deformation visualization: the number of the
vertices of triangles of soft object surface is
x×y
, where the node
i
is positioned at the center
of the indentation area; (b) tissue deformation increases as indentation depth increases; (c)
(a)
(b)
Fig. 4
(a) Modification of the cursor speed when passing over a hard nodule; (b) combined
force feedback and pseudo-haptic feedback.
Pseudo-Haptic Feedback
Force Feedback Indenter Avatar
Nodule
Soft Object Indenter
Avatar
Speed Decreased
Speed Increased D
d0
dm1
dm2 dm3 dm4dm5 dm6 dm7 dm8
Fig. 5
(a) Nodule detection sensitivities of nodule A, B, and C with Wilson score intervals at
a 95% confidence level; (b) overall nodule detection sensitivities with Wilson score intervals
at a 95% confidence level; (c) positive predictive values with Wilson score intervals at a 95%
confidence level; (d) time needed to find nodules using manual palpation, PHF, FF and
Distance
Indentation depth is increasing (Δfn>0)
( )
( )
m n
d
z
R D z
Indentation depth is decreasing (Δfn<=0)
( )
( )
m o
d
z
R D z
Soft tissue stiffness in current position is stiffer than the tissue in the previous position
(Δfn>0)
d
m( , )
x y
R D x y
h
( , )
Soft tissue in current position has the same stiffness or softer than in the previous position
(Δfn<=0)
d
m( , )
x y
R D x y
o
( , )
Se Manual & FF 0.142 0.050 No
Manual & PHF 0.167 0.333 Yes
Manual & Combination NULL NULL No
FF & PHF 0.171 0.283 Yes
FF & Combination 0.142 0.050 No
PHF & Combination 0.167 0.333 Yes
PPV Manual & FF 0.090 0.100 Yes
Manual & PHF 0.113 0.167 Yes
Manual & Combination 0.081 0.060 No
FF & PHF 0.142 0.067 No
FF & Combination 0.071 0.040 No
PHF & Combination 0.098 0.107 Yes
Table 2 Comparison of nodule detection sensitivities and positive predictive values in the tests of
Manual & FF 19 42 46 W <Wcritical, Yes
Manual & PHF 18 22 40 W <Wcritical, Yes
Manual & Combination 19 47.5 46 W >Wcritical,No
FF & PHF 20 99.5 52 W >Wcritical,No
FF & Combination 19 6 46 W <Wcritical, Yes
PHF & Combination 19 4 46 W <Wcritical, Yes