Sociability-Driven Framework for Data
Acquisition in Mobile Crowdsensing over
Fog Computing Platforms for Smart Cities
Claudio Fiandrino,
Student Member, IEEE,
Fazel Anjomshoa,
Student Member, IEEE,
Burak Kantarci,
Senior Member, IEEE,
Dzmitry Kliazovich,
Senior Member, IEEE,
Pascal Bouvry,
Member, IEEE,
and Jeanna Matthews,
Member, IEEE
Abstract—Smart cities exploit the most advanced information technologies like Internet of Things to improve and add value to existing public services. Having citizens involved in the process through mobile crowdsensing (MCS) techniques augments the capabilities of the platform without additional costs. In this paper, we propose a novel framework for data acquisition in MCS deployed over a fog computing platform which facilitates important operations like user recruitment and task completion. Proper data acquisition minimizes the monetary expenditure the platform sustains to recruit and compensate users and the energy they spend to sense and deliver data. We propose a new user recruitment policy called DSE (Distance, Sociability, Energy). The policy exploits three criteria: i) spatial distance between users and tasks, ii) user sociability, which is an estimate of the willingness of users to contribute to sensing tasks, and iii) remaining battery charge the devices. Performance evaluation is conducted in a real urban environment for a large number of participants with new metrics that assess the efficiency of the recruitment policy and the accuracy of task completion. Results reveal that the average number of recruited users improves by nearly20%if compared to policies using only spatial distance as selection criterion.
Index Terms—Data acquisition, fog computing, internet of things, mobile crowdsensing, smart city sensing, sustainability.
F
1
INTRODUCTION
W
ORLD population living in cities has experienced an unprecedented growth over the past century. While only 10% of the population lived in cities during 1900, nowadays this percentage corresponds to 50% and is projected to further increase [1]. Sustainable development plays therefore a crucial role in city development. While only 2% of the world’s surface is occupied by urban environments, cities contribute to 80% of global gas emission, 75% of global energy consumption [2] and 60% of residential water use [1]. Smart cities rely on Information and Communication Technology (ICT) solutions to improve citizens’ quality of life [3], [4]. The application of the Internet of Things (IoT) paradigm to urban scenarios is of special interest to support the smart city vision [4], [5], [6]. IoT is envisioned as the can-didate building block to develop sustainable ICT platforms. With IoT, everyday life objects are uniquely identifiable and “smart”, i.e., they are equipped with computing, storage• C. Fiandrino is with Imdea Networks Institute, Madrid, Spain. E-mail: {claudio.fiandrino}@imdea.org. Claudio developed the current work as a Ph.D. student at the University of Luxembourg.
• F. Anjomshoa is with the Department of Electrical and Computer Engi-neering, Clarkson University, Potsdam, NY, 13699 USA.
E-mail: {anjomsm}@clarkson.edu
• B. Kantarci is with the School of Electrical Engineering and Computer Science, University of Ottawa, Ottawa, ON, Canada.
E-mail: {burak.kantarci}@uOttawa.ca
• D. Kliazovich is with ExaMotive, Luxembourg. E-mail: [email protected].
• P. Bouvry are with the University of Luxembourg, Luxembourg. E-mail: [email protected]
• J. Matthews is Department of Computer Science, Clarkson University, Potsdam, NY, 13699 USA. E-mail: [email protected]
and sensing capabilities and can communicate one with each other and with the users to enable pervasive and ubiquitous computing [7]. Cisco has recently proposedfog computingas an extension of the cloud computing paradigm at the edge of the network [8]. Fog computing is tailored to serve applications that are geodistributed and require low latency and context awareness, making it essential for IoT [9]. Several undergoing research efforts are aiming to assess suitability of fog platforms in the IoT context [10], to improve resource management [11] and proposing pricing models [12]. Including citizens in the loop with crowdsensing approaches augments capabilities of existing infrastructures without introducing additional costs and has been proved to be a win-win strategy for smart city applications [13], [14], [15].
to gather and visualize data coming from smartphone sensors [18].
In MCS, data acquisition, also known as data collection, can be participatory or opportunistic [17]. In opportunistic sensing systems, the user involvement is minimal: sensing decisions are application- or device-driven. In participatory sensing systems, users are actively engaged in the sensing process. The users are recruited by a central platform, which dispatches sensing tasks. Users can then decide which request to accept and, after accepting, they have to accomplish specified sensing and data reporting tasks. On one side, opportunistic sensing lowers the burden of user participation as devices or applications are responsible to take sensing decisions. Conversely, participatory sensing systems are tailored to crowdsensing architectures with a “central platform”, which facilitates system control operations like task assignment, user incentives and rewarding to compensate the participants for their contribution.
User recruitment is one of the key challenges in participa-tory MCS systems. In urban environments, the high number of potential contributors calls for the design of efficient recruitment policies. Implementing proper policies allows selecting users able to fulfill sensing tasks with high accuracy and at minimum costs for the system. From the standpoint of the central platform, which organizes and dispatches tasks, the efficiency of a data acquisition framework is defined in terms of the revenues and the costs sustained. The platform earns revenues through Sensing as a Service (S2aaS) business models [19]. The costs are twofold. The central platform sustains monetary costs to recruit and reward users for their contribution. Users as well sustain costs while contributing data, i.e., the energy spent from the batteries for sensing and reporting data and, eventually, the data subscription plan if the cellular connectivity is utilized for reporting. As in cloud-based S2aaS the mobile devices are the most energy-hungry components in the ecosystem [20], cost-effective solutions in data acquisition not only allow minimizing the energy expenditure, but are also are a powerful incentive to stimulate user participation [21].
In this paper, we propose a novel framework for data acquisition in participatory MCS systems. The framework is deployed over a fog computing platform specifically devel-oped for smart cities. The fog facilitates the most important operations in data acquisition, such as user recruitment and task completion. Specifically, we introduce a new user recruitment policy called DSE, which is based on three criteria: i) the spatialDistancebetween users and tasks, ii) userSociability, which is an estimation of the willingness of users to participate in and contribute to sensing tasks, and iii) theEnergy, computed as the remaining battery charge of user devices. Cloudlets in the fog platform are responsible to estimate sociability, which is an essential parameter to determine if users are eligible to contribute data. Highly sociable users share many interests with friends and are more active, i.e., they are constantly using their devices online, which makes them excellent candidates for data acquisition. Furthermore, we propose novel metrics to assess the effi-ciency of any recruitment policy and the accuracy of task completion. The User Recruitment Effectiveness (URE) metric evaluates the number of users contacted versus recruited. The Global Task Accuracy (GTA) metric quantifies the accuracy
of accomplished task by evaluating the distribution of the data the users contribute along time. Performance evaluation, conducted in a real urban environment for a large number of participants, reveals the effectiveness of the proposed user recruitment policy as the average number of recruited users improves by nearly20%if compared to policies using spatial distance as the only selection criterion.
The synopsis of contributions of this work is as follows:
• Propose a novel fog computing platform, which brings computing intelligence close to the end users in a distributed fashion across the city, specifically by using fog computing cloudlets, which are deployed on bus stops throughout the city.
• Develop new data acquisition framework for mobile crowdsensing systems, which exploits the proposed fog platform for user recruitment and task comple-tion.
• Introduce novel metrics to assess efficiency of user recruitment and accuracy of task completion. • Design of a custom simulator for user recruitment
and data acquisition in a large-scale urban scenario. • Provide performance evaluation of the proposed
framework analytically as well as through simula-tions.
The rest of the paper is organized as follows. Section 2 presents background on MCS data acquisition frameworks and user recruitment policies, motivating the need for social-based and energy-efficient recruitment policies. Section 3 proposes a novel fog computing platform, where the com-puting capacity is efficiently distributed across the urban en-vironment. Section 4 details the proposed methodologies for data acquisition and user recruitment. Section 5 analyzes and evaluates user sociability. Section 6 provides performance evaluation and Section 7 concludes the work outlining future research directions on the topic.
2
BACKGROUND AND
MOTIVATION
This section reviews the research in the field of mobile crowdsensing with a focus on participatory data acquisition frameworks and user recruitment policies.
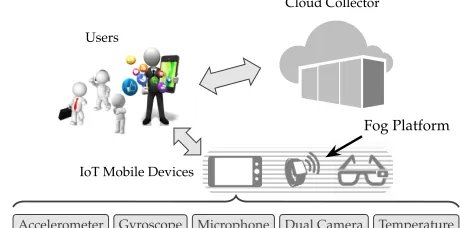
MCS data acquisition platforms are systems in which users contribute information from IoT mobile devices. Such information is then delivered to a collector, typically located in the cloud, to be at disposal of the organizer of the sensing campaign for processing and analysis. Fig. 1 illustrates the main elements of a typical MCS system.
2.1 Data Acquisition in MCS
Fog Platform Cloud Collector
Users
IoT Mobile Devices
Accelerometer Gyroscope Microphone Dual Camera Temperature
Fig. 1. System scenario
In this paper we propose a general-purpose framework. Unlike application-specific frameworks, the salient feature of general purpose frameworks is the capability of serving many applications at the same time. BLISS [26] uses an online learning algorithm for data collection. The collector optimally assigns tasks to the users having a limited budget available at disposal for rewarding. Wang et. al [27] propose an energy-efficient algorithm for uploading the sensed data. The algorithm groups users into two categories: those who have paid data plan with mobile operators and try to minimize the energy cost during data uploading, and those who want to minimize cost of data uploading benefiting from free-of-charge networks, such as WiFi or Bluetooth. Similar to Piggyback CrowdSensing [21], data uploading is performed piggybacking during voice calls. Liu et al. [28] define a new routing mechanism for data collection in MCS systems to cope with user selfishness. Data delivery is always performed through opportunistic communications and is relayed in a delay-tolerant fashion only by non-selfish nodes that are willing to cooperate. To balance the workload among the participants while maximizing the utility of data collection, in [29] the authors propose a Nash bargaining approach where load distribution and utility maximization are considered two cooperative players in the game.
The closest framework to our work is CARDAP [30]. The CARDAP framework extends and augments functionalities of CAROMM [31] enabling efficient data analytics performed in a distributed fashion in the fog. Unlike CARDAP, in this work we exploit the computing capacity provided by the fog platform not for data analytics, but for efficient user recruitment and task completion in participatory MCS systems.
2.2 User Recruitment in MCS
To organize a MCS campaign, the organizer, such as a government agency, an academic institution or a business corporation, sustains costs to recruit and compensate users for their involvement. Therefore, devising a proper recruit-ment policy is essential. On one hand, it allows the organizer to minimize the expenditure. On the other hand, it helps to choose the users that will carry out the campaign successfully. For example, in the public safety context, it is essential to select users that maximize the trustworthiness of collected data [32], [33], [34], [35].
Several research works investigate task assignment and user recruitment in MCS systems, which is also called participant selection. The majority of the proposed policies
aims at minimizing the sensing cost for the organizer while guaranteeing a certain level of system accuracy, such as coverage of the sensing area [36], [37], [38], [39]. Reddy et al. [36] propose a recruitment policy which selects the participants on the basis of their availability in collecting data in a given geographical area and at a defined time. In the context of opportunistic sensing systems, Karaliopoulos et al. formulate an optimization problem to minimize system costs and predict user location with deterministic and stochastic mobility models [37]. With the objective of minimizing energy consumption to report sensed data, piggyback crowdsensing techniques can be employed [38], [39]. More precisely, piggyback crowdsensing leverages users’ phone call and other application usage to upload gathered information [21]. The authors of [38] propose three greedy algorithms to find the minimum number of participants to guarantee a minimum coverage level, whereas the authors of [39] exploit historical records to predict user call and thus determining coverage of sensing area. He et al. [40] not only propose an efficient algorithm for time-dependent assignment of tasks, but they also devise a novel pricing mechanism to reward users based on bargaining theory. Hassani et al. [41] propose Context-Aware Task Allocation (CATA), which is a framework for opportunistic MCS systems allocating tasks to users recruited through an apposite policy. The policy aims at selecting the most appropriate users to fulfill the sensing task by computing a set of indicators that determine the similarity between the participants and the tasks. Moreover, the policy also considers energy consumption of operations like sensing and data delivery and protects the user privacy, e.g., the platform never asks the users to reveal sensible information such as user location. Liu et al. [42] propose an energy-efficient participant selection scheme, which relates the residual battery charge of the users to their willingness to contribute. The scheme ensures the quality of sensed informa-tion in terms of the amount of collected data per task. With a comparative analysis of delay-tolerant routing protocols for reporting, Tuncay et al. [43] propose a comprehensive framework that simultaneously addresses both participant recruitment and data acquisition. To address the privacy concerns, users might be disclosing their location during the selection process. Spatial cloaking is a promising and effective solution to overcome such issue [44].
The closest user recruitment policy to our proposal exploits social relationships to establish a trusted route between service requester and provider parties [45]. More specifically, the service requester is interested in acquiring information on a given phenomenon. If the service provider belongs to the same community of the requester, it receives immediately the sensing task. Otherwise, the task is offered to users belonging to overlapping communities until it reaches the service provider. The trust of passages among the communities is guaranteed by social ties between the users within each community.
3
FOG
COMPUTING
PLATFORM IN
SMART
CITIES
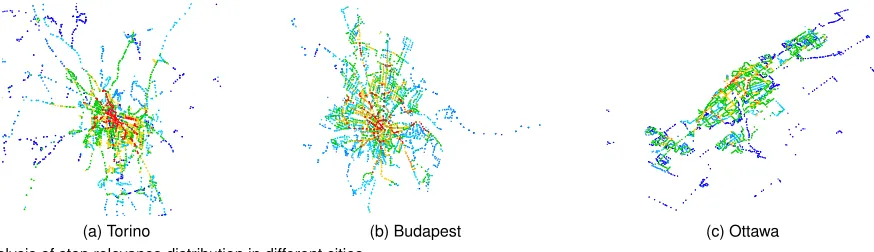
(a) Torino (b) Budapest (c) Ottawa Fig. 2. Analysis of stop relevance distribution in different cities
computing, storage and networking capabilities. Cloudlets are typically micro servers or local processing units such as notebook or desktop computers used for temporary storage and processing [46]. In addition to provision computing resources, they provide data aggregation functions to reduce the amount of information delivered to the cloud. Cloud data centers, in the back-end of the architecture, provide centralization of functionalities and backup.
To properly support IoT-based services and applications, including MCS, an efficient deployment of fog architectures in urban environments is essential [47]. Edge devices such as cloudlets, that are responsible for provisioning location-aware and low latency computing, have to be geographically distributed across the city. Bus stops are a natural choice for installing cloudlets for a number of reasons. First, bus stops are widespread across urban environments. Second, they are already existing and deployed infrastructure. As a consequence, such solution would save capital expenditure costs. For example, bus stops are already connected to the city power grid, therefore there is no need for investments. Third, bus-stops are expected to becomeintelligentin the near future and provide additional community services. For example, but stops will host femto cells to increase cellular capacity and connectivity [48]. In cities, bus stops are not all identical. Because of the location, some of the them are hubs, i.e., they are stops used by a huge number of passengers every day. Therefore, such stops are morerelevantto the system than the ones used by few passengers. Obviously, stops need to be equipped with computing capacity proportionally to their relevance. To study the relevance property of bus stops, we analyze data from Google Transit Feed. Google Transit [49] is a tool that integrates information on public transportation system like stop location, routes, bus schedule and fare on Google Maps to let trip planning easier and accessible for everyone.
Similarly to [50], the relevance of stop i is defined in terms of the number of trips crossing i during a given time period. For the evaluation, the time period is set to 6:00 AM - 10:00 PM of a weekday, namely 2016-06-17. Fig. 2 shows relevance stop distribution in different cities, namely Torino, Budapest and Ottawa according to the classification proposed in Table 1. In all the cities, the number of stops with high relevance is low. Relevant stops are typically concentrated in the city center or in proximity of popular public parking facilities or train stations, which are expected to serve a high number of users along the day.
TABLE 1
Classification of stop relevance. Each interval corresponds to the number of trips passing by a stop from 6:00 AM to 10:00 PM.
COLOR RELEVANCEINTERVAL TORINO BUDAPEST OTTAWA
0 - 5 0 - 25 0 - 25 5 - 10 25 - 100 25 - 50 10 - 50 100 - 250 50 - 100 50 - 100 250 - 500 100 - 250 100 - 250 500 - 750 250 - 500 250 - 500 750 - 1000 500 - 1000 >500 >1000 >1000
4
DATA
ACQUISITION
FRAMEWORK
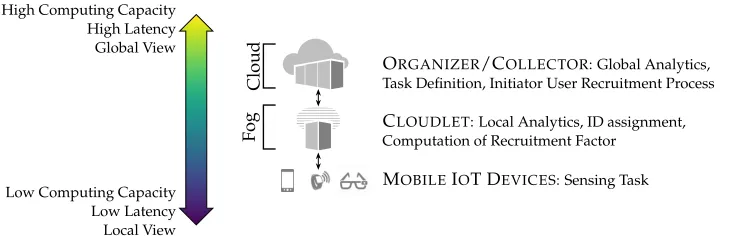
A data acquisition framework defines the set of steps necessary to produce and deliver the information from the participants to the organizer/collector. Fig. 3 shows the architecture considered and illustrates the functions each actor carries out.
The organizerof the crowdsensing campaignCis inter-ested in acquiring data from givenpoints of interestin the city, also called thesensing terrain. The organizer, located in the cloud, is in charge of analyzing data after it has been collected and make it available to S2aaS applications. The organizer defines the set of sensing tasksW={w1, w2, . . . , wW}ofC.
Each taskwiis described in terms of its locationLiand time
durationTi, i.e.,wi(Li, Ti). The locationLconsists of latitude
and longitude parameters. The time durationT is given in timeslots. As a result, the durationT of the campaignCis as follows:
T = X
i∈W
Ti. (1)
High Computing Capacity High Latency Global View
Low Computing Capacity Low Latency Local View
ORGANIZER/COLLECTOR: Global Analytics, Task Definition, Initiator User Recruitment Process
CLOUDLET: Local Analytics, ID assignment, Computation of Recruitment Factor
MOBILEIOT DEVICES: Sensing Task
Fog
Cloud
Fig. 3. Architecture of the proposed fog-based data acquisition framework
users are eligible to become contributors and contact them for recruitment.
After being contacted, the users can decide whether to accept the task. In positive case, users acquire the status of recruited, they areassigned to the task and can contribute data. Acceptance depends on user sociability and remaining battery of charge of user devices. Users with high values of sociability factor use social media often and are more likely to accept the task [56]. One important assumption in this work is that user contribute structured data. Indeed, data coming from IoT devices typically exhibits different formats.
4.1 User Recruitment
User recruitment is a fundamental step in participatory data acquisition frameworks. Recruitment policies delineate the set of criteria for user eligibility in contributing to crowdsens-ing campaign. Contrary to traditional recruitment solutions, in this paper we define a policy able to select participants on the basis of three parameters: i) the distance between users and sensing task location (D), ii) user sociability (S), and iii) remaining battery of charge of users devices (E). The policy is named DSE (Distance, Sociability, Energy). The parameters
D,SandEiare unit-less and can assume real values in[0,1].
Table 2 lists description of symbols used in the model. LetU ={u1, u2, . . . , uU}be the set of users potentially
employed to accomplish the tasks. Each useruiis described
in terms of his/her current location, sociability factor and energy, i.e.ui(Li, Si, Ei). It is worthwhile mentioning that
both user location and sociability factor are time dependent. During each timeslot, the recruitment policy selects users with highestrecruitment factorRfrom the setU. Only users with values ofR > Rminare taken into consideration and
contacted.Rmindefines the minimum recruitment factor and
is set by the organizer to be identical for all the tasks in the campaignC. For each useri, therecruitment factoris defined as follows:
Ri=α·Di+β·Si+γ·Ei, (2)
where the parametersα,β,γare weighted coefficients defin-ing the impact of the corresponddefin-ing component, distance, sociability and energy onR. Taking into account thatα+β+γ
must equal unity, high values ofαwill prioritize selection of users close to the sensing task. High values ofβwill favor
selection of highly sociable users while high values of γ
will make the remaining battery charge of devices the most important component for recruitment. Section 6.3.3 details how to properly set the parameters to maximize the number of tasks carried out successfully.
TABLE 2
Symbols list and description
SYMBOL DESCRIPTION
C Crowdsensing campaign
w Taskw
W Set of tasks |w∈ W
u Useru
U Set of users |u∈ U t Timeslott
Ti Duration taski
T Duration of the sensing campaign
L Location of users and tasks Ri Recruitment factor of useri Di Distance factor of useri Si Sociability factor of useri Ei Energy factor of useri
Rmin Minimum recruitment factor for eligibility
Du,w Distance (m) between useruand taskw Dmax Maximum task coverage radius
Es Energy consumed for sensing
Er Energy consumed for data delivery (reporting) Ptx Power consumed for data delivery
Ai Task acceptance factor of useri
N Minimum number of users to mark a task asaccomplished
Pi Popularity factor of locationi E[Nc] Average number of contacted users E[Nr] Average number of recruited users
The componentDiis the distance factor, which measures
the distance of useruifrom the sensing taskwj with respect
to a maximum coverage radius for the taskDmax.
Di= 1−(Dui,wj/Dmax). (3) Users located farther than Dmax from the location of a
sensing task are not considered eligible to contribute data for that task. Indeed, the closer the users are to the sensing task location, the higher the accuracy in capturing the phenomenon is. The Haversine formula can be employed to computeDui,wj [57].
User sociabilityScan be defined in terms of the amount of data users consume or the time they spend using mo-bile social network applications, or their combination [58]. Sociability is an essential parameter to consider for user recruitment. Users with high sociability are more active and use their devices online intensively, which makes them excellent candidates during the selection process. Moreover, they tend to visit more places and get connected to more users, which further increases their mobile social activity [59]. Section 5 provides more information and deep analysis to compute user sociability.
the mobile or IoT device operating system and normalized to be in the range[0,1]. Indeed, the most widely adopted mobile OS like iOS and Android provide APIs to obtain information on current level of battery charge expressed in percentage. For crowdsensing operation, the devices consume energy to perform sensing (Es) and reporting (Er) operations:
E=Es+Er. (4)
The energy Es drain due to sensing is the sum over all
sensorsKinvolved to fulfill a task duringT:
X
k∈K
T X
t=1
fk·ρk, (5)
where fk is the sampling frequency of sensork andρk a
constant, different per sensor, which describes the energy cost per sample [30]. Typically, the parameterρcan be obtained from the data sheet of the sensor.
The users exploit WiFi connectivity for data reporting and communication with the cloudlets. Most of the mobile operating systems, including Android and iOS, tend to prefer WiFi over cellular connectivity for data transmission, as it is more energy efficient [60] and users do not consume the data plan they pay to the cellular operators [61]. As a result, when both WiFi and LTE interfaces are active, transmissions take place via WiFi. The energyErspent during the transmission
timeτtxis defined as:
Er= Z τtx
0
Ptxdt, (6)
wherePtxis the power consumed for transmissions of WiFi
packets generated at rateλg[62]:
Ptx =ρid+ρtx·τtx+γxg·λg. (7)
4.2 Task Completion
To recruit users, the campaign organizer sustains a cost. For each request sent to the users, the costcassociated to the task
wis equal to1unit of cost. The costs have a different nature. For example, costs could be financial or expressed in terms of the bandwidth used to broadcast recruitment messages. Costs can also be social: contacting persistently a users who has refused to accomplish to a task in previous timeslots, it is likely to diminish the chances that s/he will accept the task. The objective of the organizer is to minimize the total cost sustained while maximizing the number of accomplished tasks. The tradeoff between the recruitment cost and the number of accomplished tasks defines the efficiency of the recruitment policy.
Users with high recruitment factor are contacted and can decide whether to accept or refuse the task. Upon acceptance, the user acquires therecruited status. Acceptance is based on user sociability and remaining battery charge. Users with high values of sociability and energy factors,SandE
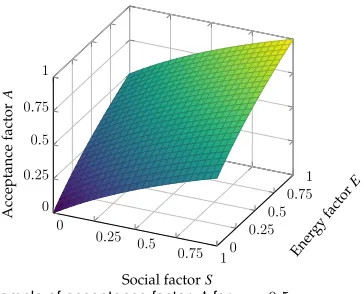
respectively, are more likely to accept the task. The acceptance factorAis computed by the user devices and it is modelled as a logarithmically increasing function:
A(S, E) =σ·log(1 +S) + (1−σ)·log(1 +E), (8) where σ is a balancing coefficient that shows a relative importance between the sociability and energy factors. Fig. 4 shows the relation betweenA,S andE, which allows to perform a fine-grain comparison of the task acceptance probability of users with low versus high sociability and
0
0.25 0.5
0.75 10 0.25
0.5 0.75
1
0 0.25 0.5 0.75 1
Social factorS
Ener gyfactor
E
Acceptance
factor
A
Fig. 4. Example of acceptance factorAforσ= 0.5
energy ratings. For users with high values of sociability and remaining battery charge, the acceptance factorAassumes values close to 1. Viceversa, for users with low values of sociability and remaining battery charge, a small difference between two factorsS1andS2,E1andE2corresponds to a considerable difference in the respective acceptance factors
A1andA2.
Upon acceptance, the user acquires therecruitedstatus and contributes as long as s/he remains within a distance closer thanDmax. In such a case, s/he is not contacted to contribute
to the same task any longer. Viceversa, users refusing a task can be contacted again if the eligibility criteria are still met. After rejection during timeslott, a user is contacted again at timeslottnext, which is defined as follows:
tnext=t+i·τ. (9)
The parameterτ is a fixed number of timeslots the systems backs off andiis the number of times the user has previously
refused the same task. Consequently, the higher the number of rejection, the longer the system will wait before contacting again the user for the same task.
System-level accuracy increases if the organizer does not recruit persistently the same group of users to accomplish a task [63]. For this reason, each taskwacquires the status accomplishedif, during t, a given number N of individual users are involved and contribute by reporting data. During
ti, whenever it is not possible to recruit a sufficient number
of users, the taskiis marked asfailed.
Like in social networks, some locations in cities arehubs, i.e., they attract a large number of individuals, whereas others do not [64]. To capture this phenomenon, each locationlis
assigned a popularity factorP, andP can take real values in the range[0,1]. Practically, tasks associated to locations with high popularity factor should require a high number of users to successfully complete the task. In addition to the location popularity, also the time dimension plays a crucial role in definingN. Longer tasks require a higher number of
users than short ones to guarantee good levels of accuracy. As a result, the number of usersNinecessary to accomplish
the taskiout ofU is calculated as follows:
Ni=Pi·(ti/T)· U. (10)
5
ANALYSIS OF
USER
SOCIABILITY
introduced to continuously track users interactions through popular social network services. Each interaction through the device is translated into a session that keeps track of the duration of the interaction, data usage during the session, and location information to detect possible anomalies. A normalized running average value of the social network data usage of a user indicates their sociability in a pool of mobile users. In the context of crowdsensing, these users form the pool of participants.
This section provides a deep analysis on user socia-bility with the TrackMaison (Track My Activity in Social Networks) framework in [58]. TrackMaison analyzes data gathered from smartphone sensors and users’ social network interactions for continuous user identification/authentication with online behavioral biometrics, also calledbehaviormetric identification/authentication. The social networks considered are Facebook, Linkedin, Whatsup, Skype and Twitter. More in detail, the framework collects information on the location of users, their data usage, the number of sessions and the session duration. TrackMaison monitors the user interaction with social medias, trains the classifier and then feeds the identification process.
Two metrics are defined for identification/authentication: thesociability activity rateand thesociability factor. The first is based on the amount of data that a user produces when using social networking applications. The amount of time a user spends on social networks defines the second metric, which is used in the paper for user recruitment. The sociability factor can be determined as the instantaneous, the short term or the global component, or overall values. The instantaneous sociability factorSFU
u appx
insi is calculated as the total time a user spends on a social networking application in a single session.
SFU
u appx
insi =t
Uu appx
i . (11)
To compute the short term sociability factorSFU
u appx
shi , the time spent on a social network application is averaged over over a short time windowτ, e.g., a day.
SFU
u appx
sh =
X
tU
u appx
i
/τ. (12)
The global component SFU
u appx
overalli(Tk) is defined as the
weighted sum of short term sociability factors:
SFU
u appx
overall(Tk) =ρ·SF
Uu appx
sh (Tk)+(1−ρ)·SF
Uu appx
overall(Tk−1),
(13) where Tk denotes thek−th short term sociability factor
used in the calculation, andρis a weight factor defining the importance of short term social factor value and previous overall social factor value. From theSFU
u appx
overall(Tk)values,
the cloudlets determineSamong all the users contributing data to the campaign. For each user, the cloudlets compute
Sas the aggregated overall sociability factors scaled by the maximum aggregated sociability factors in the active users pool.
S= X
x∈X
ωxSF Uu
appx
overall(Tk)/argmax
u∈U
X
x∈X
ωxSF Uu
appx
overall. (14)
The parameterωxis a weight factor unique for each mobile
social network application.
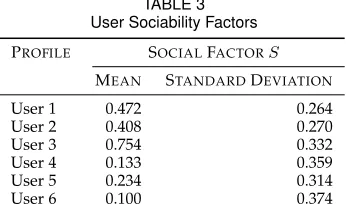
Fig. 5 and Table 3 show the analysis of sociability factor
TABLE 3 User Sociability Factors
PROFILE SOCIALFACTORS
MEAN STANDARDDEVIATION
User 1 0.472 0.264
User 2 0.408 0.270
User 3 0.754 0.332
User 4 0.133 0.359
User 5 0.234 0.314
User 6 0.100 0.374
performed over a real data set, with information collected from6users for a period of79days. Each plot represents the number of days each user has achieved a overall social factor. Users are divided into two groups. In the first group, users 1, 2 and 3 show highly sociable profiles as for the majority of the days they spend lot of time on social networks. Unlike the users of the first group, in the second group Users 4, 5 and 6 show low sociable profiles as they achieve a low sociability factor for the majority of the evaluation period.
6
PERFORMANCE
EVALUATION
This section illustrates performance evaluation of the pro-posed user recruitment policy for data acquisition in mobile crowdsensing systems. We first propose novel performance metric and illustrate others Key Performance Indicators (KPI) used for evaluation. Second, we outline the research question that simulation results answer and next we analyze the simulation results.
6.1 Performance Metrics
The effectiveness of any recruitment policy can be defined in terms of the number of contacted users that are actually recruited. To quantify such effectiveness, we propose a novel metric called User Recruitment Effectiveness (URE):
URE=E[N
r]
E[Nc],
(15)
whereE[Nc]andE[Nr]correspond to the average number of contacted and recruited users respectively. The URE metric can assume real values in the range[0,1]. Values of URE close to1indicate efficient policies. More precisely, URE= 1 corresponds to have all the contacted users actually recruited. In addition to measure effectiveness of user recruitment, it is also important to assess the number of assigned users per task and the number of accomplished tasks. Having the capability to measure the former KPI allows the organizer to properly set the recruitment policy. For example, relax-ing eligibility constraints for tasks with a low number of users assigned would increase participation. Measuring the number of accomplished tasks defines the overall system effectiveness.
Having definedaccomplishedtasks, it becomes necessary to measure their accuracy. Obviously, task accuracy depends on time distribution of the contribution provided by theN
users. Let us consider the case for all theN users deliver
0-0.1
0.1-0.2 0.2-0.3 0.3-0.4 0.4-0.5 0.5-0.6 0.6-0.7 0.7-0.8 0.8-0.9 0.9-1.0 0
5 10 15 20
Sociability Factor
Number
of
days
(a) User 1
0-0.1
0.1-0.2 0.2-0.3 0.3-0.4 0.4-0.5 0.5-0.6 0.6-0.7 0.7-0.8 0.8-0.9 0.9-1.0 0
5 10 15 20
Sociability Factor
Number
of
days
(b) User 2
0-0.1
0.1-0.2 0.2-0.3 0.3-0.4 0.4-0.5 0.5-0.6 0.6-0.7 0.7-0.8 0.8-0.9 0.9-1.0 0
10 20 30 40 50
Sociability Factor
Number
of
days
(c) User 3
0-0.1
0.1-0.2 0.2-0.3 0.3-0.4 0.4-0.5 0.5-0.6 0.6-0.7 0.7-0.8 0.8-0.9 0.9-1.0 0
10 20 30 40 50
Sociability Factor
Number
of
days
(d) User 4
0-0.1
0.1-0.2 0.2-0.3 0.3-0.4 0.4-0.5 0.5-0.6 0.6-0.7 0.7-0.8 0.8-0.9 0.9-1.0 0
10 20 30 40
Sociability Factor
Number
of
days
(e) User 5
0-0.1
0.1-0.2 0.2-0.3 0.3-0.4 0.4-0.5 0.5-0.6 0.6-0.7 0.7-0.8 0.8-0.9 0.9-1.0 0
10 20 30 40
Sociability Factor
Number
of
days
(f) User 6 Fig. 5. User profiles for sociability
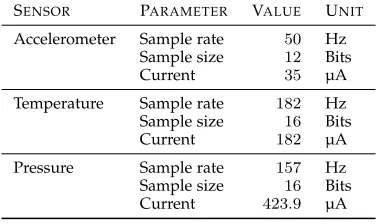
TABLE 4
Sensor and communication equipment parameters used for performance evaluation
SENSOR PARAMETER VALUE UNIT Accelerometer Sample rate 50 Hz
Sample size 12 Bits
Current 35 µA Temperature Sample rate 182 Hz Sample size 16 Bits
Current 182 µA Pressure Sample rate 157 Hz
Sample size 16 Bits Current 423.9 µA
(a) Sensor
SYMBOL VALUE UNIT DESCRIPTION
ρid 3.68 W Power in idle mode ρtx 0.37 W Transmission power ρrx 0.31 W Reception power
λg 1000 fps Rate of generation of packets
γxg 0.11·10−3 J Energy cost to elaborate a generated packet (b) Communication
(GTA) metric quantifies accuracy of accomplished task as follows:
GTA= 1
T ·
T X
t=1
xt· nt N −
T X
t=1
q·
t X
j=1
yt
, (16)
wherentis the number of users in timeslottcontributing
data and q is a penalization term, which reduces task accuracy when in a given timeslot the contribution is null. The termqis set to be inverse proportional to the number of timeslotsT:
q= 1/T. (17)
The rationale behind this choice is that having no contribu-tion in one timeslot affects more severely short tasks than longer ones. The penalization should be more severe if during consecutive timeslots none of the users contributed data. For this reason, in (16), q linearly increases with the number
of timeslots with no contribution. The termsxtandytare
boolean variables:
xt= (
1 ifnt>0;
0 otherwise., yt=
(
1 ifnt= 0;
0 otherwise. (18)
It is worth mentioning that both URE and GTA metrics should not be computed run time, but after task completion, i.e., the durationTiof the taskiexpired.
To properly define the accuracy of data collection, it is necessary to measure the accuracy of sensing reading in addition to the accuracy of task completion. The former is application dependent and, for applications aiming at mon-itoring phenomena like air or noise pollution, recruitment policies play an essential role. Indeed, accuracy in monitoring the phenomena increase if the same users are not persistently recruited to accomplish a task [63].
6.2 Objectives of the Simulations Experiments
Simulation experiments are the candidate tool to assess performance of MCS systems. The high number of par-ticipants makes difficult to perform realistic experiments with testbeds. Objective of the simulation experiments is to validate the effectiveness of the sociability-driven recruitment policy. Analysis of the computing, memory and storage requirements of the fog platform is left to future works.
objective of this paper is evaluating the energy consumption and sensing costs of the overall crowd. Thus, while highly sociable users can be preferred for the sake of accuracy and recruitment effectiveness, they should also be compensated effectively due to high communication and sensing costs. However, addressing proper rewarding based on communi-cation and sensing costs is left to future work as this problem falls into the scope of user incentives in crowdsensing. By evaluating the performance of the proposed scheme, answers to the following research questions are sought:
• What is the impact of sociability-driven recruitment policy on the effectiveness of recruiting the contacted users and on the accuracy of the accomplished tasks? • How are the sensing and communication costs im-pacted when sociability is a key recruitment criterion? • How the parameters of the framework impact the main objective, the number of accomplished tasks?
6.3 Simulation Results
To evaluate and assess efficiency of the data acquisition framework, we exploit CrowdSenSim [66]. CrowdSenSim allows the researchers to perform analysis of crowdsensing activities in realistic urban scenarios. In this work, the experiments take place in the city center of Luxembourg, see Fig. 6(a).
The number of participants ranges from2 000to10 000, which corresponds to nearly one tenth of the population of Luxembourg (107 340 inhabitants as of late 2014). For simplicity, the start time of the walk is uniformly distributed between 8:00 AM and 1:30 PM. Users walk for a period of time that is uniformly distributed in [10,30] minutes with an average speed uniformly distributed in[1,1.5]m/s. Each participant has only one mobile device, whose initial remaining charge of the battery is uniformly distributed between[0.5,0.9]. The devices are equipped with accelerom-eter, temperature and pressure sensors, and transmit in-formation using WiFi. As sensing equipment, the devices exploit real sensors implemented in current smartphones and tablets. Specifically, we select the FXOS8700CQ 3axis linear accelerometer from Freescale Semiconductor [67] and the BMP280 from Bosch [68], which is a digital pressure and temperature sensor. Equation (7) describes WiFi power consumption the devices spend for communication. Table 4 presents the detailed information on communication and the parameters. The participants push data to the collector while walking. Once the period of walking ends, they stop moving and contributing. As a consequence, users can contribute for only a small portion of the day, which allows us to study the system performance under a relatively worst case scenario. Each user has an associated sociability profile according to Table 3.
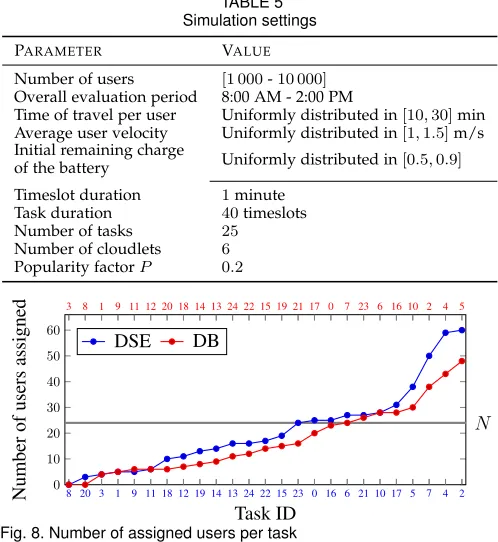
A set of 6 cloudlets dispatching 25 tasks is deployed in different locations of the city, see Fig. 6(b). The starting time of each task is distributed uniformly in the time period 8:00 AM - 2:00 PM. Table 5 lists the details on the simulation settings. For simplicity, each task lasts 40 timeslots and each timeslot corresponds to 1 minute. In the first set of experiments, the popularity factorP of each location, the minimum recruitment factorRminand the maximum task
TABLE 5 Simulation settings
PARAMETER VALUE Number of users [1 000-10 000]
Overall evaluation period 8:00 AM - 2:00 PM
Time of travel per user Uniformly distributed in[10,30]min Average user velocity Uniformly distributed in[1,1.5]m/s Initial remaining charge
of the battery Uniformly distributed in[0.5,0.9] Timeslot duration 1minute
Task duration 40timeslots Number of tasks 25
Number of cloudlets 6
Popularity factorP 0.2
8 20 3 1 9 11 18 12 19 14 13 24 22 15 23 0 16 6 21 10 17 5 7 4 2 0
10 20 30 40 50 60
3 8 1 9 11 12 20 18 14 13 24 22 15 19 21 17 0 7 23 6 16 10 2 4 5
N
Task ID
Number
of
users
assigned DSE DB
Fig. 8. Number of assigned users per task
coverage radiusDmaxare fixed and set equal to0.2,0.55and
55m respectively.
6.3.1 Performance of the DSE Policy
Having fixed the parameters of the recruitment policy
α=β=γ= 0.33andσ= 0.5, Fig. 7 shows the number of contacted and recruited or assigned users per task. Tasks are grouped according to the initial time of deployment The number of contacted users corresponds to the cost the system sustains for recruitment. In this experiment, we compare the performance of the DSE policy with a recruitment policy where the distance is the only criterion defining user eligibility. We denote this policy as Distance-Based policy (DB) and requires to setα= 1,β=γ= 0. The DSE policy outperforms the DB policy in terms of the number of users recruited. The average number of recruited users per task is21.23and17.08for DSE and DB respectively, which corresponds to an increase of19.55 %. Moreover, when the DB policy fails to contact users like in task # 3 or contacts very few users like in task # 1, the DSE policy makes a significant difference. Consequently, considering user sociability and remaining battery of charge of the devices in addition to task spatial coverage for recruitment is an effective solution. Although being more efficient in recruiting users, the DSE policy is more costly than the DB policy. The average number of contacted users is45.4, while for the DB policy is32.92, which corresponds to an increase of costs of around27 %.
(a) Street-level information (b) Location of sensing tasks and cloudlets
Fig. 6. Map of Luxembourg
3 11 6 7 17 24 20 5 1 4 12 22 2 23 16 10 18 8 21 9 15 14 0 13 19 0
25 50 75 100 125 150
8:00-9:00 9:00-10:00 10:00-11:00 11:00-12:00 12:00-13:00 13:00-14:00
Task ID
Number
of
Users
Contacted Recruited/Assigned
(a) DSE Policy
3 11 6 7 17 24 20 5 1 4 12 22 2 23 16 10 18 8 21 9 15 14 0 13 19 0
25 50 75 100 125 150
8:00-9:00 9:00-10:00 10:00-11:00 11:00-12:00 12:00-13:00 13:00-14:00
Task ID
Number
of
Users
Contacted Recruited/Assigned
(b) DB Policy Fig. 7. Number of contacted versus recruited users. Distance-based (DB) policy is used as baseline for comparison.
tasks and two are close to completion. Only the campaign organizer can compare the tradeoff between cost increase and return, and pursue proper measures, e.g., to reduce the cost of user recruitment.
Fig. 9 evaluates the efficiency of recruitment and accuracy of task completion with URE and GTA metrics. The recruit-ment efficiency of the campaign, computed as an average of the URE values of each task, is0.46. As a consequence, under the current settings, the systems contacts many users that refuse to contribute to the campaign. It is worth mentioning that for accomplished tasks such as task #2(see Fig. 8), the values of URE metric are always equal to or higher than0.5. Therefore, for accomplished tasks, the recruitment process is more efficient as at leas half of the contacted users are actually recruited. The system achieves the highest efficiency in recruitment for task #3although the number of recruited users is only4and the task is not successfully accomplished. Fig. 9(b) plots values of GTA metric per task. In general, the tasks are not carried out with very high accuracy. The main reason is that only few users out ofN contribute to the task. The second most important reason is that not all theN users
remain for the entire duration of the task under the maximum task coverage radiusDmax. For example, task #3is carried
out with very low accuracy because few users contribute for a very short duration. As a result the penalization component in (16) diminishes considerably the achieved accuracy.
6.3.2 Analysis of User Energy Consumption
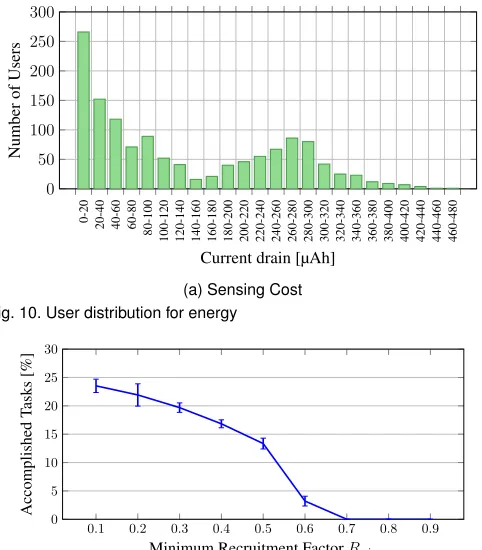
This section evaluates the battery drain of user devices. Fig. 10 shows the distribution of user energy consumption for sensing and data reporting. As expected, both distributions
follow the same profile because data after being collected from the sensor is immediately delivered. Fig. 10(a) shows the distribution of users battery consumption due to sensing operations. The results are measured in form of current drain. The vast majority of the users spends little amount of energy for sensing. The motivation is twofold. First, many users contribute to only one task and because of the mobility, they contribute for few timeslots. Second, modern sensors are designed to be energy efficient. When compared with the battery capacity available in today smartphones, which is in the order of2500mAh, it is clear that the energy consumed for sensing is negligible with respect to the energy spent for communications (see Fig. 10(b)).
6.3.3 Analysis of Model Control Parameters
Having evaluated the performance of the DSE policy, in this section we study the impact of all main parameters such as the minimum recruitment factorRminand the maximum task
coverage radiusDmax. We also evaluate the influence of the
number of users presents in the system as well as the control parametersα,β,γandσ. For the evaluation, we exploit as common performance metric the average, over 100 runs, of the number of successfully accomplished tasks. The results are expressed in percentage and the bars indicates the 95% confidence interval.
Fig. 11 evaluates the impact of the minimum recruitment factorRmin. Proper tuning of this parameter is important:
high values ofRminmake the user selection strict and only
few users will be eligible for selection. On the other hand, low values ofRminrelax the conditions for eligibility allowing the
0 1 2 3 4 5 6 7 8 9 10 11 12 13 14 15 16 17 18 19 20 21 22 23 24
0 0.2 0.4 0.6 0.8 1
Task ID
URE
(a) URE
0 1 2 3 4 5 6 7 8 9 10 11 12 13 14 15 16 17 18 19 20 21 22 23 24 0
0.2 0.4 0.6 0.8 1
Task ID
GT
A
(b) GTA Fig. 9. Evaluation of recruitment efficiency and task accuracy with the new performance metrics
0-20 20-40 40-60 60-80
80-100 100-120 120-140 140-160 160-180 180-200 200-220 220-240 240-260 260-280 280-300 300-320 320-340 340-360 360-380 380-400 400-420 420-440 440-460 460-480
0 50 100 150 200 250 300
Current drain [µAh]
Number
of
Users
(a) Sensing Cost
0-5 5-10
10-15 15-20 20-25 25-30 30-35 35-40 40-45 45-50 50-55 55-60 60-65 65-70
0 75 150 225 300 375 450
Energy [J]
Number
of
Users
(b) Communication Cost Fig. 10. User distribution for energy
0.1 0.2 0.3 0.4 0.5 0.6 0.7 0.8 0.9 0
5 10 15 20 25 30
Minimum Recruitment FactorRmin
Accomplished
Tasks
[%]
Fig. 11. Average number of successfully accomplished tasks with increasing values of minimum recruitment factorRmin
30 40 50 60 70 80 90 100 110 0
20 40 60 80 100
Maximum task coverage radiusDmax[m]
Accomplished
Tasks
[%]
Fig. 12. Average number of successfully accomplished tasks with increasing values of radiusDmax
for values ofRmin <0.5, the percentage of accomplished
tasks is higher than10 %. Indeed, contacting more users it increases the chances of havingN users assigned to a task, which is the minimum number of individual users necessary to denote the task as successfully accomplished.
Having fixed Rmin = 0.3 from this point on, Fig. 12
evaluates the impact of the maximum task coverage radius
Dmax. The higher the values Dmax assume, the larger is
the area users can be contacted. The plot highlights this
2k 3k 4k 5k 6k 7k 8k 9k 10k
0 20 40 60 80 100
Number of UsersU
Accomplished
Tasks
[%]
Fig. 13. Average number of successfully accomplished tasks with increasing number of users in the system
property and it is interesting to note a linear increase of the percentage of accomplished tasks for values ofDmaxin
the range[30−70] m, while for Dmax > 70 the increase
becomes smoother. The behavior suggests that increasing the maximum task coverage radius significantly helps to contact higher number of users and to cope with user movement. However, recruiting users far from the location of the sensing task may result in poor accuracy for particular applications. For example, if the sensing task requires users to take a picture, being closer to the location of the task is crucial. On the other hand, for the vast majority of S2aaS applications requiring monitoring of phenomena such as noise or air pollution, temperature and pressure, having users far for the location of the sensing task can be acceptable.
0.0 0.1 0.2 0.3 0.4 0.5 0.6 0.7 0.8 0.9 1.0 0
2 4 6 8 10 12
Accomplished
Tasks
[%]
(a) Parameterα
0.0 0.1 0.2 0.3 0.4 0.5 0.6 0.7 0.8 0.9 1.0 0
2 4 6 8 10
Accomplished
Tasks
[%]
(b) Parameterβ
0.0 0.1 0.2 0.3 0.4 0.5 0.6 0.7 0.8 0.9 1.0 0
5 10 15 20
Accomplished
Tasks
[%]
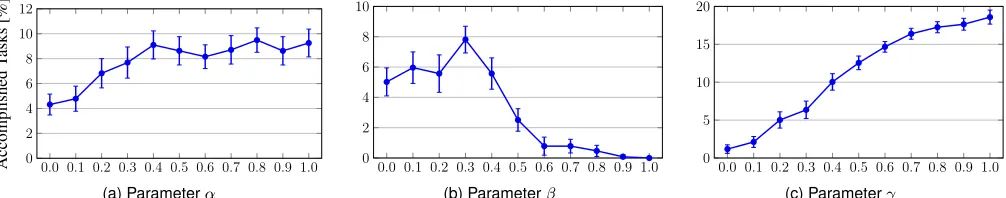
(c) Parameterγ Fig. 14. Impact of the recruiting factorRcontrol parameters on the system performance
i) the proportionality between N and U, see (10), and ii) the limited period the users move with respect to the total evaluation period (see Table 5) may lead users be active when the task already expired or did not started yet. Having setDmax= 70m, Fig. 13 shows that the number
of tasks accomplished increases with the number of usersU. The number of accomplished tasks increases substantially (around40%), when the population in the system changes from3k to7k. Because of the aforementioned reasons, the increase becomes more gentle when the number of users in the systems is greater than7k.
Having analyzed the impact of the population on the system, in the next experiments we verify the sensitivity of DSE to the control parametersα,βandγ. These parameters define the importance of distance, sociability and energy to computeR, see (2). In each experiment, we vary the value
of one parameter, while the other two are set identically so that the sum equals one. For the analysis, the number of users in the system is set to10 000. Fig. 14(a) shows the impact ofα. High values ofαmake the distance the most important factor for recruitment and the plot shows that for
α >0.4the percentage of successfully accomplished tasks remains almost constant. As a result, the selection of any values ofα >0.4are a good choice to maximize the number of accomplished tasks. Fig. 14(b) shows the impact of β, which defines the importance of sociability for R. Unlike the previous case, setting the parameterβ = 0.3 leads to the highest percentage of accomplished tasks. It is worth noting that high values ofβ, i.e.,β >0.5should be avoided. Contacting users for recruitment on the sole basis of their sociability value without considering their location or the remaining charge of the battery lowers the probability to recruit a sufficient number of users. Fig. 14(c) shows the impact ofγ, which defines the importance of the energy. The plot shows that the higher the valuesγassume, the higher
is the number of accomplished tasks. From the analysis,β
appears to be the most important for proper setting of the parameters.
Fig. 15 analyzes the impact of the parameterσ, having fixed α = 0.35, β = 0.3 and γ = 0.35 according to the previous study. The parameterσ defines the importance
of sociability and energy for task acceptance, see (8). The majority of the tasks are carried out successfully when user acceptance is mainly driven by energy, i.e.,σ < 0.3. The motivation for the high performance lies in the current evaluation settings, as most of the users have high battery charge at disposal. With the settingσ >0.8, the performance dramatically decrease because only highly sociable users accept the task.
0.0 0.1 0.2 0.3 0.4 0.5 0.6 0.7 0.8 0.9 1.0 0
10 20 30 40 50 60 70
Parameterσ
Accomplished
Tasks
[%]
Fig. 15. Impact of the parameterσdefining the acceptance factorAon the system performance
7
CONCLUSION
In this paper we have proposed a novel framework for data acquisition in MCS deployed over a fog computing platform. The cloudlets in the fog facilitate user recruitment and task completion. We present a new user recruitment policy called DSE (Distance, Sociability, Energy), which is based on the distance between users and tasks, the user sociability and the energy of user devices. Novel performance metrics are then introduced to assess the efficiency of recruitment policy and the accuracy of task completion. Performance evaluation is conducted in a real urban environment for a large number of participants. The results reveal that average number of recruited users improves by nearly 20% if compared to policies using spatial distance as the only selection criterion. Moreover, the users spend most of the energy for delivering data and not for sensing operation.
As future work, we plan to extend the work in two main directions. On one hand, we will strength the simulator ca-pabilities to take into account multiple network technologies as well as a more detailed model of computing, memory and storage requirements of cloudlets. On the other hand, we plan develop a prototype to investigate in realist scenario the performance of the framework in the fog domain.
ACKNOWLEDGMENTS
This material is based upon work supported by the U.S. National Science Foundation (NSF) under Grant No. CNS1464273, and from the National Research Fund, Luxem-bourg, in the framework of ECO-CLOUD and iShOP projects.
REFERENCES
[1] N. B. Grimmet al., “Global change and the ecology of cities,” in Science, vol. 319, no. 5864, 2008, pp. 756–760.
[3] A. Caragliu et al., “Smart cities in europe,” Journal of urban technology, vol. 18, no. 2, pp. 65–82, 2011.
[4] A. Zanellaet al., “Internet of Things for smart cities,”IEEE Internet of Things Journal, vol. 1, no. 1, pp. 22–32, Feb 2014.
[5] C. Perera et al., “Sensing as a service model for smart cities supported by Internet of Things,”Transactions on Emerging Telecom-munications Technologies, vol. 25, no. 1, pp. 81–93, 2014.
[6] A. D. Cartieret al., “IoT-Big Data Software Ecosystems for Smart Cities Sensing: Challenges, Open Issues, and Emerging Solutions,” inInternational Workshop on Cloud for IoT (CLIoT), 2016.
[7] A. Al-Fuqahaet al., “Internet of Things: A survey on enabling technologies, protocols, and applications,”IEEE Communications Surveys Tutorials, vol. 17, no. 4, pp. 2347–2376, Fourth 2015. [8] F. Bonomiet al., “Fog computing: A platform for Internet of Things
and analytics,” inBig Data and Internet of Things: A Roadmap for Smart Environments. Springer, 2014, pp. 169–186.
[9] F. Bonomiet al., “Fog computing and its role in the Internet of Things,” inWorkshop on Mobile Cloud Computing, ser. MCC ’12. ACM, 2012, pp. 13–16.
[10] S. Sarkaret al., “Assessment of the suitability of fog computing in the context of Internet of Things,”IEEE Transactions on Cloud Computing, 2015.
[11] R. Denget al., “Optimal workload allocation in fog-cloud com-puting towards balanced delay and power consumption,”IEEE Internet of Things Journal, 2016.
[12] M. Aazamet al., “Fog computing micro datacenter based dynamic resource estimation and pricing model for IoT,” inIEEE AINA, March 2015, pp. 687–694.
[13] G. Cardoneet al., “Crowdsensing in urban areas for city-scale mass gathering management: Geofencing and activity recognition,”IEEE Sensors Journal, vol. 14, no. 12, pp. 4185–4195, Dec 2014.
[14] J. G. P. Rodrigueset al., “Sensemycity: Crowdsourcing an urban sensor,”CoRR, vol. abs/1412.2070, 2014.
[15] A. Antoni´cet al., “Urban crowd sensing demonstrator: Sense the Za-greb air,” inInternational Conference on Software, Telecommunications and Computer Networks (SoftCOM), Sept 2014, pp. 423–424. [16] R. Gantiet al., “Mobile crowdsensing: current state and future
challenges,”IEEE Comm. Mag., vol. 49/11, pp. 32–39, Nov 2011. [17] W. Khanet al., “Mobile phone sensing systems: A survey,”IEEE
Communications Surveys Tutorials, vol. 15, no. 1, pp. 402–427, 2013. [18] Google Inc., “Google science journal,” 2016. [Online]. Available:
https://makingscience.withgoogle.com/science-journal/ [19] K. Noyenet al., “When money learns to fly: Towards sensing as a
service applications using bitcoin,”CoRR, vol. abs/1409.5841, 2014. [20] CEET, “The power of wireless cloud,” 2013, White Paper. [Online]. Available: http://www.ceet.unimelb.edu.au/ publications/downloads/ceet-white-paper-wireless-cloud.pdf [21] N. D. Laneet al., “Piggyback crowdsensing (PCS): Energy efficient
crowdsourcing of mobile sensor data by exploiting smartphone app opportunities,” inConference on Embedded Networked Sensor Systems. ACM, 2013, pp. 1–14.
[22] A. Capponiet al., “A cost-effective distributed framework for data collection in cloud-based mobile crowd sensing architectures,”IEEE Trans. on Sustainable Computing, vol. 2, no. 1, pp. 3–16, Jan 2017. [23] D. Hasenfratzet al., “Participatory air pollution monitoring using
smartphones,” inIn Mobile Sensing: From Smartphones and Wearables to Big Data. Beijing, China: ACM, Apr 2012.
[24] I. Schweizeret al., “Noisemap - real-time participatory noise maps,” inWorkshop on Sensing Applications on Mobile Phones, 2011, pp. 1–5. [25] S. Reddyet al., “Image browsing, processing, and clustering for participatory sensing: lessons from a dietsense prototype,” in Workshop on Embedded networked sensors. ACM, 2007, pp. 13–17. [26] K. Han et al., “Taming the uncertainty: Budget limited robust
crowdsensing through online learning,”IEEE/ACM Transactions on Networking, vol. 24, no. 3, pp. 1462–1475, June 2016.
[27] L. Wanget al., “effSense: A novel mobile crowd-sensing framework for energy-efficient and cost-effective data uploading,”IEEE Trans. Sys., Man, and Cybernetics: Systems, vol. 45/12, pp. 1549–1563, 2015. [28] J. Liuet al., “Data collection for mobile crowdsensing in the presence of selfishness,”Journal on Wireless Communications and Networking, vol. 2016, no. 1, pp. 1–10, 2016.
[29] J. Liet al., “Load balance vs utility maximization in mobile crowd sensing: A distributed approach,” inIEEE GLOBECOM, Austin, USA, December 2014, pp. 259–264.
[30] P. P. Jayaramanet al., “Scalable energy-efficient distributed data analytics for crowdsensing applications in mobile environments,” IEEE Trans. on Computational Social Systems, vol. 2/3, pp. 109–123, Sep 2015.
[31] W. Sherchanet al., “Using on-the-move mining for mobile crowd-sensing,” inIEEE MDM, July 2012, pp. 115–124.
[32] B. Kantarciet al., “Trustworthy sensing for public safety in cloud-centric Internet of Things,”IEEE Internet of Things Journal, vol. 1, no. 4, pp. 360–368, Aug 2014.
[33] M. Pouryazdanet al., “Anchor-assisted and vote-based trustworthi-ness assurance in smart city crowdsensing,”IEEE Access, vol. 4, pp. 529–541, 2016.
[34] M. Pouryazdanet al., “The smart citizen factor in trustworthy smart city crowdsensing,”IEEE IT Professional, vol. 18/4, pp. 26–33, 2016. [35] L. Huanget al., “Using reputation measurement to defend mobile social networks against malicious feedback ratings,”The Journal of Supercomputing, vol. 71, no. 6, pp. 2190–2203, 2015.
[36] S. Reddyet al., “Recruitment framework for participatory sensing data collections,” inSpringer Pervasive Computing, 2010, pp. 138–155. [37] M. Karaliopouloset al., “User recruitment for mobile crowdsensing
over opportunistic networks,” inIEEE INFOCOM, April 2015, pp. 2254–2262.
[38] H. Liet al., “Dynamic participant recruitment of mobile crowd sensing for heterogeneous sensing tasks,” inIEEE MASS, Oct 2015, pp. 136–144.
[39] D. Zhanget al., “Crowdrecruiter: Selecting participants for piggy-back crowdsensing under probabilistic coverage constraint,” inIntl. Joint Conf. on Pervasive and Ubiq. Computing, 2014, pp. 703–714. [40] S. Heet al., “Toward optimal allocation of location dependent tasks
in crowdsensing,” inIEEE INFOCOM, April 2014, pp. 745–753. [41] A. Hassaniet al., “Context-aware recruitment scheme for
oppor-tunistic mobile crowdsensing,” inIEEE ICPADS, Dec 2015, pp. 266–273.
[42] C. H. Liuet al., “Energy-aware participant selection for smartphone-enabled mobile crowd sensing,”IEEE Systems Journal, pp. 1–12, 2015.
[43] G. S. Tuncayet al., “Participant recruitment and data collection framework for opportunistic sensing: A comparative analysis,” in MobiCom Workshop on Challenged Networks, ser. CHANTS. ACM, 2013, pp. 25–30.
[44] L. Pournajafet al., “Spatial task assignment for crowd sensing with cloaked locations,” inIEEE MDM, vol. 1, July 2014, pp. 73–82. [45] J. Anet al., “A crowdsourcing assignment model based on mobile
crowd sensing in the Internet of Things,”IEEE Internet of Things Journal, vol. 2, no. 5, pp. 358–369, Oct 2015.
[46] M. Chenet al., “On the computation offloading at ad hoc cloudlet: architecture and service modes,”IEEE Communications Magazine, vol. 53, no. 6, pp. 18–24, June 2015.
[47] B. Tanget al., “A hierarchical distributed fog computing archi-tecture for big data analysis in smart cities,” inASE BigData & SocialInformatics. ACM, 2015, pp. 28:1–28:6.
[48] J. Hoydis et al., “Green small-cell networks,” IEEE Vehicular Technology Magazine, vol. 6, no. 1, pp. 37–43, March 2011.
[49] Google Inc., “Google transit,” 2016. [Online]. Available: http://www.google.com/landing/transit/cities/index.html [50] K. K. Jahromiet al., “Simulating human mobility patterns in urban
areas,”Simulation Modelling Practice and Theory, vol. 62, pp. 137 – 156, 2016.
[51] X. Panget al., “MR-LDA: An efficient topic model for classification of short text in big social data,”International Journal of Grid and High Performance Computing, vol. 8, no. 4, pp. 100–113, 2016.
[52] H. Kimet al., “A parallel tag affinity computation for social tagging systems using mapreduce,”IJBDI, vol. 1, pp. 141–150, 2014. [53] N. Hadereret al., “Towards a practical deployment of
privacy-preserving crowd-sensing tasks,” inMiddleware Posters & Demos Session. ACM, 2014, pp. 43–44.
[54] S. Luo et al., “C2: Truthful incentive mechanism for multiple cooperative tasks in mobile cloud,” inIEEE ICC, May 2016, pp. 1–6. [55] S. Wanget al., “Collaboration reputation for trustworthy web service selection in social networks,”Journal of Computer and System Sciences, vol. 82, no. 1, pp. 130 – 143, 2016.
[57] C. Robusto, “The cosine-haversine formula,”The American Mathe-matical Monthly, vol. 64, no. 1, pp. 38–40, 1957.
[58] F. Anjomshoaet al., “Mobile behaviometric framework for socia-bility assessment and identification of smartphone users,” inIEEE ISCC, Jun 2016, pp. 1084–1089.
[59] S. Scellato et al., “Exploiting place features in link prediction on location-based social networks,” inInternational Conference on Knowledge Discovery and Data Mining, ser. KDD, 2011, pp. 1046–1054. [60] J. Huanget al., “A close examination of performance and power characteristics of 4G LTE networks,” inIntl. Conf. on Mobile Systems, Applications, and Services, ser. MobiSys. ACM, 2012, pp. 225–238. [61] C. Fiandrinoet al., “Network-assisted offloading for mobile cloud
applications,” inIEEE ICC, June 2015, pp. 5833–5838.
[62] P. Serranoet al., “Per-frame energy consumption in 802.11 devices and its implication on modeling and design,”IEEE/ACM Transac-tions on Networking, vol. 23, no. 4, pp. 1243–1256, Aug 2015. [63] D. Mendezet al., “Data interpolation for participatory sensing
systems,”Pervasive & Mobile Computing, vol. 9/1, pp. 132–148, 2013. [64] D. Hristovaet al., “Measuring urban social diversity using inter-connected geo-social networks,” inInternational World Wide Web Conference (WWW), April 2016.
[65] F. Anjomshoa et al., “A mobile platform for sociability-based continuous identification,” inIEEE CAMAD, Oct 2016, pp. 149– 151.
[66] C. Fiandrinoet al., “CrowdSenSim: a simulation platform for mobile crowdsensing in realistic urban environments,”IEEE Access, Feb DOI: 10.1109/ACCESS.2017.2671678, 2017.
[67] “FXOS8700CQ: Digital Sensor - 3D Accelerometer + 3D Mag-netometer,” http://cache.nxp.com/files/sensors/doc/data_sheet/ FXOS8700CQ.pdf?pspll=1, 2015.
[68] “BMP280, Barometric Pressure Sensors,” https://www.bosch-sensortec.com/bst/products/all_products/bmp280, 2015.
Claudio Fiandrino(S’14) is a postdoctoral re-searcher at IMDEA Networks Institute, Madrid, Spain. Claudio obtained his Ph.D. degree at the University of Luxembourg in 2016. He received the Bachelor Degree in Ingegneria Telematica in 2010 and the Master Degree in Computer and Communication Networks Engineering in 2012 both from Politecnico di Torino. Claudio’s work on indoor localization over fog computing platforms received the Best Paper Award in IEEE CloudNet 2016. Claudio was a Visiting Ph.D. Student for three months at Clarkson University, NY, USA. He served as Publication and Web Chair at IEEE CloudNet 2014 and as TPC member in several IEEE and ACM conferences and workshops. His primary research interests include mobile crowdsensing, mobile cloud/fog computing, and data center communication systems.
Fazel Anjomshoais a graduate student at the Department of Electrical and Computer Engineer-ing, Clarkson University, Potsdam, NY. He re-ceived his M.Sc. and B.Eng. degrees in computer science from Universiti Teknologi Malaysia(UTM) and software engineering from Shahid Bahonar University of Kerman in 2014 and 2011, respec-tively. He got the best postgraduate student award from UTM for his outstanding contribution during his master studies. His main research interests are big data, cloud computing, internet
Burak Kantarci (S’05–M’09–SM’12) is an As-sistant Professor with the School of Electrical Engineering and Computer Science at the Uni-versity of Ottawa (Ontario, Canada). From 2014 to 2016, he was an Assistant Professor at the ECE Department at Clarkson University, where he currently holds a courtesy appointment as an assistant professor. Dr. Kantarci received the M.Sc. and Ph.D. degrees in computer engineer-ing from Istanbul Technical University, in 2005 and 2009, respectively. He received the Siemens Excellence Award in 2005 for his studies in optical burst switching. During his Ph.D. study, he studied as a Visiting Scholar with the University of Ottawa, where he completed the major content of his thesis. He has co-authored over 100 papers in established journals and conferences, and contributed to 12 book chapters. He is an Editor of the IEEE Communications Surveys and Tutorials, and an area editor of the IEEE Transactions on Green Communications and Networking.He serves as the Secretary of the IEEE ComSoc Communication Systems Integration and Modeling Technical Committee. He is a member of the ACM and a senior member of the IEEE.
Dzmitry Kliazovich(M’03-SM’12) is a Head of Innovation at ExaMotive. He was a Senior Sci-entist at the Faculty of Science, Technology, and Communication of the University of Luxembourg. Dr. Kliazovich holds an award-winning Ph.D. in In-formation and Telecommunication Technologies from the University of Trento (Italy). Dr. Kliazovich is a holder of several scientific awards from the IEEE Communications Society and European Research Consortium for Informatics and Math-ematics (ERCIM). He coordinated organization and chaired a number of highly ranked international conferences and symposia, including the IEEE International Conference on Cloud Net-working (CloudNet 2014). Dr. Kliazovich is the author of more than 100 research papers. He is the Associate Editor of the IEEE Communications Surveys and Tutorials and of the IEEE Transactions of Cloud Computing journals. He is a Vice Chair of the IEEE ComSoc Technical Commit-tee on Communications Systems Integration and Modeling. His main research activities are in the field of intelligent transportation systems, telecommunications, cloud computing, and Internet of Things (IoT).
Pascal Bouvryis a professor in the Computer Science and Communication research unit of the Faculty of Science, Technology and Com-munication at the University of Luxembourg and a faculty member at the Luxembourg Interdisci-plinary Center of Security, Reliability, and Trust. His research interests include cloud & parallel computing, optimization, security and reliability. Prof. Bouvry has a Ph.D. in computer science from the University of Grenoble (INPG), France. He is on the IEEE Cloud Computing and Elsevier Swarm and Evolutionary Computation editorial boards. He is also acting as communication vice-chair of the IEEE STC on Sustainable Computing and co-founder of the IEEE TC on Cybernetics for Cyber-Physical Systems. A full biography is available on page http://pascal.bouvry.org. Contact him at [email protected].