RVC OPEN ACCESS REPOSITORY – COPYRIGHT NOTICE
This is the author’s accepted manuscript of the following article:
GEORGIEV, M., BEAUVAIS, W. and GUITIAN, J. (2016) ‘Effect of enhanced biosecurity and
selected on-farm factors on Campylobacter colonization of chicken broilers’, Epidemiology
and Infection, pp. 1–15. doi: 10.1017/S095026881600251X.
The final publication is available at Cambridge Journals via
https://doi.org/10.1017/S095026881600251X
.
The full details of the published version of the article are as follows:
TITLE: Effect of enhanced biosecurity and selected on-farm factors on Campylobacter
colonization of chicken broilers
AUTHORS: Georgiev, M; Beauvais, W; Guitian, J
JOURNAL TITLE: Epidemiology and Infection
PUBLICATION DATE: 22 November 2016 (online)
1
Effect of enhanced biosecurity and selected on-farm
factors on campylobacter colonization of chicken broilers
M. GEORGIEV1, W. BEAUVAIS2 and J. GUITIAN2,
1
The Food Standards Agency, London, United Kingdom
2
The Royal Veterinary College, London, United Kingdom
Author for correspondence: M. Georgiev, Food Standards Agency, 125 Kingsway, London, The UK.
(Email: [email protected] )
2 SUMMARY
1
Human campylobacteriosis is the most commonly reported gastrointestinal bacterial infection in the
2
EU; poultry meat has been identified as the main source of infection. We tested the hypothesis that
3
enhanced biosecurity and other factors such as welfare status, breed, the practice of partial
4
depopulation and number of empty days between flocks may prevent Campylobacter spp. caecal
5
colonization of poultry batches at high levels (above 123000 cfu/g in pooled caecal samples). We
6
analyzed data from 2314 poultry batches sampled at slaughter in the UK in 2011-2013. We employed
7
random effects logistic regression to account for clustering of batches within farms and adjust for
8
confounding. We estimated population attributable fractions using adjusted risk ratios. Enhanced
9
biosecurity reduced the odds of colonization at partial depopulation (OR 0.25; 95%C.I. 0.14-0.47) and,
10
to a lesser extent, at final depopulation (OR 0.47; 95%C.I. 0.25-0.89). An effect of the type of breed
11
was also found. Under our assumptions, approximately 1/3 of highly colonized batches would be
12
avoided if they were all raised under enhanced biosecurity or without partial depopulation. The results
13
of the study indicate that on-farm measures can play an important role in reducing colonization of
14
broiler chickens with Campylobacter spp. and as a result human exposure.
15
16
17
18
19
20
21
22
23
24
25
3 INTRODUCTION
27
Campylobacter spp. are the most commonly reported gastrointestinal bacterial pathogen in humans in
28
the EU, responsible for an estimated cost of EUR 2.4 billion a year [1, 2].
29
Campylobacterjejuni is the species most frequently identified in human cases. The course of disease
30
varies in severity from three to six days of diarrhoea to development of complications, including
31
pancreatitis, arthritis and neurological disorders [3]. Poultry meat is considered the main source of
32
human campylobacteriosis [4], and the intestines of commercial broilers (Gallus gallus) are often
33
colonized [5, 6]. Microbial genetic data has provided further evidence of linkages between
34
Campylobacter spp. strains in poultry and humans [7, 8]. The European Food Safety Authority (EFSA)
35
has estimated that 20% to 30% of campylobacteriosis in humans may be attributed to the
36
consumption of broiler meat, and 50% to 80% of all human cases of Campylobacter jejuni to the
37
chicken reservoir as a whole[9]. An EFSA survey across 26 EU countries and two other countries in
38
Europe in 2008 [10] showed an average of 71.2 % and ranged from a minimum of 2.0% to a
39
maximum of 100.0% poultry batches testing positive at slaughter.
40
The pathogen may be introduced from the environment [11, 12] to poultry houses via different routes
41
including houseflies [13], farmers’ boots during daily operations or staff during partial depopulation
42
[14]. Further horizontal transmission occurs from infected individuals to the surrounding environment
43
and to other susceptible birds [15]. and colonization (presence of Campylobacter spp. in birds’
44
intestine) of the entire flock occurs within a matter of a few days [16]. Theoretically, enhanced
45
biosecurity in commercial farms could reduce the risk of batch colonization. However, there is limited
46
empirical evidence that supports this hypothesis. As shown by an extensive literature review on the
47
subject [15], study results are often questionable due to differences in implementation and poor study
48
design and analysis. Besides the enhancement of biosecurity, several ‘on farm’ strategies have been
49
proposed to reduce the risk of flock colonization and spread including chlorinated drinking water [17],
50
bacteriophage therapy [18] and bacteriocins [19] or the use of probiotics [20] and vaccination [21].
51
However, many of those are still currently in development or considered not feasible. Evidence to
52
assess the rationale of implementing feasible on-farm interventions such as enhancement of
53
biosecurity is therefore urgently needed.
4
Between September 2011 and August 2013, the UK poultry industry implemented a plan of enhanced
55
biosecurity (i.e. operating in each poultry house (shed) as a bio-secure unit, using protective clothes
56
and shed- specific equipment in addition to standard procedures) on a number of ‘model farms’.
57
We present an analysis of these data, including comparison of the levels of campylobacter caecal
58
colonization in batches raised in ‘model farms’ under enhanced biosecurity with control batches from
59
farms with ‘standard biosecurity’.
60
61
MATERIALS AND METHODS
62
Study population and data sources
63
We investigated campylobacter colonization in broiler chickens slaughtered in the UKbetween 1
64
September 2011 and 31 August 2013.
65
Selection of ‘model’ farms
66
Sixteen farms were selected by the industry as ‘model’ examples, where a new protocol for enhanced
67
biosecurity was implemented from August 2011. Although no formal probabilistic selection of
68
candidate farms for enhancement of biosecurity was conducted, the 16 farms (denoted with
69
alphabetic characters from A to O) were considered to apply standard production practices as in other
70
broiler farms in the UK, were geographically dispersed and belonged to three different companies.
71
Farm staff were trained and operated each poultry house (shed) as a bio-secure unit using dedicated
72
tools, garments and footwear, protective clothes and shed-specific equipment, including for garbage
73
and collection of dead birds, in addition to implementing standard procedures and highlighting the
74
importance of having specific entry and exit procedures with washing and disinfection facilities for
75
each poultry house. After the project, the procedures of enhanced biosecurity were shared with all
76
farmers and a visual guide was prepared by FSA and National Farmers Union (NFU)
77
http://www.nfuonline.com/fsa-infographic-campylobacter-biosecurity-cmyk-v3-lh-250615_not-signed-78
o/
79
Some more details on applied biosecurity measures in model farms are available in Table S1 and
80
Table S2 in the Supplementary Material (available on the Cambridge Journals Online website). Model
81
farms were located in England, Wales, Scotland and Northern Ireland and linked to different retailers.
82
The number of sheds ranged from 1 to 12 per farm.
83
5
Batches of chickens (birds which had been grown in the same shed and delivered to a
85
slaughterhouse on one single day) were the study unit. Data were collected for 1,749 batches from
86
model farms. Batches were selected so that all sheds would be sampled during the study. For
87
purpose of data analysis, the 2-year study period was divided into 16 intervals of 45 days and each
88
batch allocated to one of the 16 intervals based on the date when it was sent to the slaughterhouse.
89
Selection of control farms and batches
90
Three groups of control batches were investigated, as follows:
91
Broilers originated from different farms where standard biosecurity was applied (i.e. compliance with
92
the Red Tractor assurance scheme http://assurance.redtractor.org.uk/ ).
93
1. “control batches 1” were selected in four poultry processing plants. . Information on the number of
94
farms and origin of the batches was not available for analysis. Between April 2012 and October 2013,
95
366 batches were selected based on subjective assessments by the company veterinarians as
96
batches of similar age, kept under similar conditions and slaughtered in the same week as the
97
batches from farms with enhanced biosecurity.
98
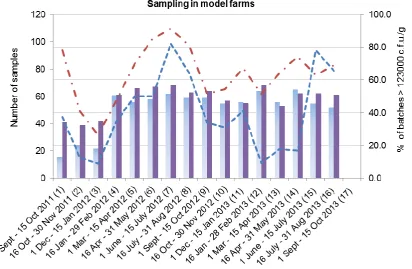
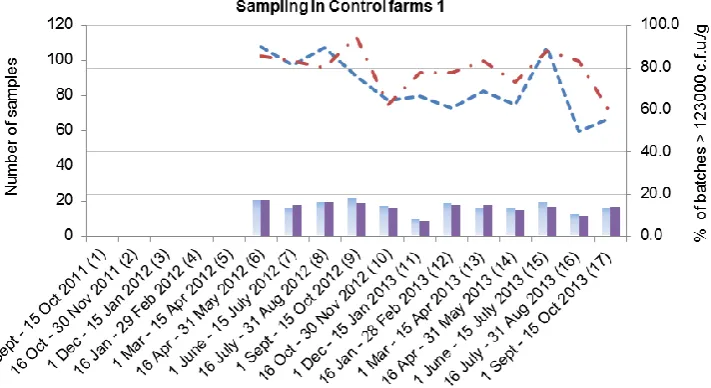
2. “control batches 2” originated from five farms selected to match five of the model farms for all
99
factors except biosecurity. A total of 30 batches were selected from these farms matched by week of
100
slaughter to the corresponding ‘model’ batches.
101
3.”control batches 3” originated from 5 farms selected to match 5 model farms (A, B, C, D and E) for
102
all factors with the exception of biosecurity. Information was collected for 136 batches in this group.
103
Chickens were tested at thinning (partial depopulation) and also at final depopulation. We did not
104
combine the batches from control farms 3 with those in control farms 2 as the investigation period was
105
different.
106
107
Sample collection and laboratory testing
108
For each of the study batches, samples were taken from the caeca of five birds in the batch in the
109
beginning of slaughter at the time of evisceration and pooled as a single sample. Samples were also
110
taken from neck skins of three birds in the batch immediately after chilling at the end of slaughter line
111
and pooled as a single sample. The birds’ carcasses were selected in a non-systematic way. All
112
samples were tested to enumerate Campylobacter spp.without further speciationaccording to the
113
agreed standards of International Organization for Standardization (ISO) ISO10272-2 2006. The
6
methodology was considered to be well established and was harmonized between the laboratories
115
used by the three poultry companies involved in the study. Results therefore allow comparison
116
between levels in caeca and neck skin and, further, with data from ongoing national monitoring in
117
slaughterhouses in the UK.
118
119
Batch-level Risk Factors
120
For batches grown in ‘model farms’, information was obtained on other husbandry factors which could
121
potentially have an influence upon colonization of broilers, namely:
122
Welfare status (data available for all 1,749 batches), defined as:
123
- ‘Higher’: broilers can be reared in the flock up to 30 kg/m2, with added enrichments
[play-124
bales, perches and artificial play-objects), the glass area of the windows is a minimum of 1-3
125
% of the floor area, according to ‘Red Tractor’ standards; or
126
- ‘Freedom Food’: stocking density is up to 30 kg/m2 and rearing of a slow growing hybrid (JA
127
87) is required;, or
128
- ‘Standard’: maximum stocking density is over 30 kg/m2.
129
Number of empty days between flocks (available for 1,693 batches, 96.8%).
130
Number of days from partial depopulation (thinning) to the end of the production cycle (available for
131
1,568 batches of the 1,654 batches where thinning was practiced, 94.8%).
132
Type of broiler hybrid (available for 1,745 batches, 99.8%).
133
134
Data analysis
135
In our analysis the outcome was a binary variable: based on caeca results, batches were classified as
136
highly colonized vs. not highly colonized. To classify a batch as ’highly colonized’ based on caeca
137
results we used the threshold value that corresponds with a neck skin count above 3 log10, which is
138
used as the high-risk threshold related to public health, jointly accepted by FSA and the poultry
139
industry. The derivation of this value was as follows.
140
Defining a threshold for high levels of campylobacter colonization
141
We examined the frequency distributions of the counts of Campylobacter spp. in caeca and neck skin
142
samples at different percentiles (1th, 5 th, 10 th, 25 th, 35 th, 50 th, 65 th, 75 th, 90 th, 95th, 99 th, and the
143
maximum values). In each of the specified percentiles, we calculated the difference between results
7
in caeca and neck skin using a log10 scale. The 95% C.I. for the resulting distribution of these
145
differences was obtained. The value at the lower confidence limit for this difference was added to the
146
level of 3 log10 of neck skin colonization.This was done because of the interest in defining a high-risk
147
threshold based on caeca results.
148
Identification of factors associated with high levels of campylobacter colonization
149
The risk of being a highly colonized batch was estimated for: batches raised under enhanced
150
biosecurity vs. batches raised under standard biosecurity (controls); batches harvested at thinning
151
(partial depopulation) vs. at the end of the cycle (depopulation); batches composed of different
152
hybrids: (Cobb 500, Cobb 500& Ross 308, Ross 308, Ross 708 and JA 87); batches with different
153
empty days before the start of the cycle: (1-7, 8-14, 15-21 and 22-47); batches with different number
154
of days between thinning and depopulation: (1-3, 4-6, 7-9, 10-12 and 13-18); batches for which
155
welfare was ‘standard’ ‘higher’ or ‘freedom food’ and batches which were slaughtered in 90 days
156
intervals between 1st September 2011 and 31st August 2013.
157
Univariate analysis was first carried out, followed by multivariate analysis to explore the combined
158
effect of multiple factors on the odds of colonization at high levels (>123000cfu/g). Four multivariate
159
models were built.
160
1. ‘biosecurity model’ a random effects logistic model was used to compare the odds of
161
colonization between batches from farms with enhanced biosecurity (model batches) and
162
batches from farms with standard biosecurity (control batches 1). The model controlled for
163
the potential effect of harvest occasion (thinning vs. depopulation) and season and accounted
164
for the fact that batches from the same farm may be more “similar” than batches from different
165
farms (i.e. within-farm clustering).
166
2. ‘risk factors within high biosecurity farms model’ a random effects logistic model was used to
167
compare the odds of colonization between batches at different harvest occasion while
168
controlling for the potential effect of type of hybrid, empty days between flocks and season.
169
As for model 1, model 2 also accounted for within-farm clustering. Only batches from model
170
farms were used in this model as data on husbandry factors were only available for model
171
farms.
172
3. ‘thinning practice model’ a random effects logistic model was used to compare the odds of
173
colonization at depopulation between batches where partial depopulation was conducted and
8
batches without partial depopulation. This model controlled for potential effect of season and
175
within-farm clustering and was limited to model batches only.
176
4. ‘A Company’s five farms model’ Conditional logistic regression was used to compare the odds
177
of colonization between batches from five farms (A-E) with enhanced biosecurity and batches
178
from five farms with standard biosecurity (control batches 3). The model controlled for harvest
179
occasion and season, and accounted for within-farm clustering.
180
Control batches 2 were not included in the multivariate models due to the data for only 16 batches at
181
thinning and 14 at depopulation.
182
Estimation of Population Attributable Fractions (PAFs)
183
We utilized the estimates of the strength of the association between i) enhanced biosecurity, ii) partial
184
depopulation and iii) hybrid type with odds of colonization at high levels (obtained from the models
185
mentioned above), to estimate the proportion of heavily colonized batches that could be attributed to
186
each of these factors (PAFs). The proportion of heavily colonized batches that would be prevented
187
was estimated under the following different scenarios: i) enhancement of biosecurity ii) elimination of
188
the practice of thinning and iii) use of low-risk hybrid types. Assumptions were made as to the
189
proportion of the total broiler population currently “exposed” to each of the 3 individual factors (i.e. all
190
flocks are under standard biosecurity, 30 % of the flocks are of hybrids with low colonization results
191
and 90% of batches are thinned; these are believed to be reasonable values for the UK broiler
192
population).
193
The ORs obtained from the regression models were converted to adjusted relative risk (RRa) values
194
[22] and used to estimate population attributable fraction (PAF) [23, 24].
195
RRa = OR/ [(1-Risk at baseline) + (Risk at baseline*OR)] (eq. 1)
196
PAF values were estimated as
197
PAF = Pd*(RRa-1)/RRa (eq. 2)
198
and where Pd is the percentage of batches exposed to factors among highly colonized batches.
199
200
9
The identified 95% C.I. 2.09 – 3.68 of differences between caeca and neck skin results on log10 scale
202
suggests that the batches positive in neck skin >1000 cfu/g (3 log10) were colonized in caeca with
203
results of at least 5.09 log10.
204
Overall, 58.6% of all the studied batches were heavily colonized (>123000 cfu/g in pooled caecal
205
samples) (Table 1). The proportion of colonized batches exhibited a seasonal pattern, with peaks
206
during the summer period (Figure 1, Figure 2).
207
208
Univariate analysis
209
In the univariate analysis, all the factors under study, except the poultry company of origin, were
210
significantly (P<0.05) associated with colonization at high levels (Table 2).
211
212
Multivariate analysis
213
Biosecurity model
214
Enhancement of biosecurity modified the effect of harvesting at thinning vs. at depopulation and vice
215
versa (Table 3). Enhancement of biosecurity reduced the odds of colonization when harvesting took
216
place at thinning (25% of the odds of infection of a standard biosecurity batch harvested at thinning)
217
but the effect was markedly reduced when harvesting took place at the end of the cycle (47% of the
218
odds of a standard biosecurity batch harvested at depopulation). A high proportion (72.9%) of batches
219
raised under standard biosecurity was already colonized at the time of thinning. Only 41.7% of
220
batches raised under enhanced biosecurity were colonized at thinning. This proportion increased to
221
64.7% when harvesting took place at depopulation.
222
The model results confirm the role of season. The likelihood of batch colonization was higher in the
223
summer.
224
Risk factors within high biosecurity farms model
225
In farms with enhanced biosecurity, batches at depopulation had three times higher odds of
226
colonization than batches at thinning (Table 4). Compared to the baseline hybrid (Ross 308), batches
227
of Cobb 500 had 53% of the odds of high colonization. The mixed Cobb 500 & Ross 308 had three
228
times higher odds of colonization compared to Ross 308. The sheds that were kept empty for up to 1
229
week were less likely to produce highly colonized batches; OR 0.69 (95% C.I. 0.49 – 0.96) than
230
batches grown after a 1-2 week empty period. An empty period between flocks in of more than 3
10
weeks was associated with 3 times higher odds of colonization than the baseline group of 1-2 weeks
232
empty period. Batches which had experienced a short period (1-3 days) between thinning and
233
depopulation had half the odds of colonization >123000 cfu/g compared with batches experiencing a
234
period of 7-9 days. There is no statistical evidence to differentiate the results of Ross 308 from JA 87,
235
Ross 708 or the mix of Cobb 500 & Ross 308.
236
Thinning practice model
237
In farms with enhanced biosecurity, flocks that were thinned had more than twice (2.63) the odds of
238
colonization at depopulation than flocks that were not thinned (Table 5).
239
A company’s five farms model
240
The results of comparing the odds of colonization in batches from five model farms matched to
241
batches from the third group of control farms are presented in Table 6. The results confirmed the
242
protective effect of enhanced biosecurity on batch colonization, the increased odds of colonization at
243
depopulation and the seasonality of batch colonization.
244
Sensitivity analysis
245
In order to assess the impact of the chosen cut-off, we repeated all univariate and multivariate
246
analyses using a lower threshold (1000 cfu/g) for classification of high-colonization based on caeca
247
results. The result of this different cut-off was that 11.4% of batches were re-classified as
highly-248
colonized. However we obtained very similar results for the risk factor analysis.
249
250
Population attributable fractions (PAF)
251
Under the assumptions that identified risk factors have a causal association with the colonization of
252
poultry batches and that the above estimates provide an unbiased measure of the association
253
between the studied exposures and colonization, the following estimates were made:
254
If all batches in the UK were raised under enhanced biosecurity an estimated 32.0% (95% C.I.
16.0%-255
41.0%) of colonized batches in the population would be avoided (Figure 3). This is under the
256
assumption that no UK farms operate under enhanced biosecurity (with the exception of model farms
257
in this study) in 2013.
258
If none of the batches were subject to thinning then an estimated 33.0% (95% C.I. 14.0%-44.0%) of
259
highly colonized batches could be avoided (Figure 4). This value assumes that thinning is currently
260
practised in 90% of batches (as observed in this study).
11
If all batches were of the hybrid types associated with a lower risk, between 4.0% and 27.0 % of batch
262
colonization could be prevented (Figure 5). In this study, more than 70.0% of batches were from those
263
hybrids associated with higher risk of colonization.
264
Interventions against different factors could be introduced simultaneously. We estimate that
265
approximately 30% (95% C.I. 13.0% - 37.0%) of highly colonized batches could be avoided in a
266
hypothetical scenario of successfully enhancing biosecurity in half of the batches, avoiding thinning in
267
a third of batches in which it is currently practiced and shifting to hybrids with a lower risk of
268
colonization in at least 30.0% of the batches being at high risk.
269
270
DISCUSSION
271
This study analyzed the impact of enhanced biosecurity measures and selected husbandry factors on
272
campylobacter colonization of broiler batches. We proposed a threshold for high colonization in caeca
273
(>123000cfu/g) by correlating caecal and neck skin results and considering the established cut-off for
274
high-risk group in neck skin.
275
Effect of Biosecurity
276
The results of the analyses undertaken provide strong evidence that enhanced biosecurity has a
277
protective effect on batch colonization at thinning, reducing the odds of high colonization by between
278
53.0% and 86.0%. At the time of depopulation, the effect of increased biosecurity is considerably
279
lower. The strong association between enhanced biosecurity and colonization at the time of thinning
280
and the subsequent attenuation of this effect at the time of total depopulation could indicate that
281
enhanced biosecurity is more effective at delaying than preventing colonization.
282
Thinning practice
283
It is likely that thinning itself can be considered to directly counter the protective effects of enhanced
284
biosecurity. That practice is at least in part responsible for the attenuation of the protective effect of
285
biosecurity by the time of depopulation, as the role of thinning as a risk factor for infection has been
286
well established [15, 18] and is also identified in this study: flocks that had been partially depopulated
287
(thinned) experienced a two times higher odds of colonization at depopulation than batches in which
288
partial depopulation had not been practised. The fact that thinning was applied to 90% of batches
289
included in this study and the strong financial motivation of the practice suggest that ceasing it
12
completely may not be feasible in the UK, since it would require additional investments in new poultry
291
houses.
292
Our findings supporting a protective effect of farm hygiene measures on batch colonization are in
293
agreement with previous studies in the Netherlands [25], the UK [26] and Denmark [27]. Other studies
294
in countries such as Norway and Iceland [28] indicated an unpredictable effect of hygienic measures
295
on farm and reported conflicting evidence.
296
Other risk factors
297
There was evidence of an association between the number of empty days between flocks and
298
colonization: batches for which the shed had been kept empty less than a week appear to be at lower
299
risk (83.0%) of colonization. The batches processed after a prolonged empty period of more than 21
300
days had a 42.0% increase in risk when compared with a period of 8 – 14 days. Previous studies
301
have also identified an association between the length of the empty period between flocks [29] and
302
potential for re-infection from the contaminated environment [30]. A prolonged empty period between
303
flocks increases the probability of the shed becoming contaminated from the environment by the time
304
when new birds are introduced.
305
A short period (1-3 days) between thinning and depopulation was also associated with a lower risk of
306
colonization compared to batches for which the period between thinning and depopulation was 7-9
307
days. The results support the existence of differences in campylobacter colonization between the
308
hybrids; these may be due to a biological characteristic of the birds, differences in the length of the
309
cycle, growth rates, age of harvest or unmeasured factors associated with the type of hybrid such as
310
diet or specific husbandry practices. Previous experimental studies showed a little impact of broiler
311
breed to the susceptibility of chicken to C. jejuni colonization, but it has been reported that in
fast-312
growing breeds the inflammatory response remains elevated for longer [31].
313
As expected, the risk of colonization exhibits a strong seasonality, with batches raised during winter at
314
significantly lower risk of colonization. The effect of season on colonization of batches has been
315
extensively reported and tentatively attributed to the ability of Campylobacter spp. to decay or
316
transform in cold conditions into a viable but nonculturable (VBNC) state which has the potential for
317
lengthy survival. Other potential seasonal effects include flies as potential carriers [32, 33] and
318
seasonal changes in farm practices [34, 35].
13
Differences that are not explained by the studied factors in the actual counts of campylobacter might
320
be attributed to additional factors such as the dose of exposure, effectiveness of the transmission, the
321
time elapsed from infection to slaughter and individual susceptibility including the influence of stress
322
factors.
323
324
The estimated PAFs suggest that one third of highly colonized batches could be prevented if all
325
farms enhanced their biosecurity to similar standards of the model farms in this study. A similar effect
326
could be achieved if none of the crops sent to the slaughterhouse had been subject to previous
327
thinning. The potential effect of raising only hybrid types identified to be of low risk was estimated to
328
be between a 4.0% and 27.0% reduction in the proportion of highly colonized batches. The expected
329
effects of interventions (PAFs) are based on estimates obtained from the study batches and assume
330
causal association between exposure and colonization. Extrapolations should be made with caution,
331
however, they provide an indication of the extent to which interventions at farm level can mitigate
332
campylobacter colonization in broiler chickens and as a result human exposure to Campylobacter
333
spp. Preventing high colonization in one third of chicken batches by improving biosecurity has the
334
potential to avert 7-10% of human cases attributed to consumption of chicken meat and drop the
335
number of cases attributed to chicken reservoir as whole by approximately one quarter, assuming that
336
the EFSA source attribution model [9] was correct. A number of limitations of the study should be
337
acknowledged. Although farms were recruited trying to avoid obvious departures from established
338
poultry production practices, farm selection was not carried out probabilistically and selection bias as
339
a result of systematic differences between the study farms and the general population of UK farms
340
cannot be ruled out. Similarly, control farms were not selected probabilistically and differences with
341
model farms, other than the level of biosecurity, cannot be excluded. Lack of information on farm of
342
origin for the main group of control batches prevented us from accounting for potential within-farm
343
clustering and within-company clustering was considered instead. We have not evaluated the
344
performance of different laboratories in the study. However, we believe that the use of standardized
345
and well-known methodology reduces potential variation between the laboratories. The batches
346
positive in caeca do not necessarily correlate perfectly with batches positive in neck skin. However,
347
high colonization in caeca is expected to result in high positive results in neck skin. The PAF values
348
are based on estimates of strength of association and of frequency of exposure obtained from poultry
14
batches grown in a non-probabilistic sample of farms and under the assumption of causal relationship
350
between exposure and colonization. The values could be interpreted as an a-priori expectation of the
351
likely effect of potential interventions. The formal assessment of effectiveness of different
352
interventions would require a randomized control trial. Despite these limitations, it seems unlikely that
353
the main findings of the study are due to these potential biases.
354
This study provides empirical evidence of the potential of enhancing biosecurity as a means of
355
reducing the proportion of heavily contaminated batches sent to slaughterhouses and eventually the
356
proportion of heavily contaminated chickens at retail. It also shows a potential to mitigate the risk of
357
heavily contaminated chicken reaching the consumer by enhancing biosecurity in combination with
358
other measures further along the poultry chain maximizing the effectiveness of intervention. The
359
existence of an interaction between enhanced biosecurity and thinning by which one modifies the
360
effect of the other implies that potential interventions should consider both simultaneously. The
361
association between breed and risk of colonization should be further explored as it is possible that
362
factors other than the characteristics of the birds are responsible.
363
Even though campylobacter is referred to as the top pathogen associated with food borne disease in
364
the EU there are no mandatory requirements for monitoring foodstuffs on microbiological criteria as
365
those contained in Commission Regulation (EC) No. 2073/ 2005 for other food-borne pathogens,
366
including Salmonella. There are indications that the controls applied for Salmonella would not
367
necessarily correlate with a decrease in the prevalence of Campylobacter spp. [36]. Studies in the
368
Netherlands [37] and Nordic countries [38] propose the implementation of threshold levels for batch
369
colonization at the end of slaughter. The results of this study justify the implementation of an
370
intervention study to confirm and quantify the impact of combined changes to biosecurity and thinning
371
including monitoring beyond the abattoir.
372
373
Acknowledgements
374
We thank the Food Standards Agency for funding and valuable comments together with other
375
members of the Joint Working Group on campylobacter. The companies Moy Park, PD Hook and 2
376
Sisters Food Group initiated and implemented the project and provided raw data and valuable advice.
377
We also thank Jane Downes andJoey Ellis-Iversen for valuable comments and advice and to all
378
those who were involved in logistics, sample collection and laboratory analyses.
15
380
Financial support
381
This work was supported by the Food Standards Agency (project FS101114).
382
383
Declaration of interest
384
None.
385
386
Ethical standards
387
The authors assert that all procedures contributing to this work comply with the ethical standards of
388
the relevant national and institutional guides.
16
REFERENCES
1. European Food Safety Authority - European Centre for Disease Prevention and Control. The
European Union summary report on trends and sources of zoonoses, zoonotic agents and food-borne outbreaks
in 2013. EFSA Journal 2015; 13: 1-165.
2. European Food Safety Authority, Panel on Biological Hazards (BIOHAZ). Scientific opinion on
campylobacter in broiler meat production: control options and performance objectives and/or targets at different
stages of the food chain. EFSA Journal 2011; 9: 1-141.
3. Heymann D. Control of Communicable Diseases Manual. American Public Health Association.
Washington, DC 2008; 19: 94-98.
4. Harris NV, Weiss NS, Nolan CM. The role of poultry and meats in the etiology of Campylobacter
jejuni/coli enteritis. American Journal of Public Health 1986; 76: 407-411.
5. Bull SA, et al. Flock health indicators and Campylobacter spp. in commercial housed broilers reared in
Great Britain. Applied and environmental microbiology 2008; 74: 5408-5413.
6. McDowell S, et al. Campylobacter spp. in conventional broiler flocks in Northern Ireland: Epidemiology
and risk factors. Preventive veterinary medicine 2008; 84: 261-276.
7. Sheppard SK, et al. Campylobacter genotyping to determine the source of human infection. Clinical
Infectious Diseases 2009; 48: 1072-1078.
8. Muellner P, et al. Molecular-based surveillance of campylobacteriosis in New Zealand–from source
attribution to genomic epidemiology. Eurosurveillance 2013; 18: pii=20365.
9. European Food Safety Authority, Panel on Biological Hazards (BIOHAZ). Scientific opinion on
quantification of the risk posed by broiler meat to human campylobacteriosis in the EU. EFSA Journal 2010; 8:
1-89.
10. European Food Safety Authority. Analysis of the baseline survey on the prevalence of campylobacter in broiler batches and of campylobacter and salmonella on broiler carcasses in the EU, 2008 Part A:
Campylobacter and Salmonella prevalence estimates. EFSA Journal 2010; 8: 1-99.
11. Bull SA, et al. Sources of Campylobacter spp. colonizing housed broiler flocks during rearing. Applied
and environmental microbiology 2006; 72: 645-652.
12. Ellis-Iversen J, et al. Persistent environmental reservoirs on farms as risk factors for campylobacter in
commercial poultry. Epidemiology and Infection 2012; 140: 916-924.
13. Shane SM, Montrose MS, Harrington KS. Transmission of Campylobacter jejuni by the housefly
(Musca domestica). Avian diseases 1985; 29: 384-391.
14. Allen V, et al. Sources and spread of thermophilic Campylobacter spp. during partial depopulation of
broiler chicken flocks. Journal of Food Protection® 2008; 71: 264-270.
15. Newell D, et al. Biosecurity-based interventions and strategies to reduce Campylobacter spp. on poultry
farms. Applied and environmental microbiology 2011; 77: 8605-8614.
16. Shreeve J, et al. The carry-over of campylobacter isolates between sequential poultry flocks. Avian
diseases 2002; 46: 378-385.
17. Ellis-Iversen J, et al. Risk factors for campylobacter colonisation during rearing of broiler flocks in Great
Britain. Preventive veterinary medicine 2009; 89: 178-184.
18. Wagenaar JA, et al. Phage therapy reduces Campylobacter jejuni colonization in broilers. Veterinary
17
19. Stern NJ, et al. Bacteriocins reduce Campylobacter jejuni colonization while bacteria producing
bacteriocins are ineffective. Microbial Ecology in Health and Disease 2008; 20: 74-79.
20. Willis W, Reid L. Investigating the effects of dietary probiotic feeding regimens on broiler chicken
production and Campylobacter jejuni presence. Poultry science 2008; 87: 606-611.
21. Buckley AM, et al. Evaluation of live-attenuated salmonella vaccines expressing campylobacter
antigens for control of C. jejuni in poultry. Vaccine 2010; 28: 1094-1105.
22. Zhang J, Yu KF. What's the relative risk? A method of correcting the odds ratio in cohort studies of
common outcomes. Jama 1998; 280: 1690-1691.
23. Potter TJ, et al. Risk factors for clinical endometritis in postpartum dairy cattle. Theriogenology 2010; 74: 127-134.
24. Williamson DF. The population attributable fraction and confounding: buyer beware. International
journal of clinical practice 2010; 64: 1019-1023.
25. Van de Giessen A, et al. Epidemiological study on risk factors and risk reducing measures for
campylobacter infections in Dutch broiler flocks. Epidemiology and infection 1996; 117: 245-250.
26. Gibbens J, et al. A trial of biosecurity as a means to control campylobacter infection of broiler chickens.
Preventive veterinary medicine 2001; 48: 85-99.
27. Rosenquist H, et al. Campylobacter contamination and the relative risk of illness from organic broiler
meat in comparison with conventional broiler meat. International journal of food microbiology 2013; 162: 226-230.
28. Wagenaar J, Mevius D, Havelaar A. Campylobacter in primary animal production and control strategies to reduce the burden of human campylobacteriosis. Scientific and Technical Review. World Organisation for Animal Health (OIE) 2006; 25: 581-594.
29. Wedderkopp A, Rattenborg E, Madsen M. National surveillance of campylobacter in broilers at
slaughter in Denmark in 1998. Avian Diseases 2000; 44: 993-999.
30. Chowdhury S, et al. Risk factors for campylobacter infection in Danish broiler chickens. Poultry
Science 2012; 91: 2701-2709.
31. Humphrey S, et al. Campylobacter jejuni is not merely a commensal in commercial broiler chickens and
affects bird welfare. MBio 2014; 5: e01364-14.
32. Hald B, Sommer HM, Skovgård H. Use of fly screens to reduce Campylobacter spp. introduction in
broiler houses. Emerging infectious diseases 2007; 13: 1951-1953.
33. Jorgensen F, et al. Influence of season and geography on Campylobacter jejuni and C. coli subtypes in
housed broiler flocks reared in Great Britain. Applied and environmental microbiology 2011; 77: 3741-3748.
34. Newell D, Fearnley C. Sources of campylobacter colonization in broiler chickens. Applied and
environmental microbiology 2003; 69: 4343-4351.
35. Powell L, et al. The prevalence of Campylobacter spp. in broiler flocks and on broiler carcases, and the
risks associated with highly contaminated carcases. Epidemiology and infection 2012; 140: 2233-2246.
36. Hue O, et al. Prevalence of and risk factors for Campylobacter spp. contamination of broiler chicken
carcasses at the slaughterhouse. Food microbiology 2010;27(8):992-9.
37. Swart AN, Mangen MJJ, Havelaar AH. RIVM Report: Microbiological criteria as a decision tool for controlling campylobacter in the broiler meat chain. RIVM, NL, 2013.
http://www.betelgeux.es/images/files/Externos/Campylobacter.pdf (accessed on 22.03.2016).
18
Table 1 Number and proportion of batches found to be colonized at different levels in pooled caecal samples (results from 2314 batches included in the UK poultry industry study on enhanced biosecurity and campylobacter colonization; UK, 2011-2013).
Results at thinning at depopulation
Control
farms 1 (%)
Control
farms 2 (%)
Control
farms 3 (%)
Model
Farms (%)
Control
farms 1 (%)
Control
farms 2 (%)
Control
farms 3 (%)
Model
Farms (%)
TOTAL
(%)
1 to <100cfu/g 21
(10.6) 4 (25.0) 29 (43.3) 338 (41.2) 23 (11.5)
0 11
(15.9)
191
(20.6)
617 (26.7)
100 to 1000 cfu/g 1
(0.5)
0 1
(1.5)
32
(3.9)
0 1
(7.1) 1 (1.4) 41 (4.4) 77 (3.3)
>1000 cfu/g 177
(88.9) 12 (75.0) 37 (55.2) 450 (54.9) 177 (88.5) 13 (92.9) 57 (82.6) 697 (75.0) 1,620 (70.0)
>1000 to ≤123000
cfu/g 32 (16.1) 2 (12.5) 2 (3.0) 108 (13.2) 17 (8.5) 3 (21.4) 3 (4.3) 96 (10.3) 263 (11.4) >123000 cfu/g 145 (72.9) 10 (62.5) 35 (52.2) 342 (41.7) 160 (80.0) 10 (71.4) 54 (78.3) 601 (64.7) 1357 (58.6)
Table 2 Univariate associations between potential risk factors and Campylobacter spp. colonization at high level (>123000 cfu/g in pooled caecal samples; results from 2314
batches included in the UK poultry industry study on enhanced biosecurity and
campylobacter colonization; UK, 2011-2013).
Variable Categories Number (%) of Batches >123000cfu/g
Number of Batches ≤123000cfu/g
p-value (chi2)i
Harvest
occasion
Thinning 532 (48.3) 570 <0.001
Depopulation 824 (68.0) 388
Biosecurity Model Farms 943 (53.9) 806 <0.001
Control farms 1 304 (76.2) 95
Control farms 2 20 (66.7) 10
Control farms 3 89 (65.4) 47
Welfare in
model farms
Standard 588 (53.5) 512 0.038
Higher 305 (53.0) 271
Freedom Foodii 50 (68.5) 23
Hybrid in model
farms
Cobb 500 183 (48.4) 195 0.001
Cobb 500& Ross 308 18 (72.0) 7
Ross 308 613 (54.5) 511
Ross 708 69 (50.4) 68
JA 87 57 (70.4) 24
Empty days
in model farms
1-7 days 233 (51.2) 218 <0.001
8-14 days 585 (54.4) 491
15-21 days 57 (48.3) 61
22-47 days 35 (72.9) 13
naiii 446 (71.8) 175
Days from
thinning to
depopulation in
model farms
1-3 days 143 (48.8) 150 <0.001
4-6 days 344 (54.4) 288
7-9 days 215 (58.0) 156
13-18 days 60 (60.6) 39
na 495 (66.4) 251
Processors
dealing with
batches of
control farms 1
Q 54 (77.14) 16 0.088
R 58 (79.5) 15
S 99 (81.8) 22
T 93 (68.9) 42
Practice of
partial
depopulation in
model farms
Thinning had been
practised
555 (66.6) 279 <0.001
Thinning had not
been practised
46 (48.4) 49
i
chi2 test on (r x c) tables;
ii
in addition to the specific welfare conditions the category requires rearing of hybrid JA 87
iii
Table 3 Results of a random effects logistic regression (Regression Model 1‘biosecurity model’) of
enhanced biosecurity, harvest occasion and sampling period on batch colonization (defined as
>123000 cfu/g in pooled caecal samples). Results from a total of 1687 batches sampled between 16th April 2012 and 31st August 2013 included in the UK poultry study on enhanced biosecurity and campylobacter colonization; UK, 2011-2013.
Factors OR (95% C.I.) P-value
Biosecurity
Standard (control farms 1) 1.00
<0.001
Enhanced (model farms) 0.25 (0.14-0.47)
Harvest occasion
Thinning (T) 1.00
0.086
Depopulation (D) 1.68 (0.93-3.03)
Interaction between biosecurity & harvest occasion
Model farm & Depopulation 1.85 (0.98-3.50) 0.059
Effect of Depopulation:
- in model farm 3.10 (2.43-3.96)
- in control farms1 1.68 (0.93-3.03)
Effect of enhanced biosecurity
- at thinning 0.25 (0.14-0.47)
- at depopulation 0.47 (0.25-0.89)
Sampling period
16 Apr – 31 May 2012 3.56 (2.26-5.61) <0.001
1 June – 31 Aug 2012 5.91 (4.00-8.73) <0.001
1 Sept - 30 Nov 2012 1.21 (0.86-1.72) 0.278
1 Dec - 28 Feb 2013 1.00
1 Mar - 31 May 2013 1.09 (0.77-1.54) 0.619
1 June - 31 Aug 2013 3.04 (2.11-4.38) <0.001
Constant 1.60 (0.88-2.88) 0.121
standard deviation of random effects 0.40 (0.25-0.63)
Table 4 Results of random effects logistic regression (Regression Model 2 ‘risk factors within high biosecurity farms model’) investigating the contribution of selected factors in model farms to
Campylobacter spp. colonization (defined as >123000 cfu/g in pooled caecal samples). Results from
a total of 1510 batches sampled between 16th October 2011 and 31st August 2013 in 16 farms with enhanced biosecurity included in the UK poultry study on enhanced biosecurity and campylobacter
colonization; UK, 2011-2013.
Factors OR (95% C.I.) P-value
Harvest occasion
Thinning 1.00 <0.001
Depopulation 3.30 (2.61-4.18)
Type of hybrid
Cobb 500 0.53 (0.31-0.89) 0.017
Cobb 500 & Ross 308 3.23 (1.08-9.63) 0.035
JA 87 1.27 (0.42-3.85) 0.670
Ross 308 1
Ross 708 0.68 (0.35-1.33) 0.266
Empty days
up to 1 week 0.69 (0.49-0.96) 0.026
1 - 2 weeks 1
2 – 3 weeks 0.90 (0.57-1.42) 0.645
> 3 weeks 3.03 (1.14-8.07) 0.027
Days to depopulation
1 – 3 days 0.57 (0.36-0.90) 0.016
4 – 6 days 0.85 (0.60-1.18) 0.337
7 - 9 days 1
10 – 12 days 0.85 (0.53-1.38) 0.521
13 – 18 days 0.48 (0.24-0.99) 0.047
Sampling period
16 Oct – 30 Nov 2011 0.74 (0.36-1.51) 0.414
1 Dec - 29 Feb 2012 0.86 (0.54-1.37) 0.526
1 Mar – 31 May 2012 1.99 (1.29-3.08) 0.002
1 June - 30 Aug 2012 7.74 (4.76-12.59) <0.001
1 Sept - 30 Nov2012 0.92 (0.59-1.42) 0.694
1 Dec - 28 Feb 2013 1
1 Mar – 31 May 2013 1.13 (0.73-1.76) 0.581
1 June - 30 Aug 2013 4.18 (2.62-6.69) <0.001
Constant 0.61 (0.37-1.01) 0.053
standard deviation of random effects 0.51 (0.29-0.90)
Interclass correlation coefficient (rho) 0.07 (0.03-0.20)
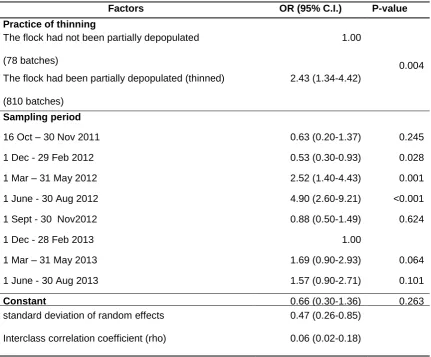
Table 5 Results of random effects logistic regression (Regression Model 3 ‘thinning practice model’)
investigating the effect of partial depopulation (thinning) on Campylobacter spp. colonization (defined
as >123000 cfu/g in pooled caecal samples) at depopulation. Results from a total of 888 batches
sampled between 16th October 2011 and 31 August 2013 included in the UK poultry study on enhanced biosecurity and campylobacter colonization; UK, 2011-2013.
Factors OR (95% C.I.) P-value
Practice of thinning
The flock had not been partially depopulated
(78 batches)
1.00
0.004 The flock had been partially depopulated (thinned)
(810 batches)
2.43 (1.34-4.42)
Sampling period
16 Oct – 30 Nov 2011 0.63 (0.20-1.37) 0.245
1 Dec - 29 Feb 2012 0.53 (0.30-0.93) 0.028
1 Mar – 31 May 2012 2.52 (1.40-4.43) 0.001
1 June - 30 Aug 2012 4.90 (2.60-9.21) <0.001
1 Sept - 30 Nov2012 0.88 (0.50-1.49) 0.624
1 Dec - 28 Feb 2013 1.00
1 Mar – 31 May 2013 1.69 (0.90-2.93) 0.064
1 June - 30 Aug 2013 1.57 (0.90-2.71) 0.101
Constant 0.66 (0.30-1.36) 0.263
standard deviation of random effects 0.47 (0.26-0.85)
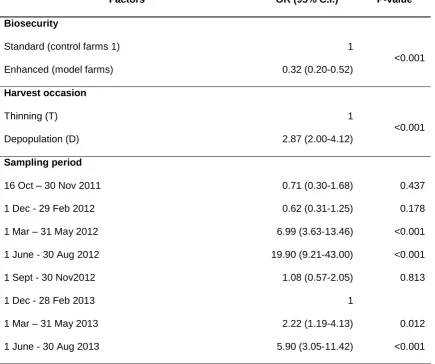
Table 6 Results of a conditional logistic regression (Regression Model 4, A company’s five farms model) of enhanced biosecurity and other factors on batch colonization (defined as >123000 cfu/g in
pooled caecal samples). Results from a total of 712 batches sampled between 16th October 2011 and 31st August 2013 included in the UK poultry study on enhanced biosecurity and campylobacter colonization; UK, 2011-2013.
Factors OR (95% C.I.) P-value
Biosecurity
Standard (control farms 1) 1
<0.001
Enhanced (model farms) 0.32 (0.20-0.52)
Harvest occasion
Thinning (T) 1
<0.001
Depopulation (D) 2.87 (2.00-4.12)
Sampling period
16 Oct – 30 Nov 2011 0.71 (0.30-1.68) 0.437
1 Dec - 29 Feb 2012 0.62 (0.31-1.25) 0.178
1 Mar – 31 May 2012 6.99 (3.63-13.46) <0.001
1 June - 30 Aug 2012 19.90 (9.21-43.00) <0.001
1 Sept - 30 Nov2012 1.08 (0.57-2.05) 0.813
1 Dec - 28 Feb 2013 1
1 Mar – 31 May 2013 2.22 (1.19-4.13) 0.012
Fig. 1. Seasonal variation in Campylobacter colonization of batches in model farms. Colonized batches are those with
Fig. 2. Seasonal variation in Campylobacter colonization of batches in control farms. Colonized batches are those
Fig. 3. Population attributable fraction (PAF) of the effect of enhanced biosecurity on batch colonization at thinning
and depopulation.
Fig. 4. Population attributable fraction (PAF) of the effect of the practice of thinning on batch colonization in model