A Simulation-Based Approach
for Railway Applications Using GPR
A. Benedetto
1, F. Tosti
2, L. Bianchini Ciampoli
1, L. Pajewski
1, D. Pirrone
1, A. Umiliaco
1, M.G. Brancadoro
11Department of Engineering, Roma Tre University Via Vito Volterra 62, 00146 Rome, Italy
[email protected], [email protected], [email protected], [email protected], [email protected], [email protected]
2School of Computing and Engineering, University of West London (UWL) St Mary's Road, Ealing, W5 5RF, London, UK
Abstract— In this work a numerical model capable to predict
the electromagnetic response of railway ballast aggregates under different physical conditions has been calibrated and validated by a simulation-based approach. The ballast model is based on the main physical and geometrical properties of its constituent material and it is generated by means of a random-sequential absorption (RSA) approach. A finite-difference time-domain (FDTD) simulator is then employed to calculate the ground-penetrating radar (GPR) signal response to the scenario. The calibration of the model has been performed by taking into account the main physical properties and the grain size characteristics of both the reference ballast material and a fine-grained pollutant material, namely, an A4 soil type material, according to the AASHTO soil classification. The synthetic GPR response has been generated by using the gprMax freeware simulator. Several scenarios have been considered, which in turn were reproduced in laboratory environment and used for the validation of the model. Promising results have demonstrated the high potential of such approach in characterizing the simulated response of complex coarse-grained heterogeneous materials.
Index Terms—GPR, railway ballast, RSA algorithm, FDTD
simulation, gprMax.
I.INTRODUCTION
Construction practices, safety inspections, and cost-effective maintenance of railway tracks require an accurate knowledge of the physical and performance properties of the construction materials involved. The characterization of such materials in a laboratory environment complying with the majority of standards and regulations from all over the world (e.g., [1]-[6]) is often expensive and not efficient, thereby causing tremendous time expenses which result in significant economic losses. Similarly, the use of test pits on the site slows down the monitoring activities of a rail line and returns low-significance ground-truth data, especially for infrastructures as extensive as railways. With regard to the typical structure of a railway track bed, the ballast plays a crucial role in the stability of the whole system, as it reduces
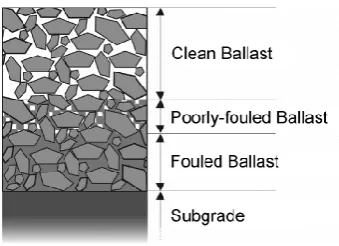
the stresses applied to the weaker interfaces, resists the vertical, lateral, and longitudinal forces applied to the sleepers, and provides proper drainage of water from the track structure. Ballast is placed between and immediately underneath the railway ties and it can be broadly classified as a uniformly graded coarse aggregate made of crushed hard rocks or, sometimes, crushed gravel material [7]. Underneath the ballast structure, the sub-ballast layer extends the above ballast tasks to greater depth; namely, the improvement of the drainage properties and the distribution of the applied train loading over the subgrade. It is usually a sand- or gravel-made material. More details about the structure and the relevant dimensions of a railway track bed can be found in [8]. Over time, ballast is progressively contaminated by fine material and metal dust, which fill the voids within the stones (Fig. 1). It can be due to several reasons, and its occurrence may affect the structural integrity and the drainage ability of the ballast system and lead to track instability, thereby causing derailments. In such a complex framework, which involves both safety and economic issues, the use of efficient and effective non-destructive testing (NDT) techniques, capable of returning rapid and reliable data, seems to be essential.
Ground-penetrating radar (GPR) is certainly one of the most powerful instruments suited for these purposes.
GPR is a wide-ranging geophysical inspection tool capable of detecting the main physical properties of the subsurface through the transmission and reception of electromagnetic (EM) waves in a given frequency band [9], and it is employed in many engineering [10], geosciences [11], and planetary disciplines [12]. With regard to the transport engineering area, many applications can be found in pavement [13]-[15] and airfield [16] engineering, as well as in the surveying of bridges [17] and tunnels [18]. In railway engineering, contributions are increasing [19]-[21] since the publication of the first literature study [22].
In this work, a novel approach for a rapid and non-destructive characterization and monitoring of the railway ballast is proposed. Starting from a range of information about the grain size of the ballast stones, two numerical-based methodologies are here employed for generating synthetic GPR responses, which in turn have been compared with the experimental results achieved in the laboratory.
II. EXPERIMENTAL FRAMEWORK
A.Methodologies
A railway ballast track bed was reconstructed in a laboratory environment by filling a tank with clean ballast, in dry conditions. The air voids of the ballast system were progressively filled with a fine-graded silty loose material, in order to simulate the presence of different levels of fouling between the grains. At each step of the fouling process, GPR measurements were carried out using several nominal frequencies of investigation.
B.Experimental set-up
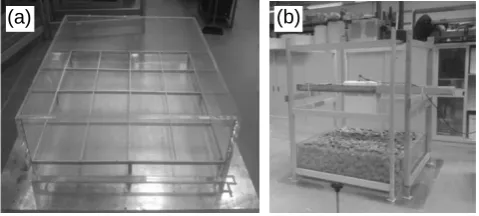
The railway track bed was manufactured by using a methacrylate tank (Fig. 2). The dimensions of the square-based tank were primarily designed to avoid any possible signal disturbance coming from the edges of the domain of investigation. In particular, inner width and length of the tank were both fixed according to the footprint of the GPR devices employed herein and are both equal to 0.147 m. The height of the tank is 0.476 m, i.e., comparable to that of a typical ballast layer. Finally, a wall thickness of 0.04 m for the tank was designed to avoid any structural weaknesses, due to the considerable weight of the ballast aggregates filling the tank.
In order to isolate the GPR signal reflected by the ballast-fouling system from the reflections coming from the underground scatterers, the tank was laid above a copper plate acting as perfect electric conductor (PEC) (Fig. 2a). In order to keep the GPR antennas at a fixed height above the surface of the ballast, a wooden framework was specifically designed (Fig. 2b).
C.Materials
The ballast used for filling up the tank is a basalt aggregate, which complies with the requirements of [1]. Its main properties are described in [23]. As far as the pollutant material is concerned, a silty loose soil material classified as A4 according to the ASSHTO soil classification [24] was used.
Fig. 2. Experimental set-up: methacrylate tank laid above a copper sheet (a), and wooden framework supporting the GPR apparatus during the
laboratory tests (b)
The main physical properties and the grading of this material are listed in Table I.
A total amount of approximately 1500 Kg of ballast and 800 Kg of fouling material was used in the setting up of the experimental configurations.
TABLE I. MAIN PHYSICAL PROPERTIES AND GRADING OF THE FINE MATERIAL FILLING THE BALLAST VOIDS IN THE EXPERIMENTAL TESTS
Property Standard Reference unit Value
Grading (wet test)
EN 933-1:2012 [2]
% passing at sieves (mm):
(4.75 - 2 – 0.425 – 0.075)
(100 – 99.6 – 99.4 – 84.7)
Liquid limit ASTM
D4318-10e1 [25] % 24.6
Plastic index ASTM
D4318-10e1 [25] % 7.6
Water content
CEN ISO/TS 17892-1:2005
[4]
% (cm3/cm3) 2.5 (4.0)
Particle density
EN ISO
17892-3:2015 [26] g/cm
3 2.5
D.GPR Devices
Three air-coupled GPR systems, manufactured by IDS Ingegneria dei Sistemi S.p.A., equipped with three different antennas of 1000 MHz and 2000 MHz central frequencies were used to test each scenario. As far as the 2000 MHz central frequency is concerned, a standard antenna and a low-powered antenna (for use in the North-American market) were employed.
E.Configurations analyzed
Table II shows the four different configurations of the ballast-fine mixture investigated in the laboratory environment. At a more detailed level, the height of the fouled layer of ballast was progressively increased with steps of 0.10 m, from zero (i.e., clean ballast conditions) up to 0.30 m (heavily fouled ballast).
Moreover, several GPR tests were carried out over a 0.10 m high single-layered configuration of silty loose material to evaluate the dielectric properties of the polluting fine material only.
TABLE II. CONFIGURATIONS OF BALLAST-FINE MIXTURES ANALYZED
Test scenario
Height of mixture
[m]
Configuration
[m]
1 0.50 0.50 m Clean Ballast (CB)
2 0.50 0.10 m Fouled Ballast (FB) +
0.40 m CB
3 0.50 0.20 m FB + 0.30 m CB
4 0.50 0.30 m FB + 0.20 m CB
5 0.10 0.10 m Pollutant
NUMERICAL MODELING
F.Simulation of the experimental domain
In order to calculate synthetic GPR signals in the presence of a railway track under different physical conditions, a random-sequential adsorption (RSA) [27] algorithm was performed to generate random bi-dimensional distributions of ballast stones. Such a method works by randomly extracting a set of circumferences representing the ballast aggregate particles, automatically positioned such that the distribution of their diameters is coherent with the grading of the ballast employed for the radar measurements (e.g. [23]). In line with this, the algorithm showed that an amount of 200 circumferences on average, with a diameter ranging from 0.025 m and 0.08 m, was required to reproduce a numerical size domain as large as the experimental one. A second algorithm allowed for the compaction of circumferences along the vertical axis, in order to guarantee contact between the grains and achieve a value of voids percentage equal to the experimental one (e.g., [23]), namely 41%. In Fig. 3, an example of the numerical reconstruction of the experimental domain is represented, after performing the aforementioned two algorithms.
Fig. 3. Cross-section of a typical structure of railway track bed relative to one experimental scenario
G.Generation of synthetic data
The EM simulation was performed by using the finite-difference time-domain (FDTD) technique implemented in the gprMax simulator [28].
The physical structure of the GPR antenna was not included in the model. The source was represented through a line of current, due to the assumption of the invariance of the problem in one direction, which allowed a lowering of the computational resources required. The field impinging on the receiver was calculated. The source was located in the free space, at a height from the target equal to the effective height
of the antenna source. The output point was also located in the free space, at the same height as the source and at a distance of 0.30 m from it. The first derivative of a Gaussian pulse was used for the time shape of the emitted field.
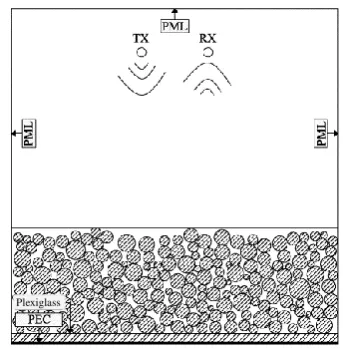
Below the ballast sample, two layers with appropriate permittivity were introduced to simulate the methacrylate and PEC layers, respectively. In order to avoid any border reflective effects, a perfectly matched layer (PML) was placed at the side and at the top of the simulation domain, with 10 layers. The geometry of the simulated scenario is depicted in Fig. 4.
Fig. 4. Synthetic domain as result of the combination of the numerical simulations of the distribution of ballast stones and the definition of the EM
domain to be implemented in gprMax 2D
Besides the geometric features of the domain, the simulator was set with a value of the spatial discretization in line with the wavelength of the working central frequency as well as with the size and shape of the involved targets, thereby affecting the resolution of the synthetic wave.
As far as the dielectric properties of the materials are concerned, all the involved media were assumed to be linear and isotropic, possibly lossy. The frequency-dispersive properties of the constitutive parameters were neglected. Literature values were taken into account for characterizing the methacrylate layer, the metal sheet, and the air-filled spaces, as well as for assigning proper electrical conductivity values σ to the surveyed materials [29]. Conversely, the relative dielectric permittivity values εr of both the ballast aggregates and the fouling materials were assessed through a calibration procedure based on empirical tests. In particular, a time-domain signal picking (TDSP) technique [30] was performed. A value of total dielectric permittivity εr,tot has been here determined by the temporal delay between the reflections from the air-ballast and the ballast-PEC interfaces, once the thickness of the ballast layer h was known. The same technique was applied at configuration 5 (i.e., Table II) for retrieving the dielectric permittivity of the polluting soil εr,soil.
With respect to the dielectric permittivity of the single stone of ballast εr,b to be set in gprMax, this was found to depend on the air-filled void percentage, due to the
dimensional approximation of the scenario. This can be an issue when the multi-layered case of ballast fouling is considered, which involves a portion of voids filled with the polluting soil. In such a case, the simulations showed that assuming a literature value of εr,b leads to an underestimate of εr,tot. This implies an anticipated peak, reported to the back-reflection from the PEC, in the received synthetic signals. To overcome this issue, a set of simulation geometries was generated and tested, with varying void percentages. The permittivity εr,b was inferred by using a volumetric mixing formula [31], expressed by:
εr,totα=∑ f
iεr,i α= n
i=1 fbεr,bα+fsεr,sα+fmεr,αm (1) with fi being the volumetric fraction of the i-th material, and with the indexes b, s and m indicating the ballast, soil, and methacrylate components, respectively. The α exponent is a geometric fitting parameter, which is assumed to be equal to 0.5 in the literature [32].
In Fig. 5 the results of this process and the linear fitting curve between the air-filled voids percentage and the value of εr,b to be set in gprMax are shown.
Fig. 5. Linear fitting curve between the percentage of air-filled voids and the value of εr,b to be set in gprMax
III. RESULTS
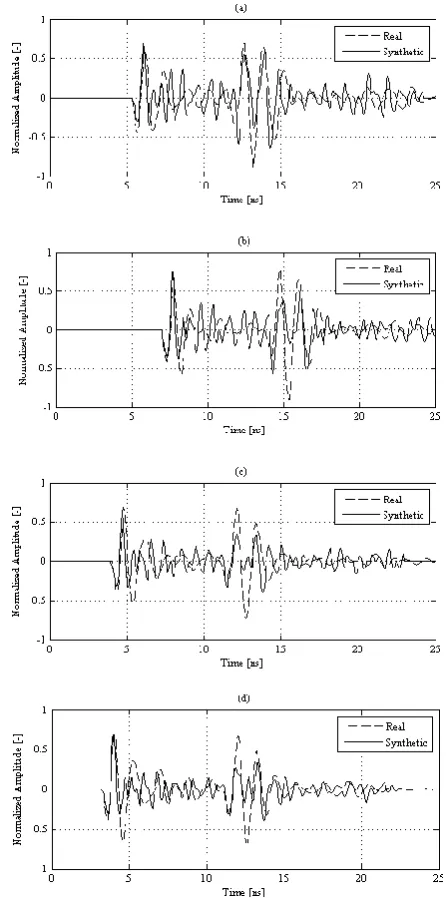
At the preliminary stage of the research, the simulations of the data were performed using the 1000 MHz central frequency. A first comparison between real and synthetic data is reported in Fig. 6, wherein the four different configurations are sorted by the increasing fouling content, from (a) to (d). It is evident how the synthetic signals are encouragingly representative of the real signals, especially with respect to the permittivity of the multiphase ballast-air-soil system, which mainly affects the temporal distance between the first main peak (i.e., air/ballast interface) and the second main one (i.e., methacrylate-PEC).
Concerning the analysis of the amplitude values, the model performs particularly well for the low-fouling content configurations (i.e., Fig. 6a and Fig. 6b), whereas it tends to over attenuate the signal when the content of pollutant increases (i.e., Fig. 6c and Fig. 6d). With regard to the signal response between the top and the bottom interfaces of the domain, it appears to be highly dependent on the specific distribution of the ballast grains. This particular issue is likely to be even more significant for GPR systems with higher central frequencies of investigation.
Fig. 6. Comparison between real and simulated data: 0.50 m clean ballast (a), 0.10 m fouled ballast beneath 0.40 m clean ballast (b), 0.20 m
fouled ballast beneath 0.30 m clean ballast (c), 0.30 m fouled ballast beneath 0.20 m clean ballast (d)
Promising results are proved by the comparison of the signals, which show good potential in predicting the EM response of the different configurations, thereby paving the way to the possibility of predicting the presence of fouling within the ballast matrix directly by GPR.
At the current state of the art, the limit of the model lies in the direct dependence on the values of dielectric permittivity set for the ballast, which need to be calibrated with respect to the percentage of air-filled voids. This issue might be addressed by generating three-dimensional random geometries in order to better simulate the real distribution of voids in the solid matrix.
In the process of refining the numerical model to a higher level of representativeness of the real case, the implementation of a more realistic geometry for the ballast aggregates would guarantee more reliable results than the use of circumferences. Indeed, from a diffractive and reflective point of view, an angle-less surface such as a circumference exhibits a different EM behavior to that of a polygonal surface.
Furthermore, an improved agreement between synthetic and experimental results may be achieved by taking into account the physical structure of the horn antenna in the model. With this aim in mind, it would not be strictly necessary to implement a three-dimensional model of the scenario. Indeed, as is shown in [33], the EM field emitted by a GPR horn antenna can be very effectively reproduced by means of a suitable set of current lines.
ACKNOWLEDGMENTS
The authors express their thanks to Mr. Spartaco Cera, from Roma Tre University, for the assistance during the laboratory surveys and for providing invaluable help in this study, IDS Ingegneria dei Sistemi S.p.A., for supplying a part of the radar systems, and Clax Italia s.r.l., for manufacturing the methacrylate tank. This work has also benefited from the network activities carried out within the EU funded COST Action TU1208 “Civil Engineering Applications of Ground Penetrating Radar.”
REFERENCES
[1] EN 13450:2002/AC:2004. Aggregates for railway ballast.
European Committee for Standardization, 2004.
[2] EN 933-1:2012. Tests for geometrical properties of aggregates
- Part 1: Determination of particle size distribution - Sieving method. European Committee for Standardization, 2012.
[3] EN 1097-2:2010. Tests for mechanical and physical properties
of aggregates - Part 2: Methods for the determination of resistance to fragmentation. European Committee for Standardization, 2010.
[4] CEN ISO/TS 17892-1:2014. Geotechnical investigation and
testing - Laboratory testing of soil - Part 1: Determination of water content (ISO 17892-1:2014). European Committee for Standardization, 2014.
[5] ASTM D7263-09, “Standard Test Methods for Laboratory
Determination of Density (Unit Weight) of Soil Specimens,” ASTM International, West Conshohocken, PA, 2009.
[6] EN 1097-3:1998. Tests for mechanical and physical properties
of aggregates - Part 3: Determination of loose bulk density and voids. European Committee for Standardization, 1998.
[7] M. R. Clark, R. Gillespie, T. Kemp, D. M. McCann, and M.
C. Forde, “Electromagnetic properties of railway ballast,” NDT & E International, vol. 34, pp. 305–311, 2001.
[8] R. Roberts, I. Al-Qadi, E. Tutumluer, J. Boyle, and T. R.
Sussmann, “Advances in Railroad Ballast Evaluation Using 2 GHz Horn Antennas”, in Proc. 11th International Conference on Ground Penetrating Radar, Columbus, OH., USA, June 19-22, 2006.
[9] D. J. Daniels, Ground Penetrating Radar, 2nd Edition.
London, U.K.: The Inst. Electrical Eng., 2004.
[10]A. Benedetto and L. Pajewski, Civil Engineering Applications
of Ground Penetrating Radar. Springer Transactions in Civil and Environmental Engineering Book Series, 2015.
[11]A. K. Benson, “Applications of ground penetrating radar in
assessing some geological hazards: examples of groundwater contamination, faults, cavities,” Journal of Applied Geophysics, vol. 33 (1-3), pp. 177–193, 2001.
[12]F. Tosti and L. Pajewski, “Applications of radar systems in
Planetary Sciences: an overview,” Chapt. 15 - In: A. Benedetto & L. Pajewski (Eds.), Civil Engineering Applications of Ground Penetrating Radar, Springer Transactions in Civil and Environmental Engineering Book Series, pp. 361–371, 2015. ISBN 978-3-319-04812-3. DOI 10.1007/978-3-319-04813-0_15.
[13]I. L. Al-Qadi and S. Lahouar, “Measuring rebar cover depth
in rigid pavements with ground-penetrating radar,” Transportation Research Record, vol. 1907, pp. 81-85, 2005.
[14]F. Tosti, A. Benedetto, L. Bianchini Ciampoli, S. Lambot, C.
Patriarca, and E. C. Slob, “GPR analysis of clayey soil behaviour in unsaturated conditions for pavement engineering and geoscience applications,” Near Surface Geophysics, vol. 14 (2), pp. 127 – 144, 2016.
[15]A. Benedetto, F. Tosti, L. Pajewski, F. D’Amico, and W.
Kusayanagi, “FDTD simulation of the GPR signal for effective inspection of pavement damages”, in: Proc. of the 15th International Conference on Ground Penetrating Radar, Bruxelles, Belgium, June 30–July 4, 2014, pp. 513-518, doi:10.1109/ICGPR.2014.6970477.
[16]A. Benedetto and F. Tosti, “Inferring bearing ratio of unbound
materials from dielectric properties using GPR: the case of Runaway Safety Areas,” in Proc. Airfield and Highway Pavement 2013: Sustainable and Efficient Pavements, Los
Angeles, USA, June 2013, pp. 1336–1347. doi:
10.1061/9780784413005.113., 2013.
[17]A. Benedetto, G. Manacorda, A. Simi, and F. Tosti, “Novel
perspectives in bridge inspections using GPR,”
Nondestructive Testing Evaluation, vol. 27(3), pp. 239–251, 2012.
[18]A. M. Alani and K. Banks, “Applications of ground
penetrating radar in the Medway Tunnel - Inspection of structural joints”, in Proc. 15th International Conference of Ground Penetrating Radar (GPR 2014), Brussels, Belgium, Jun. – Jul. 2014, art. no. 6970466, pp. 461–464.
[19]J. Hugenschmidt, “Railway track inspection using GPR”,
[20]Z. Leng and I. L. Al-Qadi, “Railroad ballast evaluation using ground-penetrating radar,” Transportation Research Record: Journal of the Transportation Research Board, no. 2159, pp. 110–1117, 2010.
[21]F. De Chiara, “Improvement of railway track diagnosis using
ground penetrating radar,” PhD Thesis, 2014.
[22]Railway Track and Structures Magazine, June 1985.
[23]F. Tosti, A. Benedetto, A. Calvi, and L. Bianchini Ciampoli,
“Laboratory Investigations for the Electromagnetic Characterization of Railway Ballast through GPR”, in Proc. 16th International Conference of Ground Penetrating Radar (GPR 2016), Hong Kong, June 13-16, 2016.
[24]American Association of State Highway and Transportation
Officials (AASHTO), 2011. Roadside Design Guide, 4th edition. AASHTO, Washington, DC.
[25]ASTM D4318-10e1, Standard Test Methods for Liquid Limit,
Plastic Limit, and Plasticity Index of Soils, ASTM International, West Conshohocken, PA, 2010.
[26]EN ISO 17892-3:2015. Geotechnical investigation and testing
- Laboratory testing of soil - Part 3: Determination of particle density (ISO 17892-3:2015, Corrected version 2015-12-15). European Committee for Standardization, 2015.
[27]A. Benedetto and A Umiliaco, “Evaluation of hydraulic
permeability of open-graded asphalt mixes using a full numerical simulation”, Journal of Materials in Civil Engineering, 26 (4), pp. 599-606, 2014.
[28]A. Giannopoulos, “Modelling ground penetrating radar by
GprMax,” Construction and Building Materials, vol. 19(10), pp. 755-762, 2005.
[29]C. Patriarca, F. Tosti, C. Velds, A. Benedetto, S. Lambot, and
E. Slob, “Frequency dependent electric properties of homogeneous multi-phase lossy media in the ground-penetrating radar frequency range”, Journal of Applied Geophysics, 97, pp. 81-88, 2013.
[30]R. Wu, J. Li, and Z. S. Liu, “Super resolution time delay
estimation via MODEWRELAX,” IEEE Transactions on Aerospace and Electronic Systems, vol. 35 (1), 294–307, 1999.
[31]A. P. Tran, M. R. M. Ardekani, and S. Lambot, “Coupling of
dielectric mixing models with full-wave ground-penetrating radar signal inversion for sandy-soil-moisture estimation”, Geophysics, vol. 77, 2012.
[32]J. R. Birchack, C. G. Gardner, J. E. Hipp, and J. M. Victor,
“High Dielectric Constant Microwave Probes for Sensing Soil Moisture”, Proceedings Of The IEEE, vol. 62 (1), 1974.
[33]C. Eyraud, S. Nounouh, A. Litman, and H. Tortel,