A brief overview of the development process for
written, self-report, health-related surveys
Carol Hagino,
BSc, MBA, MSc candidate (U of T, Fac of Med)
*
Objective and Rationale: The objective of this paper
is to present a comprehensive, yet brief, flowchart type
of overview of the salient literature describing the key
chronological steps involved in developing “pencil and
paper,” self-report, health-related survey instruments –
particularly survey instruments which endeavor to
measure abstract construct such as “quality of life,”
“disability,” or “productivity.”
This overview was designed to serve as a convenient
reference guide for individuals who need to understand
the basics of the whole process. Because it does not
describe any of the steps in detail, the flowchart will
likely be most useful to individuals who have at least
some prior familiarity with the concepts, procedures and
analyses mentioned, yet are not fully “expert” in this
topic area. In short, this overview is not actually meant
to be a “checklist” of key steps; brief explanations are
included in order to remind the – at least somewhat –
initiated user of the concepts mentioned, without the
reader necessarily having to look them up elsewhere.
Design: This is a distillation of the salient
survey-development literature into a procedural overview
flowchart.
Method: This overview was a distillation of several
authoritative sources in the literature covering the key
areas of questionnaire development and psychometric
theory. The overview flowchart was constructed in the
form of 5 chronological, developmental phases, which
formed the overall framework:
Part 1: Defining the Intended Purpose of the Survey
Instrument
Part 2: Item Generation
Objectif et raison d’être : Cet article a pour but de
présenter un diagramme général détaillé, quoique bref,
de l’importante documentation décrivant les étapes
chronologiques clés du développement d’instruments
d’auto-évaluation, sous forme d’enquête crayon-papier,
en matière de santé – en particulier, des instruments
dédiés à l’évaluation de concepts abstraits tels que
« qualité de vie », « l’incapacité » et « la productivité ».
On a conçu cette vue d’ensemble pour qu’elle serve
de guide de référence pratique aux personnes qui ont
besoin de comprendre les bases du procédé global.
Puisqu’il ne décrit pas les étapes en détail, le diagramme
sera vraisemblablement le plus utile aux personnes ayant
acquis une certaine connaissance des concepts, des
procédures et des analyses traités, sans être des
« experts » dans le domaine. En bref, cette vue
d’ensemble n’est pas une liste de contrôle des étapes
clés; de brèves explications sont incluses pour rappeler
aux usagers plus ou moins initiés les concepts
mentionnés, sans que le lecteur doive les consulter
ailleurs.
Présentation : Extraction en un diagramme général
de procédures de l’importante documentation sur le
développement de sondages.
Méthode : La vue d’ensemble est constituée de
différentes sources documentaires qui traitent des parties
clés du développement de questionnaire et de la théorie
de psychométrie. Le diagramme a été conçu en cinq
phases chronologiques de développement qui forment le
cadre général :
1
èrepartie : Définition de l’objectif visé par l’instrument
d’enquête
2
epartie : Génération des éléments
* Canadian Memorial Chiropractic College,
Introduction
Self-report survey instruments (questionnaires) which
measure the degree of, and changes in, various aspects of
health status are frequently-used tools within health-care
research and clinical practice. Within the English language
itself there is a plethora of generic and disease-specific
self-report questionnaires which attempt to measure a
va-riety abstract constructs such as physical disability, mental
well-being, pain, and quality of life.
The reader should note that some authors use the term
“scale” interchangeably with item-response options
(item-response scales), the entire questionnaire
(sum-mative scales), or sections of the entire questionnaire
(summative subscales). This sometimes creates confusion
for some readers as to what exactly a “scale” actually is;
therefore, for the purposes of this paper, the term “scale”
will refer to:
1. Item (question) response options; for e.g., a Likert Scale
for each item might consist of the following response
options: 1 = strongly agree, 2 = somewhat agree, 3 =
don’t know, 4 = somewhat disagree, 5 = strongly
dis-agree.
2. Sections of the entire questionnaire (summative
subscales) forming their own distinct construct. The
entire questionnaire will NOT be referred to as a
“scale”; rather, it will be referred to as a survey
instru-ment, survey, or questionnaire.
Part 3: Item Reduction
Part 4: Psychometric Testing and Further Item
Reduction
Part 5: Final Revision of the Prototype Into a Useable
Survey Instrument (Questionnaire).
The flow-chart was assessed for face and content validity
by 3 questionnaire-development experts.
Results and Conclusion: This paper presented a
fairly comprehensive, yet brief, flowchart type of
overview of the salient current literature describing the
key chronological steps involved in developing “pencil
and paper,” self-report, health-related survey
instruments – particularly survey instruments which
endeavor to measure abstract constructs such as
“quality of life,” “disability,” or “productivity.” It was
emphasized that this overview is meant to be a
convenient “big-picture” visualization-aid, as well as a
review and reference-guide for investigators who are
already familiar with most of the methodological steps
and concepts involved.
(JCCA 2002; 46(1):11–21)
K E Y W O R D S
: questionnaires, health surveys, algorithm,
questionnaire development, validation, reliability,
reproducibility of results, psychometrics, clinimetrics,
factor analysis, health status indicators.
3
epartie : Réduction des éléments
4
epartie : Test psychométrique et autres réductions des
éléments
5
epartie : Révision finale du prototype et création de
l’instrument d’enquête (questionnaire)
Le diagramme a été validé sur le fond et la forme par
trois experts en développement de questionnaire.
Résultats et conclusion : Cet article présente une
vue d’ensemble, de type diagramme, détaillée, quoique
brève, de l’importante documentation actuelle décrivant
les étapes chronologiques clés du développement
d’instruments d’auto-évaluation, sous forme de sondage
crayon-papier, en matière de santé. En particulier, des
instruments de sondage dédiés à l’évaluation de concepts
abstraits tels que « la qualité de vie », « l’incapacité » et
« la productivité ». L’accent a été mis sur le fait que ce
diagramme est une vue d’ensemble qui constitue une
aide visuelle, de même qu’une révision et un guide de
référence, pour les enquêteurs qui connaissent déjà la
plupart des étapes méthodologiques et des concepts
traités.
(JACC 2002; 46(1):11–21)
M O T S C L É S
: questionnaires, enquêtes sur la santé,
Prior to the 1980s, and particularly during the 1970s,
there was an overwhelming proliferation of casually
de-veloped survey instruments, which led, of necessity, to
relatively objective means of separating the useful from
the useless instruments; hence, the advent of clinimetric
and psychometric methods of developing and testing
sur-vey instruments.
12More widespread knowledge of these
methods subsequently resulted in increasing demands for
instruments which were developed accordingly.
Unfortu-nately, these methods are quite complex,
3,9,13and appear
in the current English language literature as specialized
articles presented in isolation of the whole
proce-dure,
8,10,12,18or else are described in such detail
1,15,16that
the inexpert reader may lose sight of the overall
methodo-logical “picture,” and hence, which position in the overall
“picture” a certain step may occupy. Aday,
1DeVellis
2and
others
4,5provide overviews of the process, but these
overviews are clearly not meant to be as detailed as the
present overview is.
At this writing, there does not appear to be any one
publication which distills all of this information down into
a brief, yet fairly comprehensive summary of the key
steps. It is therefore the purpose of this paper to provide
such a summary. Specifically, the objective of this paper is
to present a comprehensive, yet brief, flowchart type of
overview of the salient literature describing the main
chronological steps involved in developing “pencil and
paper,” self-report, health-related survey instruments –
particularly survey instruments which endeavor to
meas-ure abstract constructs such as “quality of life,”
“disabil-ity,” or “productivity.”
This overview flowchart is meant to be a convenient
“big-picture” visualization-aid, as well as a brief review
and reference-guide for investigators who are already
fa-miliar – or were once fafa-miliar! – with most of the main
methodological steps and concepts involved; for
investi-gators who are not familiar with these steps, it is
recom-mended that they consult the references cited for more
detailed explanations.
Method
This overview was assembled from several authoritative
sources in the literature covering the key areas of
question-naire development and psychometric theory.
1–3,9–16,18The
decision as to which publications comprised “authoritative
sources in the literature” was based on the
recommenda-tions of 3 well-respected and well-published experts in the
area of survey-instrument development.
Collectively, these publications describe all the relevant
steps in considerable detail, but none of them individually
summarizes all these steps into one relatively brief yet
fairly comprehensive, chronological overview of the
en-tire development process.
The overview flowchart was constructed in the form of
5 chronological, developmental phases, which formed the
overall framework:
Part 1: Defining the Intended Purpose of the Survey
In-strument
Part 2: Item Generation
Part 3: Item Reduction
Part 4: Psychometric Testing and Further Item Reduction
Part 5: Final Revision of the Prototype Into a Useable
Survey Instrument (Questionnaire).
The framework presented here was synthesized
prima-rily from that used by McConnell et al.
11for describing
the development of the DASH (Disabilities of the Arm,
Shoulder and Hand) Outcome Measure; but also used,
were the questionnaire development guidelines offered by
DeVellis,
2Aday
1, Portney and Watkins,
14McConnell et
al.,
11but with the more detailed psychometric-testing steps
extracted from Ware,
18and Bernstein and Nunnally.
13None of the above sources included all of the steps
shown in the flowchart; however, the source most closely
resembling the present paper’s flowchart was that of
McConnell at al.
11The reason for the seeming
“discrepan-cies” appears to primarily be that some sources simply
described the process in greater detail than others. Some
sources also appeared to present a slightly different
se-quence of clinimetric relative to psychometric testing; but
upon closer scrutiny, it became evident that there were
times when the 2 approaches could be occurring
simulta-neously or in an alternating piece-meal fashion.
While some steps included within these phases are
de-scribed in greater detail than others, these descriptions are
not intended to be detailed discussions of the concepts and
methods involved; rather, all accompanying descriptions
are presented with a view to refreshing the reader’s
memory, with the assumption that the reader has at some
point read about most of these steps previously.
Results
As stated above in the Methods section, the overview
flowchart presented here (Figure 1) is structured on a
framework of 5 main chronological sections, which will
first be listed and then briefly described below:
Part 1: Defining the Intended Purpose of the Survey
In-strument
Part 2: Item Generation
Part 3: Qualitative (clinimetric) Item Reduction
Part 4: Psychometric Testing and Further Item Reduction
Part 5: Final Revision of the Prototype Into a Useable
Survey Instrument (Questionnaire).
Part 1: Defining the Intended Purpose
of the Survey Instrument
Defining the specific purpose of the survey instrument,
and how the data will be used, is a crucial first step in its
development. Focusing and refining the domain of the
items (i.e. the underlying construct) to meet the objectives
at this early stage can help prevent unnecessary revisions
later on, and can help efficiency in administration and
analysis. Assessing what kinds of styles of questions in a
given area have been tested and refined previously may
also save the investigator considerable work.
Part 2: Item Generation
Once the specific purpose of the survey instrument, and
the exact constructs to be measured have been defined, the
questions/items operationalizing these constructs can be
generated via the steps shown in this section. At this stage,
it does not matter that the item list is perhaps staggeringly
long. The main aim of this stage of the procedure is to
generate a list of items which thoroughly encompasses the
construct(s) of interest.
Part 3: Qualitative (clinimetric) Item Reduction
Once the list of items is judged to be as complete as
possi-ble, it will likely be evident that a survey instrument
con-sisting of this many items will be an unacceptable burden
to target respondents; therefore, this section focuses on
reducing the number of items, while still maintaining
Con-tent Validity. At this stage, the procedure primarily
in-volves clinimetric (i.e. centered on what clinicians and
patients deem to be clinically relevant and acceptable) and
other qualitatively driven approaches to item reduction.
The reader should note that quantitative-data driven
approaches to item reduction mainly come into play
dur-ing the next section, Part 4: Psychometric Testdur-ing and
Further Item Reduction. The reader should also note that
the terms “classical” and “contemporary” approaches
will periodically be evident in both parts 3 and 4, and that
both qualitative and quantitative-data driven approaches
of item reduction incorporate each of the classical and
more contemporary methods. Some contemporary
ap-proaches are more flexible and sophisticated than their
classical counterparts, and have become more feasible to
use now with the availability of adequately powerful
elec-tronic methods to administer surveys and analyze complex
response data patterns.
Part 4: Psychometric Testing and
Further Item Reduction
At this stage, the remaining items and their subscales must
demonstrate classical scaling assumptions for summated,
unweighted scales, and hence be able to show that their
psychometric properties are acceptable; that is, that they
yield fairly normally distributed item endorsements, good
item-to-scale convergent and divergent validity, and
also yield reliable (i.e. stable), responsive, and otherwise
valid data. Items and subscales which do not perform
ac-ceptably must be considered for removal from the survey
instrument.
Part 5: Final Revision of the Prototype Into a
Useable Survey Instrument (Questionnaire)
At the end of this stage, the survey instrument will emerge
in about as valid a form as can be expected for the given
target respondents at that particular point in time, and with
the given development techniques. While it will likely not
be flawless, it will probably at least be judged capable of
providing data which are acceptably useful for fulfilling
the instrument’s objective.
Discussion
Figure 1
An Overview of the Development Process for Written, Self-report, Health-related Surveys
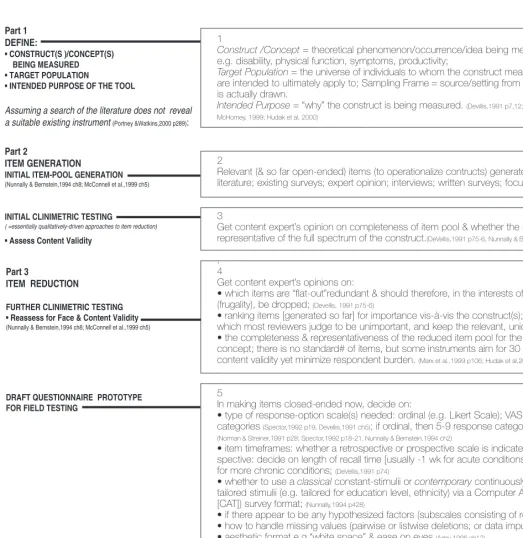
1
Construct /Concept = theoretical phenomenon/occurrence/idea being measured; e.g. disability, physical function, symptoms, productivity;
Target Population = the universe of individuals to whom the construct measurements are intended to ultimately apply to; Sampling Frame = source/setting from which sample is actually drawn.
Intended Purpose = “why” the construct is being measured. (Devillis,1991 p7,12; Spector,1992 p14; McHorney, 1999; Hudak et al, 2000)
2
Relevant (& so far open-ended) items (to operationalize contructs) generated from: literature; existing surveys; expert opinion; interviews; written surveys; focus groups.
3
Get content expert’s opinion on completeness of item pool & whether the item pool is representative of the full spectrum of the construct.(DeVellis,1991 p75-6, Nunnally & Bernstein,1994 p102)
.
4
Get content expert’s opinions on:
• which items are “flat-out”redundant & should therefore, in the interests of “parsimony” (frugality), be dropped; (Devellis, 1991 p75-6)
• ranking items [generated so far] for importance vis-à-vis the construct(s); drop items which most reviewers judge to be unimportant, and keep the relevant, unique items; • the completeness & representativeness of the reduced item pool for the intended concept; there is no standard# of items, but some instruments aim for 30 in to maximize content validity yet minimize respondent burden. (Marx et al.,1999 p106; Hudak et al,2000 p7).
5
In making items closed-ended now, decide on:
• type of response-option scale(s) needed: ordinal (e.g. Likert Scale); VAS; binary categories (Spector,1992 p19, Devellis,1991 ch5); if ordinal, then 5-9 response categories are best (Norman & Streiner,1991 p28; Spector,1992 p18-21, Nunnally & Bernstein,1994 ch2)
• item timeframes: whether a retrospective or prospective scale is indicated; if retro-spective: decide on length of recall time [usually -1 wk for acute conditions, & 2-4 wks for more chronic conditions; (DeVellis,1991 p74)
• whether to use a classical constant-stimulii or contemporary continuously/progressively-tailored stimulii (e.g. continuously/progressively-tailored for education level, ethnicity) via a Computer Adaptive Test [CAT]) survey format; (Nunnally,1994 p428)
• if there appear to be any hypothesized factors (subscales consisting of related items); • how to handle missing values (pairwise or listwise deletions; or data imputation); • aesthetic format e.g.“white space” & ease on eyes (Aday,1996 ch12)
6
Ensure #gr.8 reading level (adjusted for education level of target pop’n). (DeVellis,1991 .58).
Part 1 DEFINE:
• CONSTRUCT(S )/CONCEPT(S) BEING MEASURED • TARGET POPULATION
• INTENDED PURPOSE OF THE TOOL
Assuming a search of the literature does not reveal a suitable existing instrument (Portney &Watkins,2000 p289):
Part 2
ITEM GENERATION
INITIAL ITEM-POOL GENERATION
(Nunnally & Bernstein,1994 ch8; McConnell et al.,1999 ch5)
INITIAL CLINIMETRIC TESTING
( =essentially qualitatively-driven approaches to item reduction)
• Assess Content Validity
Part 3
ITEM REDUCTION
FURTHER CLINIMETRIC TESTING • Reassess for Face & Content Validity
(Nunnally & Bernstein,1994 ch8; McConnell et al.,1999 ch5)
7
Get opinions from content & questionnaire development experts on whether the items measure what they are intended to measure; drop items which they judge do not, are unintentionally redundant, or otherwise make no useful contribution.
8
Pretesting on subjects similar to target respondents (DeVellis,1991 ch5):
• if “brainstorming” is indicated, use focus groups (using trained facilitators and transcrip-tion assessors with good inter-assessor reliability);
• ask individual respondents to note/verbalize their concerns & difficulties; • ensure formatting aesthetics (e.g. “white space” and ease on eyes)
• ensure comprehension & non-ambiguity of items (ask subjects to paraphrase items) • revise ambiguous items
• get opinions on redundancy, relevance, respondent-burden (time & effort required to answer the items/questions)
• get opinions on adequacy of number of response options for the items
• determine acceptability to respondents & those collecting, analyzing & using the data.
9
Drop items which can’t be adequately revised to the level that: • test subjects can paraphrase them back correctly
• test subjects find them acceptable
• they don’t exceed subjects’ ability to answer with useful accuracy.
10
Get expert/clinician/patient opinions & make revisions accordingly (McConnell et al.,1999 ch5).
•Clinimetric development is very subjective, but is geared mainly at clinical practicality; it usually results in a more heterogeneous instrument than psychometric development would produce; it may sometimes be at odds with psychometric testing in that [clinimetrically] it may be desirable to have items which are heterogeneous (& hence, have poor internal consistency), since clinicians may be more interested in parsimony than psychometrically desirable ‘confirmatory redundancy’ (Aday,1996, p203).
•Some authors find that clinimetric & psychometric item-reduction strategies yield similar results & are essentially complementary, implying that they can be used separately or together (Marx et al.,1999) .
11
Get questionnaire-development experts’ opinions on costs, complexity of data collection, acceptability of administration-burden, & interpretability of the scores
(Aday,1996, p203).
FURTHER CLINIMETRIC TESTING
(Portney & Watkins, 2000 p290-299; McConnell et al.,1999 ch5)
• Reassess for Face Validity
• Pretest on a Small Representative Group
ACCEPTABILITY TO RESPONDENTS
FURTHER CLINIMETRIC ITEM REDUCTION vs PSYCHOMETRIC ITEM REDUCTION
12
Response Option Means, Variances:
-According to traditional Likert scaling criteria, all item means should theoretically be close to the median of the possible response-option ranges, & hence fairly normally distributed.
-Also need: high variability (sd $1.0 for 5-response-option scales (Ware et al,1997 p12)), which
requires that a broad spectrum of subjects be used, along with response-options which produce a fairly wide range of scores (DeVellis,1991 p83); without this variability, internal
consistency (item-to-total/item-to-subscale correlations) will be poor, & it can’t be determined if the item can discriminate between different types of respondents.
Response Option Endorsement Frequencies (ROEF):
According to classical methods: the ROEF for each item should preferably be normally distributed; items which >20% of the sample does not answer, or 80% of the sample provides identical responses for, should be eliminated (McConnell,1999 p39).
13
In SSSS, each item is weighted the same, & this is ok when classic scaling assumption criteria are fulfilled (i.e. fairly equal item-mean score; n sd’s; sd ~ 1.0; normally distributed response-option endorsement and subscale score distributions; fairly equal item-to-hypothesized subscale correlations (ITHSC) and ITHSC which exceed the IT non-HSC correlations): but in IRT, items are sometimes designed to capture extreme
cases, and will not likely be normally distributed; score summation in this case is therefore not “simple” as in SSSS, & will depend on the pattern of responses. (Nunnally & Bernstein,1994 p209) Rasch Modelling, although the simplest form of IRT, is a complex computer-generated probability model that calculates weights for the items according to [only] 1 parameter e.g. difficulty of the task [as described by the item], resulting in a hierarchal continuum of items starting with the most heavily weighted (most difficult) items, & ending with the least heavily weighted (easiest) items. The respondent’s disability status (for e.g.) is assessed & positioned along this continuum by the model (Nunnally & Bernstein,1994 p393-5; Portney & Watkins, 2000 p304-6). Part 4
PSYCHOMETRIC TESTING & FURTHER ITEM REDUCTION
• is essentially Reliability & Validity testing as a data-driven approach to item reduction in the revised prototype [or a revised already-established questionnaire];
• is also Reliability & Validity testing of an already-established questionnaire potentially being earmarked for use in a target population in which the questionnaire has not yet been tested for its psychometric performance;
• usually requires approximately a minimum of 10 subjects/item.
(Ware et al.,1997 ch2; Nunnally & Bernstein,1994; McConnell et al.,1999 ch5)
DESCRIPTIVE STATISTICS
14
• Good test-retest reliability = stable scores across 2 points in time during which there was in fact no change, and no learning effects.
• Acceptable test-retest reliability for group-level comparisons: [ICC, k] > .75 (Norman & Streiner,1991p90; Fleiss,1986 p7; Aday,1996 p53); & for individual-level comparisons: [ICC, k] > .90 (Aday,1996 p53)
• If there very few items (“few” vs “several” items being a matter of investigator judgement), then recall bias may result in an artificially high test-retest reliability coefficient, in which case, it may be best to separate the retest from the initial test by several days (assuming no change will occur during this interim); if there are several items & contacting respondents later for a retest is not feasible, and/or change can be expected to occur very soon, the investigators can administer 2 different versions (different orders of items and/or response options) in immediate succession.
Note:
• ICC = Intraclass Correlation Coefficient (test of agreement for ordinal, ratio & interval data)
-if a one-way random effects ICC is used then the ICC is intended to be generalizable to a target population resembling the respondent sample;
-if a fixed effects ICC is used, then no inferences beyond the sample can be made.(Vogt,1999, p233-4; Fleiss,1986 p18). • k = kappa coefficient of concordance (test of agreement for binary-nominal & ordinal data)
-if the data are binary, then the regular kappa using standard quadratic weights is generally used;
-if the data are ordinal, then the weighted kappa (kw) is used, which factors in partial agreements (which is why kw is often >k) .
15
Internal Consistency occurs when items designed to measure the same construct correlate strongly with one another (Spector,1992 p6); it’s thus also part of Construct Validity.
• a is a function of the # items & the average within-scale inter-item correlation (i.e. homogeneity) ( Nunnally & Bernstein,1994 p262; Ware et al,1997 p22); acannot be assessed for single
item scales (e.g. a ‘global assessment’ scale); in a 2-item scale, the homogeneity would have to be at least ICC = .5 in order to yield a= .70 (Ware et al,1997) .
• Good reliability = a >.7 for scales designed to measure group-level comparisons, &
a>.9 across individual patient-level comparisons, esp. for individual diagnoses & assessments resulting in important clinical decisions. (Ware,1997 p23; Nunnally,1994 p265; Spector,1992 p32; DeVellis,1991 p86; Aday,1996 p57)
• If ais too low, there are too few items or the items are not all measuring the same construct, in which case: test for factors/subscales (aka latent variables), and/or drop items which, when removed, have the least negative and most positive effect on a. If ais too high (a>.95) there may be item redundancy, in which case: shorten the questionnaire i.e. drop items which, when removed, have the least effect on a.
• Split-sample replication is recommended to see if a can be replicated; if done on a small sample, can use uneven split. (DeVellis,1991 p89; Ware,1997 p20)
• Kuder-Richardson Formula 20 = a-equivalent for binary data; is also a function of homogeneity (k) & number of items (Nunnally,1994, p251).
INTERNAL STRUCTURE
This section describes how the questionnaire’s internal structural properties and performance are assessed by methods which do not compare the ques-tionnaire against other “external” quesques-tionnaires/instruments/subscales.
•Item-level & Scale-level RELIABILITY -Classical Approach
INTERNAL CONSISTENCY
• Cronbach’s alpha (a)
16
GS = produces the Generalizability Coefficient to quantify the degree of reliability across different levels of a facet (e.g. administration mode, timing, raters); conceptually, it can be thought of as a “factorial ICC”.
17
• if any ITCs are poor, there may be subscales/factors/latent variables; for ordinal response options (often referred to as “ordinal rating scales”) the Spearman’s Rho (rSpearman) should theoretically be used to perform the ITC, but often the Pearson’s Rho
(rPearson) is used instead, with comparable results (Norman & Streiner,1991, p29).
• if no subscales were hypothesized, drop inconsistent items or do exploratory factor analysis to isolate factors (subscales);
• if subscales were hypothesized, see if hypothesized item-subscale correlations [ISCs] $.4 (Ware et al,1997; Lerner et al,1999); if so, this provides some preliminary validation evidence for
these subscales (factors); if the ISCs were “fair” but not very strong, then it may be prudent for the investigators to perform a confirmatory factor analysis.
• acceptable ITC / ISC= |rPearson or rSpearman|$ .3 (Ware et al,1997 p24), but this really depends
on the circumstances, since for e.g., the larger the domain of a construct, the more items are required to operationalize it, & the more items there are, the less realistic it is to expect that any one given item account for $ 9% of the construct’s variability (i.e. r2$ 9%); (Nunnally,1994 p89,99; Spector,1992 p50) ;
• if the subscale has acceptable all-around Item-level Construct Validity, then its items should demonstrating good Convergent Validity, such that these rP or S also exceed the
Divergent Validity correlation coefficients of rP or S .
• all item weights within a subscale can = 1 (i.e. equal weights) if all item-to-subscale correlations are .4 # r # .7 (Ware et al,1997 p15).
18
EITCis a modification of ITC (Nunnally & Bernstein,1994 p329-332) .
= ITCs across the whole range of possible [sub]scale scores, the latter which are stratified into ‘low’, ‘med.’, & ‘high’ categories; these categories are then examined to see if items relevant to the full range of the construct are included in the respondent sample (McConnell et al,1999 p38) i.e. EITC selects items in a subscale which discriminate
between respondents throughout [for e.g.] ‘low’, ‘med.’, & ‘high’ categories of scores
(Marx et al.,1999 p106); EITC is used when an item has a low item-to-subscale correlation,
possibly due to a severely non-normal, narrow response option distribution ---which may be desirable for some items in a [sub]scale, in order to capture the extremes [& hence full range] of the concept/construct spectrum i.e. capture Content Validity.
19
An item demonstrating appropriate DV will correlate poorly with theoretically unrelated subscales/constructs (0 $|rp |$ .4) (Ware et al,1997 p13).
•Item-level & Scale-level CONSTRUCT VALIDITY
(an on-going process, since it can never be fully “proven”)
•Convergent Validity [CV]
ITEM-TO-TOTAL/SUBSCALE CORRELATION (ITC/ ISC)
•Item-level & Scale-level RELIABILITY -Contemporary Approach
GENERALIZABILITY STUDY [GS]
EQUIDISCRIMINATORY ITEM-TO-TOTAL CORRELATION (EITC)
•Divergent Validity [DV] ITEM-TO-NON-HYPOTHESIZEDSUBSCALE CORRELATION
The flowchart is also not intended to be a pocket-sized
checklist, with all explanatory notes relegated to the main
body of the article’s text; rather, the flowchart is meant to
be a self-contained, stand-alone reference tool, that could
theoretically be removed from the rest of the article and
used “as is”. This of course means that it will of necessity
20
• similar idea to testing for Convergent & Divergent Validity, but more complex; • part of response option scale development & validation (Spector,1992 p53)];
• The above is performed if (a)Internal Consistency of a scale is poor (i.e. a <.7), and/or (b)different dimensions/subscales/factors are hypothesized, but not yet isolated; therefore FA is performed in order to: (1)isolate any factors (latent variables/subscales), (2)reduce the number of items (by dropping items which load poorly onto any of the retained factors, or appear to be redundant);item-to-factor loadings of r $ .7 are considered strong, r = .3 - .6 are considered moderate, whereas items with a factor loading of r < .3 should not be included as part of that particular factor (Aday,1996 p62) .
• need n ~10 respondents/item (DeVellis,1991 p78,106; Nunnally & Bernstein,1994)
21
= complex procedure for testing whether data fit pre-set model(s); (Long,1983; Nunnally & Bernstein 1994)
• also part of response option scale development & validation (Spector,1992 p53)];
• if different dimensions/subscales/factors have been isolated before, this is performed to provide additional evidence for already a priori hypothesized factors.
22
• Good Convergent Validity is indicated by a good association between a question-naire’s [sub]scale or item score, & another similar/related [sub]scale/item score derived from an “external” questionnaire/instrument measuring the same construct.
• Good Divergent Validity is indicated by a weak association between a questionnaire’s [sub]scale or item score, & another theoretically unrelated [sub]scale/item score derived from another “external” questionnaire/instrument measuring a distinctly dissimilar construct.
• Good Concurrent Validity is indicated by good agreement between a questionnaire’s [sub]scale or item score, & another “external” [sub]scale/item score measuring the same construct in the same units of measurement.
• Good Predictive Validity indicates good future agreement or association between the prediction and the actual outcome.
• Good Responsiveness(via Concurrent or Convergent Validity) indicates an accurate detection of change in the [sub]scale/item score when in fact change has occurred.
23
• Drop items demonstrating poor reliability, responsiveness, ability to discriminate, poor association or agreement with a related scale, poor loading onto any factors.
24
• Repeat testing (per steps 14-17, 19-23). If psychometric properties are acceptable, then proceed with next step.
• Make indicated final revisions, including aesthetic format/appearance.
• The questionnaire can now be used on samples derived from the same type of target population which underwent testing.
•Factor Analysis [FA] EXPLORATORY FACTOR ANALYSIS
FURTHER ITEM REDUCTION
Part 5
FINAL REVISION OF PROTOTYPE INTO USEABLE QUESTIONNAIRE
CONFIRMATORY FACTOR ANALYSIS
EXTERNAL STRUCTURE: Item- & Scale-level VALIDITY
This section describes how the questionnaire’s performance is assessed by validation methods which compare the questionnaire against other “external” questionnaires/instruments/subscales.
CONSTRUCT VALIDITY: Convergent & Divergent Validity
CRITERION VALIDITY: Concurrent & Predictive Validity
RESPONSIVENESS
briefest overview providing enough explanation to “jog”
the initiated user’s memory, that the author is aware of.
Clearly, not all survey instruments used in health-care
research and clinical practice have undergone all aspects
of the rigorous development strategy outlined here. Some
prominent authors such as Fowler
17concentrate more
would appear that the steps listed in parts 1–3 and 5 of the
flowchart are essential to the development of any
ques-tionnaire used in scholarly health-care research. At the
very least, the investigators must be able to state that the
questionnaire they used demonstrated acceptable Face
Validity for their study’s purpose. Portney and Watkins
12also concentrate on the qualitative aspects of questionnaire
development, but recommend that investigators should at
least be able to state that the questionnaire they used
dem-onstrated acceptable Face Validity and Test-Retest
Reli-ability for their study’s purpose.
Arguably, self-report survey instruments which aspire
to provide diagnostic data, or evaluative outcome
meas-ures which are important enough to impact on patients’
plans of management, should undergo rigorous
psycho-metric testing as well (as outlined in Part 4 of the
flow-chart); this would provide additional assurance that the
instrument is performing acceptably well in all
quantifi-able aspects of reliability, responsiveness, and validity.
Conclusions
This paper presented a self-contained, fairly
comprehen-sive yet brief, flowchart type of overview of the salient
current literature describing the key chronological steps
involved in developing “pencil and paper,” self-report,
health-related survey instruments – particularly survey
in-struments which endeavor to measure abstract constructs
such as “quality of life,” “disability,” or “productivity.” It
was emphasized that this overview is meant to be a
con-venient “big-picture” visualization-aid, as well as a brief
review and reference-guide for investigators who are
al-ready familiar – or were once familiar! – with most of the
methodological steps and concepts involved.
References
1 Aday LA. Designing and conducting health surveys: A
comprehensive guide. 2nd ed. San Francisco: Jossey-Bass
Publishers, 1996: 53–57,62,203,315.
2 DeVellis RF. Scale development: Theory and applications.
Newbury Park: Sage Publications, 1991: 7–12,58,74–78,
86–89,106.
3 Fleiss JL. The design & analysis of clinical experiments.
New York: John Wiley & Sons, 1986:7,18.
4 Guatt GH, Bombardier C, Tugwell P. Measuring disease
specific quality of life in clinical trials. CMAJ 1986;
134:889–895.
5 Guatt GH, Kirshner B, Jaeschke R. Measuring health
status: What are the necessary measurement properties?
J Clin Epidemiol 1992; 45(12):1341–1345.
6 Hudak PL, Amadio PC, Bombardier C. Development of an
upper extremity outcome measure: the DASH (disabilities
of the arm, shoulder and hand).The Upper Extremity
Collaborative Group (UECG) Am J Ind Med. 1996;
29(6):602–608.
7 Lerner D, Amick BC, Malspeis S, Rogers W.
Conceptualization and development of the Work
Limitations Questionnaire (WLQ). MIT, 1999.
8 Lerner D, Amick BC, Lee JC, Rogers WH, Berndt. The
relationship of WLQ scores to objective work productivity:
A test of the questionnaire’s construct validity and
application as a work productivity cost assessment tool.
MIT, Sloan School of Management, Feb.1999.
[Unpublished].
9 Long JS. Confirmatory factor analysis. Newbury Park:
Sage Publications, 1983.
10 Marx RG, Bombardier C, Hogg-Johnson S, Wright JG.
Clinimetric and psychometric strategies for development
of a health measurement scale. J Clin Epidemiol 1999;
52(2): 105–111.
11 McConnell S,
Beaton DE, Bombardier C. The DASH
(Disabilities of the Arm, Shoulders and Hand) Outcome
Measure User’s Manual. Toronto, Ontario: Institute for
Work & Health, 1999: 38.
12 McDowell I, Newell C. Measuring health: A guide to
rating scales and questionnaires. New York: Oxford
University Press, 1996: 3.
13 Nunnally JC, Bernstein IH. Psychometric Theory, 3rd ed.
New York: McGraw-Hill Inc. 1994: 84–104,211–337,
394–415,428–433,445–477,542–554.
14 Portney LG, Watkins MP. Foundation of clinical research:
applications to practice. 2nd ed. Upper Saddle River:
Prentice-Hall Inc. 2000: 304–308.
15 Spector PE. Summated Rating Scale Construction: An
introduction. Newbury Park: Sage Publications, 1992:
6,14,18–21,31–32,50–53.
16 Streiner DL, Norman GR. Health measurement scales: A
practical guide to their development and use. 2nd ed. New
York: Oxford University Press, 1991: 29,90.
17 Vogt WP. Dictionary of statistics and methodology: A
non-technical guide for the social sciences. 2nd ed.
Newbury Park: Sage Publications,1999: 233–234.
18 Ware JE, Harris WJ, Gandek B, Rogers BW, Reese PR.
MAP-R: Multitrait/Multi-Item Analysis Program-Revised
Version 1.0 [MAP-R] User’s Guide. Boston, MA: Health
Assessment Lab, 1997: 12–15,20–24,28–31.