ANTHROPOGENIC INFLUENCE ON
FLOW AND SEDIMENT REGIME OF A
RIVER BASIN
BALESHWAR SINGH
Department of Civil Engineering Indian Institute of Technology Guwahati
Guwahati – 781039, India
R. K. GOSWAMI
Department of Civil Engineering Indian Institute of Technology Guwahati
Guwahati – 781039, India
ABSTRACT: The Brahmaputra river basin in India is at present undergoing rapid agricultural, industrial and economic development with more than 30 million people living within this part of the major basin. The present study examines impacts of some of the anthropogenic activities that are responsible for the disturbances to the flow and sediment regime as well as to the biogeochemical flux of nutrients through the river. The study also throws light on some aspects of the climatic change of the north-eastern region of India in particular, because of the considerable effect of the monsoon over the flow regime of the river.
Keywords: River basin; anthropogenic activity; flow regime; sediment regime.
1. Introduction
The Brahmaputra river belongs to a family of east flowing rivers of Asia, such as Hwang Ho, Yangtze and Mekong, and shares most of their riverine characteristics. The river embodies an entire range of ecology from the clear mountain headwaters 5,300 m above sea level through the hilly terrains of Arunachal Pradesh and fertile plains of Assam, finally discharging into the Bay of Bengal after a distance of more than 2,900 km. The river with its vast drainage basin area of more than 5,80,000 km2 flows through three countries, namely Tibet, India and Bangladesh. The catchment area in India is around 1,95,000 km2 and it yields about 33% of India’s total water resources.
The world’s river systems, as a major conduit for water, nutrient and organic matter, serves as an important linkage in regional and global-scale biological cycles, and there is mounting evidence that they are experiencing unprecedented change due to growth of human population and associated economic development[Vorosmarty et al. (1998)]. There is growing appreciation of the ways in which developing countries in the Asian region contribute both to global changes by altering biogeochemical pathways and cycles, and are themselves affected by those changes. Asia has been one of the first priority regions in the global change studies for two major reasons: First, the unique Asian monsoon system is of great importance in global hydrological and biogeochemical process of the earth system; Second, the ever-growing human activities, due to rapid economic growth and a large population, constitute the major driving force causing environmental changes such as a rapid increase of anthropogenic emission of greenhouse gases, deforestation and desertification due to the industrialization and irrational use of land and biotic resources [Fu and Wang (1992)]. Over the past few decades, combustion, agriculture and industry in Asia have grown to such a level that mobilization rates of carbon, nitrogen, phosphorus and sulphur (CNPS) are now among the highest in the world and are having significant effects on natural cycles.
million people living in this major river basin. By their very nature, drainage basins afford integration over both space and time as rivers focus the end products of numerous distributed hydrological and biogeochemical processes.
Three major elements of disturbance with consequence to land surface hydrology and constituent biogeochemistry are (i) Climate variability and climate change, (ii) River engineering works, and (iii) Human settlement, redistribution of natural landscapes, and industrial development. The present study is an attempt to give an overview of the influence of these major elements on the drainage basin hydrology and nutrient biogeochemistry of the Brahmaputra river within India.
2. Influence of Climate
The Asian monsoon plays a significant role in the global hydrological and energy cycles and vice versa. In fact, the climate and environment over the Brahmaputra basin to a large extent is controlled by the Asian monsoon. The thermal and dynamic influence of the Tibetan Plateau not only plays a significant role in the evolution and formation of the Asian monsoon circulation, but also affects global change as well [An and Thompson (1998)]. A considerable part of the Tsang-Po Dihang basin (as the river Brahmaputra is known in Tibet and Arunachal Pradesh) lies in this area. The Indian and East Asian summer monsoon currents penetrate into the south-eastern part of this area through the deeply trenched valleys and the upper course of the Brahmaputra, Salween, Mekong and Yangtze rivers, and precipitation over this area decreases rapidly towards the interior of the plateau. The central part of the plateau is extremely dry and arid.
Towards South, across the Himalayan mountain belt, the Brahmaputra basin receives heavy rainfall from the passage of South-West Indian monsoon from June to September of every year. The average normal rainfall in the valley is 2,340 mm/year with a variation from 1,210 mm/year to 4,590 mm/year. Trend analysis of rainfall for the period from 1901 to 1992 by Srivastava et al. (1998) over the Indian subcontinent (Table 1) indicates that the overall rainfall does not show any trend. On sub-divisional (meteorological) basis, only Arunachal Pradesh shows a decreasing trend of annual rainfall while all other north-eastern states show a decreasing trend of seasonal rainfall. However, analysis of annual and seasonal data in a smaller spatial scale, namely at district level in Assam, shows that Nowgaon district has increasing trend of both annual as well as seasonal rainfall but no trend is observed for the rest of the state. As about 80% of flow and 95% of sediment contribution in the Brahmaputra takes place during the monsoon period,the seasonal increase in rainfall is of significance.
Table 1. Trends in annual and seasonal rainfall in north-east India.
Territory Annual Rainfall Seasonal rainfall
Increasing Decreasing Increasing Decreasing
Sub-division (Meteorological)
--- Arunachal Pradesh ---
Assam, Meghalaya, Manipur, Nagaland, Mizoram, Tripura
District Nowgaon Darrang, Golaghat Nowgaon ---
The study of precipitation pattern in the Brahmaputra basin and its possible relationship with large-scale atmosphere-ocean interactions manifest that flooding in the Brahmaputra river is associated with the following phenomena:
1. Break-monsoon situation or when the axis of the seasonal trough shifts to the north from its normal position and lies close to the foothills of the Himalayas.
2. North-westerly to northerly movement of monsoon depressions/storms from the head of Bay of Bengal into the interior of the country.
In addition to these, it has been found that if a westerly monsoon wave, moving across the Nepal-Assam Himalayas, happens to synchronize with any of the above situation, incidence of rain in Assam and neighbourhood areas is exceptionally heavy. These variations are of more than simple interest because in the Brahmaputra river basin such extreme events have held an important and often tragic impact on human society. The 1988 flooding of this river was responsible for 232 deaths and affected 10.47 million people as well as rendering a total damage of 663.84 crores of rupees. Since the most fertile part of the basin having significant agricultural and economic output is below the flood stage of the Brahmaputra river and its tributaries, such variability of climate has important impacts on the economy of the nation. Figure 1 shows the average decadal flood-affected area of the river Brahmaputra and its tributaries from 1956 to 1995. An increase in the flood affected area is observed in the recent decades. In the light of this climatic variability, current uncertainty about the future climate change and green house effect is increasing.
Fig. 1.Average decadal flood-affected area of the river Brahmaputra and its tributaries.
3. Influence of River Engineering Works
River control continues in earnest in the flood plains of the Brahmaputra river and is an important focal point for ongoing developmental efforts. These activities provide an example of the interrelationship between human activity and drainage basin hydrology. Starting from the first five year Annual Plan of India in 1951-52, altogether 4,450 km length of embankment, 850 km of drainage channel and 85 numbers of sluices were constructed in the flood-prone area. In addition, 653 numbers of town protection works in the form of spurs, revetments and porcupine fields were taken up as short-term measures for protection against flood and erosion of the river Brahmaputra and its tributaries. Most flood control schemes continue to deteriorate due to insufficient maintenance. After the severe floods of 2004, the state government is according high priority to rehabilitating and upgrading existing embankments that protect critical urban and rural centers with high growth potential.
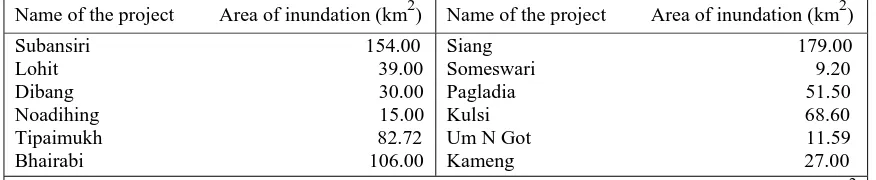
These river engineering works are certain to amplify the apparent variability of river discharge, flood plain and in-channel sedimentation processes. The effect of these structures on the fluvial process and environmental change as a whole is least studied so far. If the increased magnitude and frequency of bankfull discharges in recent years are any indications, it is of great geomorphic significance in the formation of floods. Dam building as a long-term flood and erosion protection measure as well as for economic and agricultural development has also already made its mark and it is certain to play a significant role in the light of the enormous water resource potential of the region. Table 2 presents anticipated areas of likely inundation from major water projects in the region. However, the aggregate global effect of such large impoundments will be difficult to assess.
Table 2. Anticipated area of inundation by major water resources projects in north-east India.
Name of the project Area of inundation (km2) Name of the project Area of inundation (km2) Subansiri 154.00
Lohit 39.00 Dibang 30.00 Noadihing 15.00 Tipaimukh 82.72 Bhairabi 106.00
Siang 179.00 Someswari 9.20 Pagladia 51.50 Kulsi 68.60 Um N Got 11.59 Kameng 27.00
Total area of inundation = 773.51 km2 0
0.2 0.4 0.6 0.8 1 1.2
1956-65 1966-75 1976-85 1986-95
Decades
Area in mha
4. Influence of Anthropogenic Activities
Natural ecosystems process and release biogeochemical constituents based on the interactions among soils, resident vegetation, underlying lithology, and history of weathering. These undisturbed terrestrial ecosystems can be considered relatively “closed”, and they cycle water, carbon and nutrients through conservative pathways that are self-organising and self-sustaining. When disturbed, these cycles become relatively “open” and materials are translocated in large quantities from the land into aquatic ecosystems. Unfortunately, human activities like forestry and cultivation within a ecosystem have caused widespread disturbances and it has been estimated that only a minority of the world’s drainage basins (approximately 20%) have nearly pristine water quality [Meybeck (1982)]. The impact of the anthropogenic changes accumulates across the drainage basin and cascades downstream through large rivers. The accelerated biogeochemical fluxes reflect the collective impact of anthropogenic activities that transform a watershed.
4.1. River discharge and sediment flux
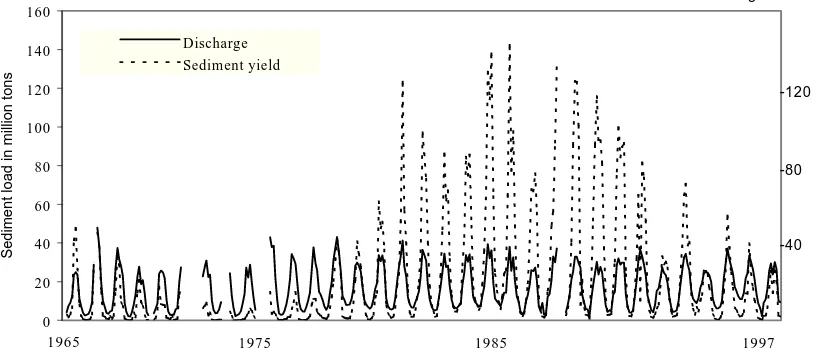
Human management of landscape within the Brahmaputra basin is presently implicated as a major factor controlling the regional runoff, discharge regime, erosion and transport of sediment. The river is ranked fourth among the largest rivers of the world with an average annual discharge of about 19,830 m3/sec [Goswami (1998)]. In terms of sediment transport, it is second only to the Yellow river (Hwang Ho) with a sediment transport per unit drainage area of 1,128 metric tons per km2. The inter-annual variations of flow and sediment discharge of the river at Pandu for the period between 1965 and 1997 is presented in Fig. 2.
Fig. 2. Inter-annual variation of the flow and sediment load of the river Brahmaputra.
From 1975 onwards till 1990 for a period of around 15 years, the sediment yield from the basin shows a sharp increase from 41.534 ton/year in 1975 to 529.607 ton/year in 1990 with a maximum of 621.197 in the year 1984. The acceleration of this erosion and transport of sediment is closely associated with the land use and land cover change in the basin area. Table 3 summarizes the substantial increase in sediment yield attributable to landscape changes due to human activity in numerous settings around the world [Douglas (1990)]. The Brahmaputra river basin for the period from 1975 to 1990 experienced a 12-fold increase in the sediment yield.
Deforestation and increased pressure on land due to explosion of population is a major cause of this apparent increase in sediment yield. The total forest cover of the Brahmaputra basin in India is about 1,14,992 km2. In Bhutan, the coverage is about 27,650 km2, whereas in India, Arunachal Pradesh accounts for about 60% of the forest cover followed by Nagaland, Meghalaya, Sikkim, West Bengal and Assam. Considerable decline of forest cover was observed in Assam during the period from 1976-77 to 1984-85. As a result, the state lost about 7,922 km2 (from 28,608 to 20,686 km2) of forest at a rate of about 990.25 km2 per year during that period [Government of Assam (1997)]. However, a comparison of the forest cover for the period from 1995 to 1997 shows that the rate declined to 118.6 km2/year (from 24,061 to 23,824 km2) and correspondingly the rate of sediment yield also is observed to have reduced. The picture on the regional basis is also not encouraging.
0 20 40 60 80 100 120 140 160
Sediment load in million tons
Discharge
Sediment yield
1965 1975 1985 1997
During the period of 1991 to 1993, a loss of forest cover of about 783 km2 was reported by the Forest Survey of India. During 1995 to 1997, 332 km2 of forest was lost because of deforestation [MoEF (1997)].
Table 3. Observed increases in sediment erosion due to various human activities.
Setting Magnitude of increase Setting Magnitude of increase
Cultivation in forest land
Java 2 times Trinidad 9 Ivory Coast 18 Tanzania 5 Forest clearance
Cameron Highlands, Malayasia 5 South Island, New Zealand Up to 100
Erosion of forest roads
Idaho 200-500 times Urbanization of rainforest
Malayasia 20
In large rivers, generally 3.5
In small rivers, generally 8
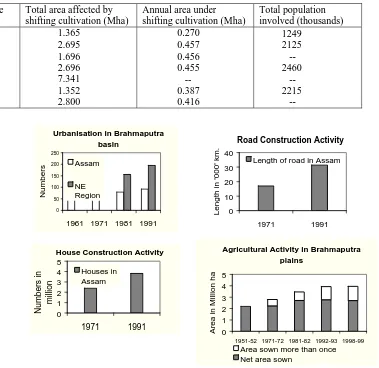
Shifting cultivation is practiced widely in north-east India, an estimate of which is shown in Table 4[Kaul (1994)]. Both the total as well as the annual area affected by shifting cultivation increased during the period form 1956 to 1984. The annual area increased by 41.8% (from 0.273 Mha to 0.378 Mha), while the total area affected rose from 1.365 Mha to 1.908 Mha during the same period. On the agricultural front, the net area under agriculture in Assam (which constitutes 74% of the total agricultural area of the north-east) increased only by 24% during the period 1975-76 to 1998-99 in spite of a burgeoning population growth in Assam by 56.57% from 1971 to 1991 (Fig. 3). This is because of land constraint and the fact that the area under multiple crops shows a much higher increase rate, 115% from 576 Mha to 1140 Mha during the period 1975-76 to 1998-99 reflecting the tremendous pressure on land to sustain a massive population.
Table 4. Extent of shifting cultivation in north-east India.
Year-wise estimates
Total area affected by shifting cultivation (Mha)
Annual area under shifting cultivation (Mha)
Total population involved (thousands) 1956 1971 1975 1976 1977 1983 1984 1.365 2.695 1.696 2.696 7.341 1.352 2.800 0.270 0.457 0.456 0.455 -- 0.387 0.416 1249 2125 -- 2460 -- 2215 --
Fig. 3. Human perturbations on the change of land cover within the basin area.
House Construction Activity
0 1 2 3 4 5 1971 1991 Numbers in million Houses in Assam
Agricultural Activity in Brahmaputra plains 0 1 2 3 4 5
1951-52 1971-72 1981-82 1992-93 1998-99
Area in Million ha
Area sown more than once
Net area sown
Road Construction Activity
0 10 20 30 40 1971 1991
Length in '000' km.
Length of road in Assam
Urbanisation in Brahmaputra basin 0 50 100 150 200 250
1961 1971 1981 1991
Numbers
Assam
4.2. Biogeochemical fluxes
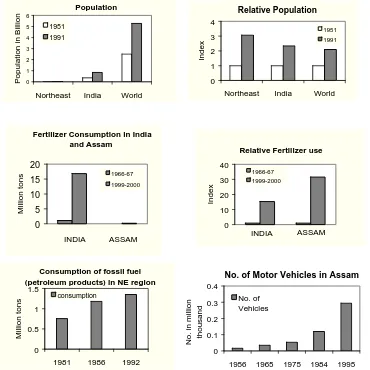
The Brahmaputra river basin has witnessed numerous anthropogenic activities such as deforestation, conversion of natural systems to agriculture, wetland destruction, increased application of industrial fertilizer, population, and atmospheric deposition etc. These activities have a collective impact on the biogeochemical flux of the streams and the rivers of the basin. Fig. 4 shows the recent exploitation of key strategic resources and some quantitative aspects of population trend within the basin area.
Fig. 4. Recent changes in some of the strategic resources in the basin area of the Brahmaputra river
The population density in the basin in India is very high, averaging more than 143 persons/km2 rivaling the densities recorded for highly developed western Europe. In the alluvium portion of the basin in Assam, the rural and urban population densities are 257 persons/km2 and 303 persons/km2 respectively.In terms of fertilizer use, although the region contributes a small portion to the national pool, the relative use shows an increasing trend. In the absence of available data of the basin, the all India figure of the anthropogenic emission is shown in Table 5 [Mehra & Damodaran (1994)]. Energy consumption and so the anthropogenic emission in India as well as in north-east region will continue to rise in the coming years because of the rapid population growth, increased urbanization, greater transport needs, industrial development, and improved standard of living.
Imprints of these emissions have already started reflecting on the biogeochemical flux from the basin. The flux of particulate organic carbon (POC) through the Brahmaputra river in a downstream location at Pandu has been computed as 6.24x10⁶ton/year which is estimated to be 3.5% of the global POC load. Particulate nitrogen (PN) in the Brahmaputra varies from 0.21 to 0.38% (Avg. 0.25%) in pre-monsoon season, and from 0.08 to 0.11% (avg. 0.10%) in monsoon season with an increasing trend along downstream during pre-monsoon. The total phosphorus in suspended sediment particles varies between a minimum of 1025g/g and a maximum of 1290 g/g (monsoon) and 945-1160 g/g (pre-monsoon) with an annual transport of the order of 8.4x10⁴
Population
0 1 2 3 4 5 6
Northeast India World
Population in Billion
1951
1991
Relative Population
0 1 2 3 4
Northeast India World
Index
1951
1991
No. of Motor Vehicles in Assam
0 0.1 0.2 0.3 0.4
1956 1965 1975 1984 1995
N
o
. in million thousand
No. of Vehicles
Relative Fertilizer use
0 10 20 30 40
Index
1966-67
1999-2000
INDIA ASSAM Fertilizer Consumption in India
and Assam
0 5 10 15 20
Million tons
1966-67
1999-2000
INDIA ASSAM
Consumption of fossil fuel (petroleum products) in NE region
0 0.5 1 1.5
1981 1986 1992
Million tons
ton/year which is greater than the dissolved phosphorus load. Although historical data for the Brahmaputra basin is not available for comparison, all the current figures for C, N and P are comparable to recent concentrations in other major rivers with pronounced human interference. It suggests that present C, N and P concentrations may already reflect anthropogenic contributions.
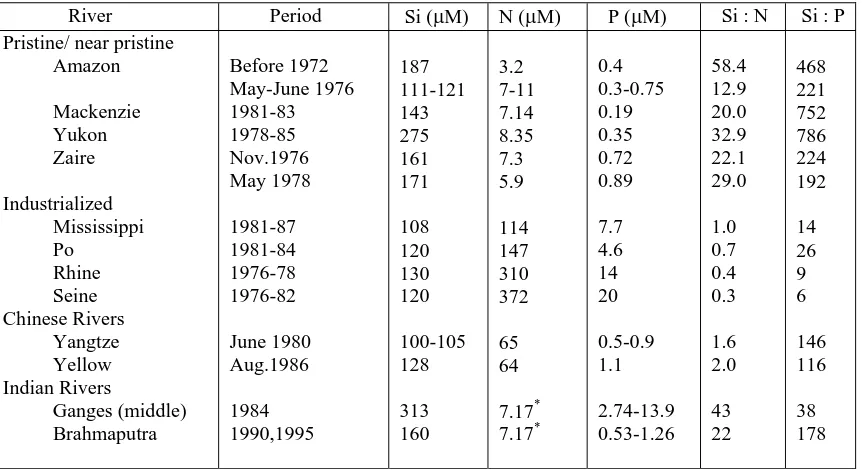
Table 6 compares concentrations and stoichiometric ratios of inorganic nutrients observed in several large rivers of the world with that observed in the river Brahmaputra [Vorosmarty et al. (1998)]. Relative to rivers without significant anthropogenic influence (e.g. Amazon, Yukon ), concentration of inorganic N and P in highly populated drainage basins (e.g. Po, Rhine ) show large increases. The Brahmaputra river, at present although does not show such increases, the deviation form its pristine/near pristine nature is noticeable, particularly for inorganic phosphorus concentration. The nutrient ratios, necessary for primary production, also indicate intermediate position for the Brahmaputra river in the spectrum from pristine to highly eutrophied drainage systems.
Table 5. Summary of anthropogenic emissions from India (1989-90) in tons.
Activities CO2 CO CH4 N2O
Energy Industry
Agriculture and forestry
614.36 23.00 553.45 --- 23.00 35.22 0.493 2.350 12.860 0.052 --- 0.030
Total 1190.81 35.22 15.600 0.082
Table 6. Ambient concentrations and stoichiometric ratios for several key nutrients in pristine, rapidly developing, and industrialized basins.
River Period Si (M) N (M) P (M) Si : N Si : P Pristine/ near pristine
Amazon Mackenzie Yukon Zaire Industrialized Mississippi Po Rhine Seine Chinese Rivers Yangtze Yellow Indian Rivers Ganges (middle) Brahmaputra Before 1972 May-June 1976 1981-83 1978-85 Nov.1976 May 1978 1981-87 1981-84 1976-78 1976-82 June 1980 Aug.1986 1984 1990,1995 187 111-121 143 275 161 171 108 120 130 120 100-105 128 313 160 3.2 7-11 7.14 8.35 7.3 5.9 114 147 310 372 65 64 7.17* 7.17* 0.4 0.3-0.75 0.19 0.35 0.72 0.89 7.7 4.6 14 20 0.5-0.9 1.1 2.74-13.9 0.53-1.26 58.4 12.9 20.0 32.9 22.1 29.0 1.0 0.7 0.4 0.3 1.6 2.0 43 22 468 221 752 786 224 192 14 26 9 6 146 116 38 178
*Calculated from values for basins in pristine/near pristine environment as measured data not available.
5. Conclusions
References
[1] An, Z. S. and Thompson, L. G. (1998): Paleoclimatic change of monsoonal China linked to global change. In J. N. Galloway & J. M. Melillo(eds.) Asian Change in the Context of Global Climatic Change, Cambridge University Press, pp. 18-41.
[2] Douglas, I. (1990): Sediment transfer and siltation. In B. L. Turner et al. (eds) TheEarth as Transformed by Human Action, Cambridge University Press, pp. 215-234.
[3] Fu, C. B. and Wang, Q. (1992): On the abrupt change in South Asian summer monsoon climate and its synchronism with the global rapid warming. Science in China, Series B, 35, pp. 859-869.
[4] Goswami, D. C. (1998): Fluvial regime and flood hydrology of the Brahmaputra river, Assam, Memoir Geological Society of India, 41, pp. 53-75.
[5] Kaul, O. N. (1994): Forest biomass burning in India. The Climate Change Agenda: An Indian Perspective, Tata Energy Research Institute, pp. 65-89.
[6] Mehra, M. and Damodaran, M. (1998): Anthropogenic emissions of greenhouse gases in India (1989-1990), The Climate Change
Agenda: An Indian Perspective, Tata Energy Research Institute, pp. 9-32.
[7] Meybeck, M. (1982): Carbon, nitrogen and phosphorous transport by world rivers. American Journal of Science, 282, pp. 401- 450. [8] MoEF (1997): The state of forest report. Forest Survey of India, Ministry of Environment and Forests.
[9] Srivastava, H. N., Sinha Ray, K. C., Dikshit, S. K. and Mukhopadhyay, R. K. (1998): Trends in rainfall and radiation over India. Vayu
Mandal - Bulletin of the Indian Meteorological Society, Vol. 28, No 1-2, pp. 41-45.
[10] Government of Assam (1997): Statistical handbook. Directorate of Economics and Statistics, Guwahati,