NUMERICAL EVALUATION,
OPTIMIZATION AND
MATHEMATICAL VALIDATION OF
COLD SPRAYING OF
HYDROXYAPATITE USING TAGUCHI
APPROACH
RAVINDER PAL SINGH*
Department of Mechanical Engineering, Chitkara University, Rajpura, Punjab-140401, India
Abstract:
Cold spraying has been effectively investigated for spraying of various metals, alloys and composites. Coating of ceramics like Hydroxyapatite (HAP) using thermal spraying has been investigated extensively, but there is a dearth of research related with HAP deposition using cold spraying. Many investigations have discussed the influential cold spraying parameters, but none has reported the relative percentage contribution of each of them. This paper examined the numerically investigated percentage contribution of five important factors of cold spraying viz. gas type, gas inlet pressure, gas inlet temperature, particle size and particle temperature on nozzle exit particle velocity from convergent-divergent (CD) nozzle. Simulated particle was given the properties of HAP powder. Optimum combination of levels and expected optimum exit particle velocity was analyzed through confirmation test and highest velocity was then mathematically validated and plotted using gas dynamic principles. Critical particle velocity for HAP deposition was also reported. Hence this research investigation throws light on the relative importance of cold spraying parameters using HAP powder and thus provides more insight into the behavior of HAP particle velocity for its successful deposition using cold spraying.
Keywords: FLUENT, CFD, Cold spraying, Taguchi, Optimization, Particle Velocity
1. Introduction
Cold spraying is a new emerging spray technology [1] in which coating is formed through the plastic deformation of spray particles that are in a completely solid state during impact [2,3]. The temperature of spray particles prior to impact is much lower than the melting point of the spray materials [2,4]. Therefore spray materials experience little microstructure change, oxidation or decomposition [5]. Most metals and their alloys can be deposited by cold spraying [1,5]. Even cermets [6] can be deposited and ceramic particles [7] can be embedded in to the metal substrate to form a thin layer coating [7].
Particle velocity can be calculated and can be measured directly. Both techniques are non-trivial and require complex calculations and equipments [20]. Li and Li [12] made use of commercial CFD code to optimize nozzle geometry for maximum particle velocity. Pardhasaradhi et al. [24] compared the laser illuminated, time of flight velocity measurements with the empirical model given by Alkhimov et al. [25]. Jodoin et al. [26] utilized Reynolds average Navier Stokes equations within a computational platform to model flow with boundary conditions and documented the effects of gas type and stagnation conditions. Samareh et al. [27] used computational fluid mechanics to describe the effect of particle concentration on gas velocity for two nozzle geometries.
Although the velocity of particles can be experimentally measured using laser two-focus velocimeters [18] or other laser aided diagnostic method [26]. It is not an efficient and cost effective approach to undertake a systematic investigation [14]. The progress in the computational fluid dynamics (CFD) has made it possible to simulate gas- solid two phase flow precisely [12,14]. Several reports have shown the feasibility to use CFD approach to obtain reasonable results [18,26 as cited in 14]. Therefore CFD approach has become popular to estimate particle velocity at certain conditions [18, 26 as cited in 14]. FLUENT software package has been proven to be reliable for modeling the gas flow in a Laval nozzle through experimental validation [28]. Many research investigations have used FLUENT commercial software [11,12,14,30] and reported practically validated results. Gambit is Fluent’s geometry creation and meshing that brings together most of Fluent’s preprocessing technologies in one environment [30].
As modeling and measurement rarely agree so well in all applications that anyone would just accept its results unquestionably. Because there are inevitable differences between model and experiment, it is always requisite to know if these differences are due to limitations or errors in the numerical solutions, or the physical sub-models or both. Many research investigations have used mathematical models to review the behavior of various metallic element particles subjected to cold spraying under different conditions [1,3,12,20,21,31] followed by comparison with CFD outcomes. The governing equations for gas flow include the physical laws of conservations of mass, momentum and energy. Models describing the dynamic behavior of in-flight particles during the two-phase flow have been well documented in the FLUENT manual [32] and research papers [3,10,33].
Hydroxyapatite (HAP) has been an extensively accepted bio-ceramic used for implant applications in orthopedics, maxillofacial surgery and dental implants [34]. Among HAP coating techniques, plasma and HVOF spraying is by far the most widely adopted process [35,36]. Due to high temperature; poor cohesion and adhesion strength and particularly large amount of phase transformations were reported [37,38]. In addition, conversion of HAP into other calcium phosphate phases i.e. α- or-β tricalcium phosphate, tetra calcium phosphates or calcium oxide and the crystallinity of HAP was also reported to be lowered [39,40]. These disadvantages can be overcome with an aid of new thermal spray process, known as cold spraying (CS). CS uses high velocity rather than high temperature to produce coatings and thereby avoid/minimize main deleterious high temperature reactions [41]. To the best of our knowledge, report of successful fabrication of HAP coating by cold spraying technology is not available in open literature; hence needs attention for research. Before practical examination, detailed analysis can be carried out using mathematical and numerical simulations to study probable behavior and final results.
Taguchi method is a powerful tool for the design of high quality systems and processes. It provides simple, efficient and systematic approach to optimize designs for performances, quality and cost [42]. Taguchi Method is an efficient method for designing process that operated consistently and optimally over a variety of conditions [43]. To determine the best design, it requires the use of a strategically designed experiment [44]. Taguchi approach to design of experiment is easy to adopt and applicable for users with limited knowledge of statistics, hence gained wide popularity in the engineering and scientific community [45]. Therefore important influential factors and levels of cold spraying were chosen after extensive review of literature for HAP particle velocity analysis using Taguchi approach in the present study.
The present investigation is arranged as follows: 1) Selection of factors, levels and orthogonal array, 2) FLUENT modeling, numerical simulations and analysis of nozzle exit particle velocity, 3) Calculation of average, standard deviation, ANOVA analysis, plotting of main factors, their optimum combinations and expected optimum particle velocity 4) Confirmation test 5) Mathematical validation of optimum conditions and comparison with CFD results 6) Reporting of results and probable reasons for deviation.
2. Methodology
2.1.Selection of Factors, Levels and Orthogonal Array
mentioned in table 1. L-16 orthogonal array (OA) was selected and possible combinations of factors and levels are shown in table 2.
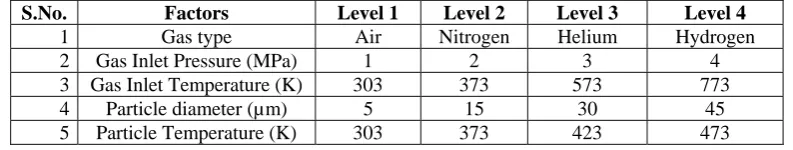
Table 1: Factors and Levels
S.No. Factors Level 1 Level 2 Level 3 Level 4
1 Gas type Air Nitrogen Helium Hydrogen
2 Gas Inlet Pressure (MPa) 1 2 3 4
3 Gas Inlet Temperature (K) 303 373 573 773
4 Particle diameter (µm) 5 15 30 45
5 Particle Temperature (K) 303 373 423 473
Table 2: L-16 Orthogonal Array with Nozzle Exit Particle Velocity
Table 2 presents the trial conditions for each experiment; the results (Particle velocity) were noted using numerical simulations and are shown in the last column of the same table 2.
2.2.FLUENT Modeling and Numerical Simulations
Gambit 2.3.16 package was used to model the 2D axis symmetric convergent-divergent (CD) nozzle. Modeling, mesh generation, mesh quality, boundary conditions and allocation of fluid were done in Gambit environment. Fig. 1 shows a schematic diagram of axis-symmetric nozzle used in the CFD model. Computational domain was meshed using regular and structured quadrilateral elements as shown in Fig. 2. Meshed model was comprised of 5890 quadrilateral cells and 6191 nodes.
Fig. 1. Schematic Diagram of Nozzle with dimensions Trial Gas
type
Gas Inlet Pressure (MPa)
Gas Inlet Temperature
(K)
Particle diameter
(µm)
Particle Temperature
(K)
Exit Particle Velocity Results (m/s)
1 1 1 1 1 1 323.281
2 1 2 2 2 2 252.84
3 1 3 3 3 3 318.568
4 1 4 4 4 4 386.95
5 2 1 2 3 4 275.668
6 2 2 1 4 3 203.341
7 2 3 4 1 2 484.387
8 2 4 3 2 1 418.523
9 3 1 3 4 2 355.665
10 3 2 4 3 1 540.769
11 3 3 1 2 4 644.703
12 3 4 2 1 3 910.401
13 4 1 4 2 3 643.124
14 4 2 3 1 4 1076.53
15 4 3 2 4 1 518.873
Fig. 2. Quad meshed nozzle geometry
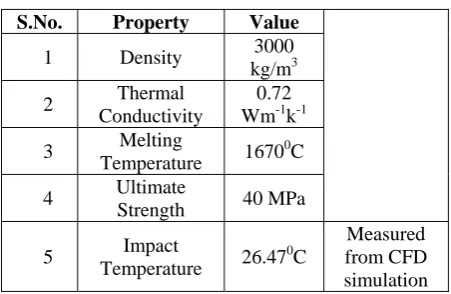
Numerical simulation was carried out by using the commercial software FLUENT to determine the flow field of the driving gas inside and outside the nozzle and subsequently heating and accelerating of particles in the cold spray. For the precise determination of particle velocity and its behavior after nozzle exit, the domain was extended to a cylinder of 50 mm in radius and 50 mm in length outside the nozzle exit. Properties of HAP powder [47] used for simulation are enumerated in table 3.
Table 3: Properties of HAP Powder
S.No. Property Value
1 Density 3000
kg/m3
2 Thermal
Conductivity
0.72 Wm-1k-1
3 Melting
Temperature 1670
0
C
4 Ultimate
Strength 40 MPa
5 Impact
Temperature 26.47
0
C
Measured from CFD simulation
The governing equations for gas flow include the physical laws of conservation of mass, momentum and energy. The realizable k-ε turbulence model was adopted under gravity. The gas was taken as an ideal one. A coupled implicit method was used to solve the flow field and results for the flow field in a steady state were obtained. The governing equations were solved with the second order, upwind scheme. The accelerating and heating of particles were computed using the discrete phase modeling (DPM) of FLUENT. The interaction of particles with the gas flow was considered. Effect of substrate was excluded.
The trial conditions of an orthogonal array were given as input in FLUENT numerical simulation experiments and nozzle exit particle velocity (quality characteristic) was noted as shown in table 2.
2.3.Taguchi Methodology
Qualitek-4 software was used for complete analysis of nozzle exit particle velocity. Average, standard deviation, main average effects, analysis of variation (ANOVA), optimum conditions and expected optimum particle velocity was calculated and plotted. Calculated optimum particle velocity was evaluated through confirmation test using FLUENT with same conditions. ‘Bigger is better’ quality characteristic was used and interaction among factors were not considered.
2.4. Mathematical Validation
Ave rage Effe ct of Gas Inle t Pre s s ure
597
492 518
399
0 200 400 600 800
0 1 2 3 4 5
Le ve l
A
v
er
ag
e
E
ff
ect
Average Effect of Gas Type
728
320 345
613
0 200 400 600 800
0 1 2 3 4 5
Level
A
ve
rag
e
E
ff
ect
where A is exit area, A* is throat area, M is exit Mach number, γ is gas adiabatic index. With the exit Mach
number known, an exit gas velocity can be obtained from the Eq. (2) as follows:
(2)
where V is exit gas velocity, M is exit Mach number, γ is gas adiabatic index, R is characteristic gas constant and T is gas temperature.
It is not the gas conditions that determine the adequacy of the cold spray process, but the spray particle velocity. For low values of the spray particle velocity (as compared to the gas velocity), following Eq. (3) can be used:
Vp = V (3)
where V is exit gas velocity, CD is drag coefficient, Ap is particle area, ρ is gas density, x is the distance covered
by the particle inside the nozzle and m is mass of the particle.
Critical particle velocity (Vcrit.) can be calculated using Eq. (4) as follows:
Vcrit. = 667-14ρ+0.08Tm+0.1σu-0.4Ti (4)
where ρ is HAP density in g/cm3, Tm is powder melting temperature in 0C, σu is powder ultimate strength in MPa
and Ti is Impact temperature in 0C.
By using Eq. (1), (2) and (3), exit gas and particle velocity were calculated, plotted and compared with respective CFD gas and particle velocities.
3. Results and Discussion
3.1. Taguchi Analysis
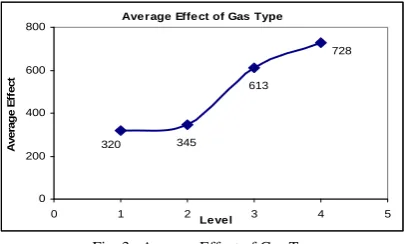
After calculating nozzle exit particle velocity corresponding to each trial of an orthogonal array, average exit particle velocity was calculated as 501.589 m/s and its standard deviation was observed to be 241.908 respectively. Plots of average effects of each factor with respect to levels were drawn and are elucidated in fig. 3-7.
Fig. 3. Average Effect of Gas Type
Ave rage Effe ct of Gas Inle t Te m pe rature
514
461 469
542
400 500 600
0 1 2 Le ve l 3 4 5
A
ver
ag
e E
ff
ect
Ave rage Effe ct of Particle Diam e te r
366 699
490
452
0 200 400 600 800
0 1 2 Le ve l 3 4 5
A
ver
ag
e E
ff
ect
Average Effect of Particle Tem perature
596
450 441
519
0 200 400 600 800
0 1 2 Level 3 4 5
Av
er
a
g
e E
ff
e
c
t
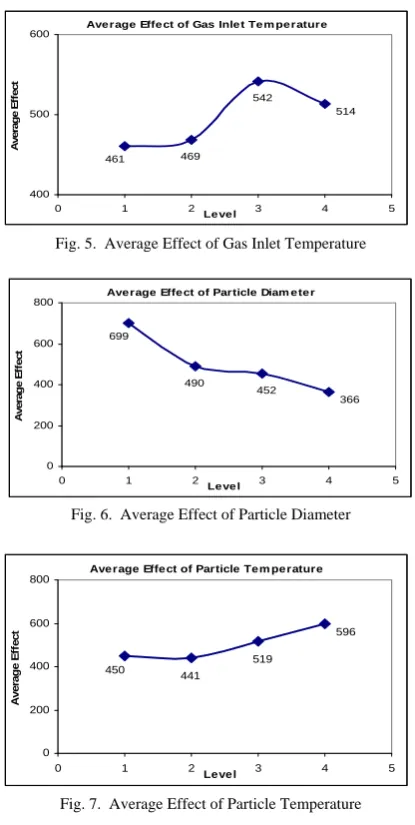
Fig. 5. Average Effect of Gas Inlet Temperature
Fig. 6. Average Effect of Particle Diameter
Fig. 7. Average Effect of Particle Temperature
These plots disseminate the knowledge regarding most influential levels of each factor separately. Level 4 (Hydrogen), level 4 (4 MPa), level 3 (573K), level 1 (5 µm) and level 4 (473 K) were observed to be the most influential levels for each of the factor i.e. gas type, gas inlet pressure, gas inlet temperature, particle diameter and particle temperature respectively. In addition, relative influence among all levels of each factor can also be observed through fig. 3-7.
Analysis of variance (ANOVA) calculations are depicted in table 4 showing degree of freedom (DOF), sum of squares (S), Variance (V), Pure sum (S’) and percentage contribution (P) for each of the factor. This table throws light on relative importance (%age contribution) of each factor on exit particle velocity.
Table 4: ANOVA Table
S.No. Factor DOF S V S’ % P
1 Gas Type 3 482624.8 160874.9 482624.8 54.9
2 Gas Inlet Pressure 3 79617.4 26539.1 79617.4 9.07
3 Gas Inlet Temperature 3 14484.1 4828 14484.1 1.65
4 Particle Diameter 3 239155.3 79718.4 239155.3 27.2
5 Particle Temperature 3 61915.2 20638.4 61915.2 7.05
Percentage contribution of all factors on exit particle velocity of HAP powder in descending order is enumerated as:
Gas Type > Particle Diameter > Gas Inlet Pressure > Particle Temperature > Gas Inlet Temperature
After ANOVA analysis, optimum conditions and expected result at optimum conditions were calculated. Optimum conditions and their levels are mentioned in table 5.
Table 5: Optimum Conditions and Expected Result at Optimum Conditions
Factors Level type Contribution
Gas Type Hydrogen 225.994
Gas Inlet
Pressure (MPa) 4 95.33
Gas Inlet
Temperature (K) 573
40.732
Particle Size (µm) 5 197.06
Particle
Temperature (K) 473 94.373
Total Contribution From all Factors 653.489 Current Grand Average of
Performance 501.589
Expected Result at Optimum
Conditions 1155.078
Expected exit particle velocity at optimum conditions was calculated to be 1155.078 m/s. Confidence level of achieving this expected optimum particle velocity was calculated to be 85% along with confidence interval of ±106.659 m/s. Therefore particle velocity was forecasted to be as small as 1048 m/s and as large as 1261 m/s.
3.2 Confirmation Test
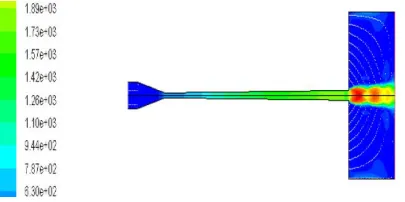
Calculated optimum levels of each of the five factors as shown in table 5 were numerically simulated in FLUENT software using same boundary conditions as mentioned under heading 2.2 to calculate the exit particle velocity. Numerically calculated particle velocity at nozzle exit under optimum conditions was calculated to be 1294.35 m/s. In addition, gas and particle flow fields inside nozzle pertaining to optimum conditions are shown in fig. 8-9.
Fig. 8. Gas Flow Field under Optimum Conditions
Comparison of Gas and Particle Velocity w.r.t Nozzle Length
0 500 1000 1500 2000 2500 3000 3500
0 0.05 0.1 0.15 0.2 0.25 0.3
Nozzle Length (m)
V
e
lo
c
ity
(m
/s
)
Gas Velocity (m/s) Particle Velocity (m/s)
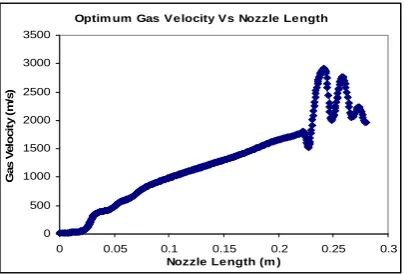
Optimum gas and particle velocity graphs and their comparison with respect to nozzle length are shown in fig. 10-12 respectively.
Fig. 10. Gas Velocity Distribution Vs Nozzle axis
Fig. 11. Particle Velocity Distribution Vs Nozzle axis
Fig. 12. Comparison of Gas & Particle Velocity Distribution Vs Nozzle axis
Gas velocity was found to be more than particle velocity at all cross-sections throughout the nozzle and has been reported by many investigations [20].
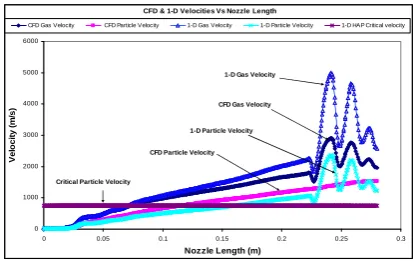
3.3 Mathematical Validation
By using mathematical Eq. (1), (2) and (3), gas and particle velocity was calculated along the axis of nozzle. Fig. 13 compares the gas and particle (CFD) velocities with gas and particle (1-D, mathematical) velocities along the nozzle axis. It was observed that 1-D mathematical results were more than the CFD results i.e. gas and particle velocity which has been reported elsewhere [20]. Graphs also show the nearly same distribution pattern of gas and particle velocity for both CFD and mathematical approaches and hence validated the results.
Optim um Gas Ve locity Vs Nozzle Le ngth
0 500 1000 1500 2000 2500 3000 3500
0 0.05 0.1 0.15 0.2 0.25 0.3
Nozzle Length (m )
G
as V
e
lo
ci
ty
(m
/s)
Optim im um Particle Ve locity Vs Nozzle Le ngth
0 500 1000 1500 2000
0 0.05 0.1 0.15 0.2 0.25 0.3
Fig. 13. Comparison of CFD & 1-D velocity Distribution Vs Nozzle axis
Critical HAP particle velocity was calculated to be 752.012 m/s using Eq. (4) and plotted in figure 12.
4. Conclusion
1) Many investigations only enumerated the influential factors and corresponding levels, but none reported their respective percentage contributions for different quality characteristics. In the present study, various factors and their contributions were analyzed using Taguchi for HAP particle velocity.
2) Hydroxyapatite (HAP) particle velocity was found to be mainly influenced by gas type, particle diameter, gas inlet pressure, particle temperature followed by gas inlet temperature respectively.
3) The similarity in the results of the CFD and 1-D computations was found to be satisfactory. 1-D gas and particle velocities were found to be more than CFD gas and particle velocities respectively. As CFD set of equations include viscous effects, such as boundary layer and frictional effects lead to a slightly lower gas and particle velocity than mathematical velocities.
4) Lowest molecular weight gas (Hydrogen), highest gas inlet pressure (4 MPa) and smallest particle size (5 µm) were found to be among the optimum conditions. Many authors have discussed the lower molecular weight gases, higher gas pressures and smallest particle size responsible for higher particle velocity.
5) 1-D mathematical approach was found to produce nearly same velocity distribution pattern along nozzle axis and validates the results to certain extent.
6) Cold spraying has been well exploited technique for the deposition of various metallic elements, but rarely used for the coating of ceramics due to certain limitations. This research work thus contributes as a reference study for analysis and optimization of various factors affecting deposition of other ceramics/metallic elements using cold spraying.
5. References
[1] C. J., Li, W.Y. and Liao, H. (2006). Examination of the Critical Velocity for Deposition of Particle in Cold Spraying, Journal of Thermal Spray Technology, 15(2), pp. 212-222.
[2] Kosarev, V.F., Klinkov, S.V., Alkhimov, A.P. and Papyrin, A.N. (2002). On Some Aspects of Gas Dynamic of the Cold Spray
Process, Journal of Thermal Spray Technology, 12(2), pp. 265-281.
[3] Dykhuizen, R.C. and Smith, M.F. (1998). Gas Dynamic Principles of Cold Spray, Journal of Thermal Spray Technology, 7(2), pp.
205-212.
[4] Li, W.Y., Liao, H., Wang, H.T., Li, C.J., Zhang, G., and Coddet, C. (2006). Optimal Design of a Convergent Barrel Cold Spray Nozzle by Numerical Method, Applied Surface Science, 253, pp. 708-713.
[5] Alkimov, A.P., Kosarev, V.F. and Papyrin, A.N. (1990). A Method of Cold Gas Dynamic Deposition, Dokl. Akad. Navk SSSR, 318
(5), pp. 1062-1065.
[6] Lima, R.S., Karthikeyan, J., Kay, C.M., Lindamann, J. and Berndt, C.C. (2002). Microstructural Characteristics of Cold-Sprayed Nanostructured WC-CO coatings, Thin Solid Films, 416(1-2), pp. 129-135.
[7] Li, C.J., Yang, G.J., Huang, X.C., Li, W.Y. and Ohmori, A. (2004). Formation of TiO2 Photocatalyst through Cold Spraying, Thermal Spray 2004: Advances in Technology and Application, ASM International, pp. 345-349.
[8] Lupoi, R. and O’Neill, W. (2010). An investigation of Powder Stream in Cold Gas Spray (CGS) Nozzles, V European Conference on Computational Fluid Dynamics (ECCOMAS CFD 2010), Lisbon, Portugal.
[9] Katanoda, H. (2008). Numerical Simulation of Temperature Uniformity within Solid Particles in cold Spray, Journal of Solid
Mechanics and Materials Engineering, 2(1), pp. 58-69.
[10] Raletz, F., Vardelle, M. and Ezo’O, G. (2006). Critical Particle Velocity under Cold Spray Condition, Surface & Coating Technology, 201, pp. 1942-1947.
[11] Tabbara, H., Gu, S., McCartney, D.G., Price, T.S. and Shipway, P.H. (2010). Study on Process Optimization of Cold Gas Spraying, Journal of Thermal Spray Technology, Published online on October 21, 2010.
[12] Li, W.Y. and Li, C.J. (2004). Optimal Design of a Novel Cold Spray Gun Nozzle at a Limited Space, Journal of Thermal Spray
Technology, 14(3), pp. 391-396.
[13] Papyrin, A. (2001). Cold Spray Technology, Advanced Material Process, 159, pp. 49-51.
CFD & 1-D Velocities Vs Nozzle Length
0 1000 2000 3000 4000 5000 6000
0 0.05 0.1 0.15 0.2 0.25 0.3
Nozzle Length (m)
V
e
lo
c
ity
(m
/s
)
CFD Gas Velocity CFD Particle Velocity 1-D Gas Velocity 1-D Particle Velocity 1-D HAP Critical velocity
[14] Li, W.Y., Liao, H., Douchy, G. and Coddet, C. (2006). Optimal Design of a Cold Spray Nozzle by Numerical Analysis of Particle Velocity and Experimental Validation with 316L Stainless Steel Powder, Materials and Design, 28, pp. 2129-2137.
[15] Mulligan, P., Smith, J. and Stokes, J. (2009). Development of a Cold Flow deposition Process for the Application of Coatings using the HVOF Spray Process, The Arabian Journal for Science and Engineering, 34 (1C), pp. 89-99.
[16] Steenkiste, T.H.V., Smith, J.R., Teets, R.E., Moleski, J.J., Goskiewicz, D.W., Tison, R.P., Marantz, D.R., Kowalsky, K.A., Riggs, W.L., Zajchowski, P.H., Pilsner, B., McCune, R.C. and Barnett, K.J. (1999). Kinetic Spray Coatings, Surface Coating Technology, 111 (1), pp. 62-71.
[17] Staltenhoff, T., Voyer, J. and Kreye, H. (2002). Cold Spraying: State of the Art and Applicability, International Thermal Spray Conference, March 4-6, 2002, pp. 366-374.
[18] Gilmore, D.L., Dykhuizen, R.C., Neiser, R.A. Roemer, T.J. and Smith, M.F. (1999). Particle Velocity and Deposition Efficiency in the Cold Spray Process, Journal of Thermal Spray Technology, 8(4), pp. 576-582.
[19] Steenkiste, T.H., Smith, J.R. amd Teets, R.E. (2002). Aluminum Coatings via Kinetic Spray with relatively large powder particles, Surface Coating Technology, 154 (2-3), pp. 237-252.
[20] Champagne, V.K., Helfritch, D.J., Dinavahi, S.P.G. and Leyman, P.F. (2010). Theoretical and Experimental Particle Velocity in Cold Spray, Journal of Thermal Spray Technology, Published online on August 06, 2010.
[21] Li., C.J., and Li, W.Y. (2004). Optimization of Spray Conditions in Cold Spraying based on the numerical analysis of particle velocity, Transactions of Non- Ferrous Materials Society of China, 14 (Special 2), pp. 43-48.
[22] Li, C.J. and Li, W.Y. (2003). Deposition Characteristics of Titanium coating in cold Spraying, Surface and Coating Technology, 167 (2-3), pp. 278-283.
[23] Schmidt, T., Garter, F., Assadi, H. and Kreye, H. (2006). Development of a Generalized Parameter Window for Cold Spray
Deposition, Acta Materialia, 54, pp. 729-742.
[24] Pardhasaradhi, S.P., Venkatachalapathy, V., Joshi, S.V. and Govindanet, S. (2008). Optical Diagnostic study of Gas particle Transport Phenomena in Cold Gas Dynamic Spraying and Comparison with Model Predictions, Journal of Thermal Spray technology, 17 (4), pp. 551-563.
[25] Alkhimov, A.P., Kosarev, V.F. and Klinkov, S.V. (2001). The Features of Cold Spray Nozzle Design, Journal of Thermal Spray
Technology, 10 (2), pp. 375-381.
[26] Jodoin, B., Raletz, F. and Vardelle, M. (2006). Cold Spray Modeling and Validation using an Optical Diagnostic Method, Surface and Coating Technology, 200, pp. 4424-4432.
[27] Samareh, B., Steir, O., Luthen, V. and Dolatabadi, A. (2009). Assessment of CFD Modeling via Flow Visualization in Cold Spray Process, Journal of Thermal Spray Technology, Published online 2009.
[28] Jodoin, B. (2002). Cold Spray Nozzle Mach Number Limitation, Journal of Thermal Spray Technology, 11, pp. 496-507.
[29] Karimi, M., Fartaj, A., Rankin, G., Vanderzwet, D., Birteh, W. and Villafuerte, J. (2006). Numerical Simulation of the Cold Gas Dynamic Spray Process, Journal of Thermal Spray Technology, 15(4), pp. 518-523.
[30] Sanjay, P., Mahesh, N.S. and Kumar, S.K. (2010). Computational and Heat Transfer Analysis of convergent Nozzle used for Gas
Atomization of Liquid Metals, 6(2), pp. 161- 179.
[31] Bray, M., Cockburn, A. and O’Neill, W. (2009). The Laser assisted Cold Spray Process and Deposit Characterization, Surface & Coating Technology, 203, pp. 2851-2857.
[32] Fluent Inc., Fluent 6.3 User’s Guide, NH, 2003.
[33] Grujicic, M., Tong, C., DeRosset, W.S. and Helfritch, D. (2003). Flow Analysis and Nozzle Shape Optimization for the Cold Gas Dynamic Spray Process, 217(B), Available at http://pib.sagepub.com/content/217/11/1603.
[34] Thamaraiseli, T.V. and Rajeswari, S. (2004). Biological Evaluation of Bioceramic Materials-A Review, Trends in Biomaterials and Artificial Organs, 18(1), pp. 9-17.
[35] Sergo, V., Sbaizero, O. and Clarke, D.R. (1997). Mechanical and Chemical Consequences of the Residual Stresses in Plasma Sprayed Hydroxyapatite Coatings, Biomaterials, 18(6), pp. 477-482.
[36] Tong, W., Yang, Z. and Zhang, X. (1998). Patterns of Plasma Sprayed HAP coatings, Biomedical Materials Research, 40, pp. 407-413. [37] Reis, R.L., Monteiro, F.J. (1996). Crystallinity and Structural Changes in HÁ Plasma-Sprayed Coatings Induced by Cyclic Loading,
Journal of Material Science: Materials in Medicine, 7, pp. 407-411.
[38] Knowles, J.C., Gross, K., Berndt, C.C and Bonfield, W. (1996). Structural Changes of Thermally Sprayed Hydroxyapatite Investigated by Rietveld Analysis, Biomaerials, 17(6), pp. 639-645.
[39] Tsui, Y.C., Doyle, C. and Clyne, T.W. (1998). Plasma Sprayed Hydroxyapatite Coatings on Titanium substrates Part I: Mechanical Properties and Residual Stress Levels, Biomaterials, 19(22), pp. 2015-2029.
[40] Stephenson, P.K., Freeman, M.A., Revell, P.A., Germain, J., Tuke, M. and Pirie, C.J. (1991). The effect of Hydroxyapatite Coating on in-growth of bone and cavities in an implant, Journal of Arthroplasty, 6(1), pp. 51-58.
[41] Karthikeyan, J. (2004). Cold Spray Technology: International and USA efforts, Available at www.google.co.in.
[42] Yang, W.H. and tang, Y.S. (1998). Design Optimization of Cutting Parameters for Turning Operations based on Taguchi Method,
Journal of Materials Processing Technology, 84, pp. 122-129.
[43] Thamizhmanii, S., Saparudin, S. and Hasan, S. (2007). Analysis of Surface Roughness by Turning Process using Taguchi Method, 20(1-2), pp. 503-506.
[44] Aslan, E. and Bingoren, N.C.B. (2006). Design of Optimization of Cutting Parameters when turning hardened AISI 4140 steel (63 HRC) with Al2O3 + TiCN mixed Ceramic tool, Materials and Design.
[45] Montgometry, D.C. (1997). Design and Analysis of Experiments, 4th edition, New York: Wiley. [46] Shapiro, A.H. (1953). The Dynamics and Thermodynamics of Compressible Fluid Flow, Ronald Press.