*Corresponding author, E-mail: fakhan_pphy@yahoo.co.in
1Present address: Division of Olericulture, SKUAST-K, Shalimar, Srinagar (J&K) 2Division of PHT, SKUAST-K, Shalimar, Srinagar (J&K)
EFFECT OF NITROGEN AND PHOSPHORUS ON GROWTH, NUTRIENT
CONTENT, SEED YIELD AND QUALITY OF MUSTARD
1S.A. BHAT, 2F.A. KHAN* AND M.I. KHAN
Department of Plant Physiology, College of Agriculture, Indira Gandhi Agricultural University, Ranpur (CG) Received on 25 Jan., 2006, Revised on 25 Sept., 2006
SUMMARY
A pot experiment was conducted to study the effect of three levels of nitrogen and phosphorus combinations, i.e. N60 P30 kg ha-1, N
80 P40 kg ha
-1 and N
100 P50 kg ha
-1 on growth, yield and quality of two
cultivars of mustard (Brassica juncea). The data revealed that cultivar Pusa Bold gave higher plant height, leaf number, leaf area, number primary branches and plant dry weight than Kranti. Application of higher dose of NP fertilizers, i.e. N100 P50 kg ha-1 proved significantly better in improving all these
parameters. Higher fertilizer dose also resulted in a significant increase in number of siliqua plant-1,
length of siliqua and number of seeds siliqua-1, which consequently resulted in a marked increase in
harvest index and seed yield of both the cultivars. N100 P50 kg ha-1 also resulted in an over all increase
in leaf N, P and K contents and seed protein content. Oil content was found to be decreased with increased dose of NP fertilizers, however, extent of decrease in seed oil content was lower than increase in seed yield and thus total edible oil production was still higher with higher fertilizer dose as compared to the normal recommended dose.
Key words: Growth, mustard, nitrogen, phosphorus, quality, yield
INTRODUCTION
The production of oilseeds require more energy than cereals and pulses, but on the contrary they are generally grown on residual soil moisture and poor soil fertility. The most wide spread deficiencies in Indian soils from oilseed production point of view are those of nitrogen and phosphorus, followed by those of sulphur, zinc and potassium (Tandon 1993). Mustard requires a liberal application of nitrogen for sustained productivity on poorly nourished soils (Antil et al. 1986). Phosphorus fertilization also plays an important role in crop growth and energy transformation, which is essential in this oilseed crop. Nitrogen and phosphorus, being important constituents of nucleic acids, proteins and other important
bio-molecules, play a vital role in plant growth and development. Application of fertilizers was found to be effective in improving the plant growth, nutrient uptake and seed quality of various oilseed crops (Deshmukh et al. 1993, Jadhav and Narkhede 1980, Khokhani et al. 1993). However, little information is available with regard to N and P fertilizers in mustard. The present investigation was therefore, carried out to study the effect of different levels of nitrogen and phosphorus on growth, nutrient uptake, yield and quality of mustard.
MATERIALS AND METHODS
the factorial concept of CRD at the Screen House of the Department of Plant Physiology, IGAU, Raipur (CG) during the Rabi season of 2001 and 2002. Healthy and uniform seeds of improved mustard (Brassica juncea) cultivars namely Pusa Bold and Kranti were sown in the pots. Seeds were surface sterilized by captan 75% @ 2 g kg-1 of seed. Two plants in each pot were allowed to
grow. Three combinations of nitrogen and phosphorus, i.e. N60 P40 kg ha-1 (25% below the normal
recommended dose), and N80 P40 kg ha-1 (normal
recommendation) and N100 P50 kg ha-1 (25% above
normal recommended dose) were applied in 18 replications. Full dose of phosphorus and half dose of nitrogen were given as basal dose, whereas, remaining dose of nitrogen was top-dressed at 30 DAS. The plants were watered normally. Observations on plant height, number leaves, leaf area, number of primary branches and dry matter production were recorded at vegetative (30 DAS), flowering (60 DAS), siliqua development (90 DAS) and maturity stages. Plants were also analyzed for number of siliqua, length of siliqua, number of seeds, 1000-seed weight, harvest index and seed yield. The leaf nitrogen, phosphorus and potassium contents were determined at flowering and siliqua development stages by micro Kjeldahl (Yoshida et al. 1972), tri acid (Jackson 1973) and flame photometer respectively. Seed oil content was estimated by Soxhlet’s method (Sankaram 1965) and protein content was estimated by the method of Jackson (1967).
RESULTS AND DISCUSSION
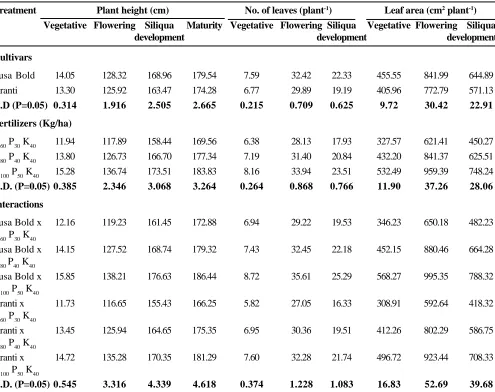
Pusa Bold and Kranti differed significantly in their growth behaviors. Pusa Bold recorded higher plant height, number of leaves and leaf area at all stages of growth than Kranti (Table 1). Higher dose of fertilizer (N100 P50 kg ha-1) resulted in increased whereas lower
dose of fertilizers below normal (N60 P30 kg ha-1)
resulted in decreased plant height, number of leaves and leaf area. Increase in plant height due to higher dose of fertilizer application was 10.7, 7.8, 4.0 and 3.6 per cent while decrease in plant height due to lower dose of fertilizer was 13.4, 6.9, 4.9 and 4.3 per cent, respectively at vegetative, flowering, siliqua development and maturity as compared to the normal dose of fertilizers (N80 P40 kg h-1). Increased number and area of leaves at
vegetative, flowering and siliqua development stages were 13.4, 8.0, and 12.8 per cent and 23.2, 14.0 and 19.6 per cent, respectively. Whereas, an 11.2, 10.4 and 13.9 per cent and 24.0, 26.1 and 28.0 per cent decrease were recorded at corresponding stages due to lowered fertilizer doses. Interaction effect of cultivars and fertilizers were also found significant with all the parameters. Both nitrogen and phosphorus are structural components of bimolecules like proteins, phospholipids nucleic acids, etc. and accelerate the metabolic processes of plants. Being an integral part of ATP, phosphorus also plays an indispensable role in energy metabolism (Marschner 1986). Thus both of these plant nutrients play an important role in increasing the plant height and foliage development by providing the energy and stimulating cell division and elongation (Devlin and Witham 1986). The supply of high concentration of nitrogen increased leaf cell number and size with an overall increase in leaf production. It is also evident from the data that increase in plant height and leaf development were faster from vegetative to flowering stage than other stages which might be due to a more increase in cell elongation than cell division. An accelerated growth during this phase may also be attributed to the application of second dose of nitrogen at 30 DAS. A decrease in green leaf area was noted after flowering stage. The decrease in leaf area from flowering to siliqua development was due to senescene of leaves as a result of diversion of assimilates to reproductive sinks. These findings are in conformity with those of Prasad and Shukla (1991).
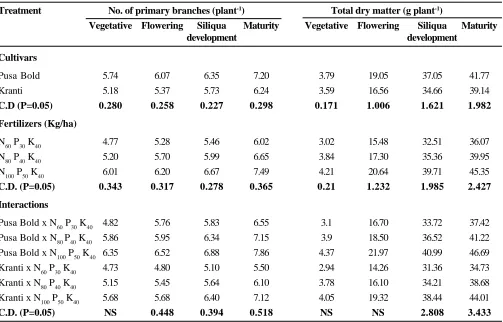
Pusa Bold produced more number of branches and dry matter as compared to Kranti. Higher dose of fertilizers (N100 P50 kg ha-1) increased the branching by
fertilizers has also been reported by Gulzar et al. (1989). The increased amounts of nutrients made available through fertilization and enhanced growth of the plant assimilatory surface could be attributed to more dry matter production. These findings are supported by various studies (Singh and Singh 1984, Rathod et al. 2001).
Data indicated that Pusa Bold had significantly higher nitrogen and potassium contents at siliqua development and flowering stages, respectively, whereas no significant differences were found between the cultivars with respect to phosphorus content (Table 3). Different levels
of fertilizers registered significant differences in nutrient contents at flowering and siliqua development stages, and the maximum nitrogen (3.91 and 2.89 per cent), phosphorus (0.49 and 0.33 per cent) and potassium (3.88 and 2.91 per cent) contents of leaf were recorded with higher dose of N and P fertilizers at flowering and siliqua development stages, respectively. Similarly, application of lower fertilizer dose caused a significant decrease in leaf nutrient contents. In general all the three nutrient levels were relatively higher at flowering than siliqua development stage. The higher content of N and P might be as a consequence of increased supply and uptake of both nutrients. Phosphorus has a favorable effect on root
Table 1. Effect of varying levels of nitrogen and phosphorus on plant height, leaf number and leaf area at different stages in mustard cultivars
Treatment Plant height (cm) No. of leaves (plant-1) Leaf area (cm2 plant-1)
Vegetative Flowering Siliqua Maturity Vegetative Flowering Siliqua Vegetative Flowering Siliqua
development development development
Cultivars
Pusa Bold 14.05 128.32 168.96 179.54 7.59 32.42 22.33 455.55 841.99 644.89 Kranti 13.30 125.92 163.47 174.28 6.77 29.89 19.19 405.96 772.79 571.13
C.D (P=0.05) 0.314 1.916 2.505 2.665 0.215 0.709 0.625 9.72 30.42 22.91
Fertilizers (Kg/ha)
N60 P30 K40 11.94 117.89 158.44 169.56 6.38 28.13 17.93 327.57 621.41 450.27 N80 P40 K40 13.80 126.73 166.70 177.34 7.19 31.40 20.84 432.20 841.37 625.51 N100 P50 K40 15.28 136.74 173.51 183.83 8.16 33.94 23.51 532.49 959.39 748.24
C.D. (P=0.05) 0.385 2.346 3.068 3.264 0.264 0.868 0.766 11.90 37.26 28.06
Interactions
Pusa Bold x 12.16 119.23 161.45 172.88 6.94 29.22 19.53 346.23 650.18 482.23 N60 P30 K40
Pusa Bold x 14.15 127.52 168.74 179.32 7.43 32.45 22.18 452.15 880.46 664.28 N80 P40 K40
Pusa Bold x 15.85 138.21 176.63 186.44 8.72 35.61 25.29 568.27 995.35 788.32 N100 P50 K40
Kranti x 11.73 116.65 155.43 166.25 5.82 27.05 16.33 308.91 592.64 418.32 N60 P30 K40
Kranti x 13.45 125.94 164.65 175.35 6.95 30.36 19.51 412.26 802.29 586.75 N80 P40 K40
Kranti x 14.72 135.28 170.35 181.29 7.60 32.28 21.74 496.72 923.44 708.33 N100 P50 K40
growth, which resulted in better absorption and uptake of other nutrients. Enhancement in rate of metabolic processes with higher dose of N and P may also result in an increased demand and utilization of other plant nutrients, among which K is of prime importance. A synergistic role of K with both N and P has already been established (Mandal et al. 2002).
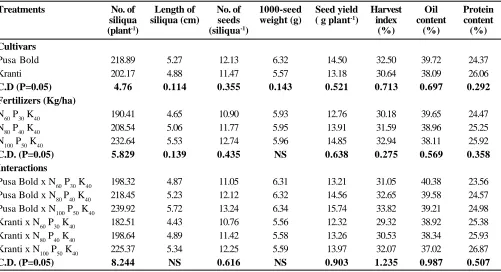
Pusa Bold had higher number and length of siliqua as well as number of seeds as compared to cultivar Kranti. Higher dose of fertilizers increased number of siliqua, length of siliqua and number of seeds per siliqua by 11.5, 9.2 and 8.2 per cent, whereas the lower fertilizer dose decreased them by 8.6, 8.1 and 7.3 per cent, respectively as compared to the recommended dose of fertilizers (Table 4). The data also indicated that cultivar Pusa Bold had higher harvest index (32.50 %) test weight (6.32 g) and seed yield (14.50 g plant-1) as compared to
Kranti having 30.64% harvest index, 5.5.7 g test weight and 13.18 g seed yield plant-1. Higher dose of fertilizer
significantly increased harvest index and seed yield as compared to normal recommended dose. The increased yield per plant due to increased fertilizer dose is the result of improved yield attributing characters like number and length of siliqua and number of seeds per plant. These findings are in conformity with the work of Puri et al. (1999).
Pusa bold had higher contents of oil and protein as compared to Kranti (Table. 4). Decreasing fertilizer dose increased oil content and decreased protein content by 1.77 and 3.2 per cent, respectively. However, higher dose of fertilizers decreased oil and increased seed protein contents by 2.18 and 2.65 per cent, respectively. Interactions of both cultivars and fertilizer doses also affected these parameters significantly. However, in
Table 2. Effect of varying levels of nitrogen and phosphorus on number of primary branches and total dry matter production in mustard cultivars
Treatment No. of primary branches (plant-1) Total dry matter (g plant-1)
Vegetative Flowering Siliqua Maturity Vegetative Flowering Siliqua Maturity
development development
Cultivars
Pusa Bold 5.74 6.07 6.35 7.20 3.79 19.05 37.05 41.77
Kranti 5.18 5.37 5.73 6.24 3.59 16.56 34.66 39.14
C.D (P=0.05) 0.280 0.258 0.227 0.298 0.171 1.006 1.621 1.982
Fertilizers (Kg/ha)
N60 P30 K40 4.77 5.28 5.46 6.02 3.02 15.48 32.51 36.07
N80 P40 K40 5.20 5.70 5.99 6.65 3.84 17.30 35.36 39.95
N100 P50 K40 6.01 6.20 6.67 7.49 4.21 20.64 39.71 45.35
C.D. (P=0.05) 0.343 0.317 0.278 0.365 0.21 1.232 1.985 2.427
Interactions
Pusa Bold x N60 P30 K40 4.82 5.76 5.83 6.55 3.1 16.70 33.72 37.42 Pusa Bold x N80 P40 K40 5.86 5.95 6.34 7.15 3.9 18.50 36.52 41.22 Pusa Bold x N100 P50 K40 6.35 6.52 6.88 7.86 4.37 21.97 40.99 46.69 Kranti x N60 P30 K40 4.73 4.80 5.10 5.50 2.94 14.26 31.36 34.73 Kranti x N80 P40 K40 5.15 5.45 5.64 6.10 3.78 16.10 34.21 38.68 Kranti x N100 P50 K40 5.68 5.68 6.40 7.12 4.05 19.32 38.44 44.01
Table 3. Effect of varying levels of nitrogen and phosphorus on leaf nitrogen, phosphorus and potassium content of mustard
Treatments Leaf nitrogen content (%) Leaf phosphorus content (%) Leaf potossium content (%)
Flowering Siliqua Flowering Siliqua Flowering Siliqua
development development development
Cultivars
Pusa bold 3.66 2.69 0.42 0.28 3.65 2.63
Kranti 3.53 2.53 0.41 0.28 3.53 2.59
CD (P=0.05) NS 0.082 NS NS 0.053 NS
Fertilizers (Kg/ha)
N60 P30 K40 3.23 2.3 0.33 0.22 3.35 2.27
N80 P40 K40 3.65 2.65 0.42 0.28 3.54 2.65
N100 P50 K40 3.91 2.89 0.49 0.33 3.88 2.91
CD (P=0.05) 0.172 0.101 0.069 0.038 0.065 0.072
Interactions
Pusa Bold x N60 P30 K40 3.24 2.41 0.34 0.23 3.42 2.27
Pusa Bold x N80 P40 K40 3.76 2.72 0.43 0.28 3.60 2.68
Pusa Bold x N100 P50 K40 3.98 2.96 0.49 0.33 3.95 2.96
Kranti x N60 P30 K40 3.02 2.20 0.32 0.22 3.29 2.28
Kranti x N80 P40 K40 3.54 2.58 0.42 0.28 3.48 2.62
Kranti x N100 P50 K40 3.85 2.83 0.50 0.34 3.82 2.87
CD (P=0.05) NS NS NS NS NS NS
Table 4. Effect of varying levels of nitrogen and phosphorus on yield and yield attributes in mustard cultivars
Treatments No. of Length of No. of 1000-seed Seed yield Harvest Oil Protein
siliqua siliqua (cm) seeds weight (g) ( g plant-1) index content content
(plant-1) (siliqua-1) (%) (%) (%)
Cultivars
Pusa Bold 218.89 5.27 12.13 6.32 14.50 32.50 39.72 24.37
Kranti 202.17 4.88 11.47 5.57 13.18 30.64 38.09 26.06
C.D (P=0.05) 4.76 0.114 0.355 0.143 0.521 0.713 0.697 0.292
Fertilizers (Kg/ha)
N60 P30 K40 190.41 4.65 10.90 5.93 12.76 30.18 39.65 24.47
N80 P40 K40 208.54 5.06 11.77 5.95 13.91 31.59 38.96 25.25
N100 P50 K40 232.64 5.53 12.74 5.96 14.85 32.94 38.11 25.92
C.D. (P=0.05) 5.829 0.139 0.435 NS 0.638 0.275 0.569 0.358
Interactions
Pusa Bold x N60 P30 K40 198.32 4.87 11.05 6.31 13.21 31.05 40.38 23.56 Pusa Bold x N80 P40 K40 218.45 5.23 12.12 6.32 14.56 32.65 39.58 24.57 Pusa Bold x N100 P50 K40 239.92 5.72 13.24 6.34 15.74 33.82 39.21 24.98 Kranti x N60 P30 K40 182.51 4.43 10.76 5.56 12.32 29.32 38.92 25.38 Kranti x N80 P40 K40 198.64 4.89 11.42 5.58 13.26 30.53 38.34 25.93 Kranti x N100 P50 K40 225.37 5.34 12.25 5.59 13.97 32.07 37.02 26.87
spite of this decrease in per cent oil content, the overall yield of oil obtained was higher under higher dose of N and P fertilizers, due to comparatively more increase in seed yield than decrease in oil content. An increase in seed protein with increased supply of nitrogen was also observed by Dubey and Khan (1996).
The present study therefore indicated that application of N and P fertilizers at a higher dose (N100 P50 kg ha-1, i.e. 25% above normal recommended dose) may
be advantageous in terms of plant growth, seed yield and quality of mustard.
REFERENCES
Antil, R.S., Kumar, V. and Singh, M. (1986). Effect of nitrogen on yield and uptake of nitrogen at different growth stages of raya (Brassica junce L. Czern and Coss).
Indian J. Agron.31: 37-44
Deshmukh, V.N., Atre, A.H., Rangacharya, R.P. and Rewatkar, S.S. (1993). Effect of phosphorus and potassium application on growth, quality and nutrient uptake by groundnut. J. Potassium Res. 9: 72-75.
Develin, R.M. and Witham, F.H. (1986). Plant Physiology (4th
Ed.). CBS Publishers and Distributors. New Delhi.
Dubey, O.P. and Khan, R.A. (1996). Correlation between growth, quality characters and seed yield of mustard.
J. Oilseed Res. 13: 235-238.
Gulzar A., Cheema, N.M., Muhammad, R., Choudhary, G.A. and Khan, M.A. (1989). Response of Brassica species to various fertilizer levels under medium rainfall conditions of Punjab. J. Agric. Res. Lahore. 27: 209-215.
Jackson, M.L. (1967). Soil Chemical Analysis. Prentice Hall of India New Delhi.
Jackson, M.L. (1973). Soil Chemical Analysis. Englewood cliffs, USA, Prentice Hall Inc.
Jadhav, A.S. and Narkhede, B.N. (1980). Influence of nitrogen and phosphate fertilization on growth, yield and quality of groundnut. Madras Agric. J. 67:134-135.
Khokhani, M.G., Ahlawat, R.P.S. and Trivedi, S. J. (1993). Effect of nitrogen and phosphate fertilization on yield and nutrient uptake in sunflower (Helianthus annuus).
Indian J.Agron.38:330-332.
Mandal, K.G., Ghosh, P.K., Wanjari, R.H., Hati, K.M., Bandyopadhyay, K.K. and Misra, A.K. (2002). Practical implications of nutrient x nutrient interaction to boost oilseed productivity in India. Fert. News. 47: 13-26.
Marschner, H. (1986). Mineral Nutrition of Higher Plants. Academic Press Inc. London, UK.
Prasad, S. and Shukla, D.N. (1991). Response of seed and oil yield and some physiological attributes of mustard to different levels and methods of nutrient application. J. Oilseed Res. 8: 20-28.
Puri, G., Jaipurkar, S.A. and Bajpai, R.K. (1999). Influence of soil fertility status and application of primary nutrients (NPK) on chemical composition and oil content of mustard (Brassica Juncea Linn). grown in vertisols. J. Soils Crops. 9 : 164-176
Rathod, D.L., Hatmode, C.N., Deotale, R.D.m Chore, C.N. and Patil, R.R. (2001). Physiological responses of mustard to different levels of fertilizers under irrigated conditions. J. Soils Crops.11 : 146-150.
Sankaram, A. (1965). A Laboratory Manual for Agricultural Chemistry. Asia publications. Mumbai.
Singh, T.P. and Singh, H.P. (1984). Dry matter accumulation and nutrient uptake in Indian rape as affected by plant density and fertilizers. Indian J. Agron. 29: 522-527.
Tandon, H.L.S. (1993). Fertilizer Recommendations for Oilseed Crops. (2nd ed.). Fertlizer Development and Consultation Organization, New Delhi.