Lincoln
University
Digital
Thesis
Copyright
Statement
The
digital
copy
of
this
thesis
is
protected
by
the
Copyright
Act
1994
(New
Zealand).
This
thesis
may
be
consulted
by
you,
provided
you
comply
with
the
provisions
of
the
Act
and
the
following
conditions
of
use:
you
will
use
the
copy
only
for
the
purposes
of
research
or
private
study
you
will
recognise
the
author's
right
to
be
identified
as
the
author
of
the
thesis
and
due
acknowledgement
will
be
made
to
the
author
where
appropriate
you
will
obtain
the
author's
permission
before
publishing
any
material
from
the
thesis.
Impact of the New Zealand Equivalent to the International Financial
Reporting Standard 16 Leases (NZ IFRS 16) on Financial Statements
of Listed Companies
A thesis
submitted in partial fulfilment
of the requirements for the Degree of
Master of Commerce and Management
at
Lincoln University
by
Andrey Ovsyannikov
Lincoln University
i
Impact of the New Zealand Equivalent to the International Financial
Reporting Standard 16 Leases (NZ IFRS 16) on Financial Statements of
Listed Companies
Abstract
In February 2016, the External Reporting Board (XRB) introduced the New Zealand version of IFRS 16
named the New Zealand Equivalent to International Financing Reporting Standard 16 Leases (NZ IFRS
16). Effective 1 January 2019, adoption of this accounting standard is compulsory for Tier 1 and Tier
2 for-profit entities (NZ IFRS 16, par. NZ 2.1).
A review of existing academic and professional publications indicated the impact of capitalization of
operating leases varies significantly depending on country and industry. Therefore, the study’s
problem was linked to the impact of the NZ version of IFRS 16 (NZ IFRS 16) on the financial
statements of the NZX listed firms. NZ IFRS 16 (Leases) requires companies to initially recognise
right-of-use assets at cost and lease liabilities at present value (NZ IFRS 16, par. 22, 23 and 26). This
study capitalizes the operating leases for a sample of 76 New Zealand listed firms using data
obtained from the reported financial statements of these companies for 2017. The accounting
treatment of the off-balance sheet operating leases is largely based on Constructive Capitalization by
Imhoff, Lipe & Wright (1991), with several modifications based on the literature review. The findings
are described by descriptive statistics and are tested with parametric and non-parametric statistical
tools.
Application of NZ IFRS 16 will produce a statistically significant effect on the metrics and ratios
depicting the financial position and financial performance of the sampled firms, except for EBITDA
and Interest cover. In addition, based on quantitative benchmarks of materiality identified by Eilifsen
& Messier (2015), the impact of NZ IFRS 16 is material for the Profit before tax and Total assets
metrics of the sampled listed companies. The study provides specific New Zealand evidence on the
impact of implementation of NZ IFRS 16. The results can be used by stakeholders interested in
information about the lease-related assets and obligations of firms operating in the New Zealand
economy. Some findings about the impact of capitalization of operating leases are useful to
management and/or the decision-makers of New Zealand listed firms.
ii
Acknowledgements
This study is a product of co-operation, communication, encouragement and support of a large group of people working or studying in Lincoln University. Without them this study would not be completed. Firstly, I would like to express my special gratitude to my supervisory team:
Dr Jamal Roudaki
For encouraging and aiding this study to materialize by providing assistance and guidance from day one to the last day before his retirement and, more importantly, for sharing his expertise and experience in research in financial accounting.
Dr Carol Cheong
For joining the team on a short notice, providing assistance, reviewing with scrutiny and facilitating discussion at every stage of the project with numerous improvements suggested and, more importantly, for taking the full burden of main research supervision after Dr Jamal Roudaki’s retirement.
Professor Christopher Gan
For providing academic references to support the application for this study, for helping to shape the concept of this study in the course of ECON 615 program, and, more importantly, for joining the supervisory team on a short notice and for sharing his expertise and experience in empirical research.
In addition, I am grateful to:
Associate Professor Tracy-Anne De Silva
For providing feedback and suggestions at the research proposal presentation workshop.
Dr Anthony Brien
For providing encouragement and academic reference at the stage of applying for a permission to undertake this study.
Dr Eric Scott
For editing this thesis and recommending numerous grammatical and text presentation improvements.
Lastly, I would like to thank the:
Administration staff of the Faculty of Agribusiness and Commerce
For their support and the provision of all the necessary post-graduate information and news;
Student Administration and Support staff of Lincoln University
For assistance in addressing all the formal requirements to undertake this study; and
Library, Teaching and Learning staff of Lincoln University
iii
Contents
Abstract ... i
Acknowledgements ... ii
Contents ... iii
List of Tables ... vi
List of Figures ... ix
List of Abbreviations ... x
List of Formulas ... xi
Chapter 1: Introduction ... 1
1.1. Nature of the study... 1
1.2. History and background of research into accounting for leases ... 2
1.2.1. Statement of Financial Accounting Standards No.13 ... 2
1.2.2. Developments in academic accounting thought ... 3
1.2.3. International Financial Reporting Standard 16 Leases ... 4
1.3. Problem statement, research design and research question ... 6
1.4. Thesis structure ... 7
Chapter 2: Literature Review ... 8
2.1. Introduction ... 8
2.2. The major contributors to knowledge about accounting for leases ... 9
2.3. A summary of the information sources ... 10
2.4. The development of IFRS 16 Leases ... 10
2.4.1. Pre-IFRS - 16 publications ... 11
2.4.2. Post IFRS - 16 academic publications ... 21
2.4.3. Post IFRS - 16 professional publications ... 26
2.5. Observations on financial statements of NZX listed companies for financial years 2016 and 2017 ... 28
iv
3.1. Data selection and data source ... 30
3.2. Sample size ... 30
3.3. Requirements of NZ IFRS 16 ... 33
3.4. Financial metrics and ratios ... 34
3.5. Capitalization method with required modifications... 36
3.5.1. Determination of the discount rate ... 37
3.5.2. Estimation of lease liability via a calculation of future lease payments ... 39
3.5.3. Estimation of unrecorded assets using the ratio of assets to liabilities ... 41
3.6. Methodology ... 42
3.6.1. Correlation, normality and symmetry testing... 43
3.6.2. Parametric testing ... 43
3.6.3. Non-parametric testing ... 44
Chapter 4: Results and Discussion ... 45
4.1. Materiality of the effect of NZ IFRS 16 ... 45
4.2. Descriptive statistics and discussion ... 47
4.2.1. Elements of the balance sheet (financial position) ... 47
4.2.2. Liquidity and long-term solvency ratios. ... 51
4.2.3. Profitability metrics (financial performance) ... 54
4.2.4. Industry analysis and discussion ... 58
4.3. Statistical analysis and discussion. ... 60
4.3.1. Correlation and normality testing: Analysis of symmetry ... 61
4.3.2. Paired sample t-test. ... 63
4.3.3. Signed test ... 64
4.4. Robustness tests ... 64
4.4.1. Log transformation of the data ... 65
4.4.2. Discounting rates – sensitivity analysis ... 67
4.4.3. Ratios of the remaining lease life to total lease life – sensitivity analysis ... 72
v
5.1. Introduction ... 80
5.2. Summary of the results ... 81
5.3. Limitations of the study ... 82
5.4. Practical implications ... 83
5.5. Future research opportunities ... 83
Appendix 1 Discount rate used to capitalize operating leases in previous studies ... 86
Appendix 2 Decision-making to establish the discount rate ... 87
Appendix 3 Illustration of the capitalization method run for Indltex ... 88
Appendix 4 Effect of capitalization of operating leases on the elements of balance sheets of the sampled companies ... 89
Appendix 5 Effect of capitalization of operating leases on balance sheet ratios ... 91
Appendix 6 Impact of capitalization of operating leases on the ratios of profitability ... 93
Appendix 7 A list of individual discount rates used for capitalization of operating lease of the sampled companies ... 95
Appendix 8 A list of individual ratios of the remaining operating lease life (RL) calculated for the sampled companies ... 97
vi
List of Tables
Table 1-1 A summary of pre-IFRS 16 studies on the effects of the capitalization of operating leases
(compiled by the author) ... 4
Table 1-2 Changes in a company's balance sheet (adapted from the IASB, 2016, p. 4) ... 5
Table 1-3 Changes in a company's income statement (adapted from the IASB, 2016, p. 4) ... 5
Table 2-1 The sources of information used in this study (compiled by author) ... 10
Table 2-2 The choice of ratios to assess the effects of capitalization of operating leases (adapted from Durocher, 2008) ... 16
Table 2-3 The choice of ratios to assess the impact of capitalization of operating leases (adapted from Fulbier et al., 2008) ... 17
Table 2-4 The differences in the effect of capitalization of operating leases on positive and negative income subgroups (adapted from Wong & Joshi, 2015, p. 39). ... 21
Table 2-5 The choice of financial metrics and ratios for assessing the impact of capitalization of operating leases (adapted from Xu et al., 2017) ... 22
Table 2-6 The metrics used to assess the impact of IFRS 16 (from Morales-Diaz & Zamora-Ramirez, 2018, p. 121) ... 24
Table 2-7 The costs and benefits of IFRS 16 as discussed by the IASB in the Effects Analysis paper (adapted from the IASB 2016, p. 5) ... 27
Table 2-8 The impact of IFRS 16 on company financial metrics (from the IASB, 2016, pp. 53-54) ... 27
Table 2-9 A list of New Zealand companies reporting a significant/material impact of NZ IFRS 16 on their financial statements (not all inclusive) (compiled by author) ... 29
Table 3-1 The composition of the final sample for the study (compiled by author) ... 32
Table 3-2 The set of elements of financial statements and financial metrics/ratios used in this study (modified from Effects Analysis IFRS 16, IASB, 2016, pp. 53-54) ... 36
Table 3-3 The future minimum lease payments as required by NZ IAS 17, par. 35a (Compiled by author from NZ IAS 17) ... 39
Table 4-1 The quantitative benchmarks and percentages used by the largest US public accounting firms (not all-inclusive) (modified from Elifsen & Messier, 2015, p. 11, p. 13) ... 46
Table 4-2 The impact of NZ IFRS 16 on the quantitative benchmarks of materiality (based on Elifsen & Messier) of the sampled companies ... 46
Table 4-3 The percentage change in the elements of financial statements of the sampled listed companies because of the capitalization of operating leases ... 47
vii Table 4-5 The proportion of total assets to future payments for off-balance sheet leases (modified
from IASB, 2016, p. 16) ... 50
Table 4-6 Changes in the ratios of liquidity and long-term solvency after capitalization of operating leases for a sample of New Zealand listed companies ... 51
Table 4-7 An illustration of the contrast in the impact of capitalization on the current ratios of the sampled companies ... 52
Table 4-8 An illustration of companies in the sample whose leverage/gearing was most and least affected by capitalization of operating leases ... 54
Table 4-9 The descriptive statistics for changes in the financial performance ratios/metrics of the sampled New Zealand listed companies after capitalization of operating leases ... 55
Table 4-10 The descriptive statistics for changes in the financial performance ratios/metrics of the sampled New Zealand companies after capitalization of operating leases ... 56
Table 4-11 The industry classification system used in the study (adapted from Stats NZ, 2018) ... 58
Table 4-12 The variability of the impact of NZ IFRS 16 on the median values of elements of the balance sheet, liquidity and long-term solvency of the sampled listed companies ... 59
Table 4-13 The variability of the impact of NZ IFRS 16 on the median values of the profitability of the sampled New Zealand listed companies ... 60
Table 4-14 The correlation tests, Anderson-Darling normality test results and the characteristics of the distribution of the sampled New Zealand listed firms’ data ... 61
Table 4-15 The results of paired t-tests on the elements of the firms’ balance sheets ... 63
Table 4-16 The results of paired t-test on the sampled listed firms’ ratios of liquidity and long-term solvency ... 63
Table 4-17 The results of paired t-tests on the sampled listed firms’ profit-related metrics ... 64
Table 4-18 The results of paired t-tests on the sampled listed firms’ ratios of return ... 64
Table 4-19 The sign test results for the sampled listed firms’ set of ratios and metrics... 65
Table 4-20 The results of log transformation of the capitalized values of the sampled listed firms ... 66
Table 4-21 The range and characteristics of the individual firm discount rates used in this study ... 67
Table 4-22 The descriptive statistics for the changes in the sampled firms’ financial ratios and metrics resulting from capitalizing operating leases with the discount rate reduced by 200 bps ... 68
Table 4-23 The descriptive statistics for the changes in the sampled listed firms’ financial ratios and metrics resulting from capitalizing operating leases with the discount rate increased by 200bps ... 69
Table 4-24 The changes in median values of the sampled listed firms from capitalizing operating leases by the sensitivity test for the discount rate ... 69
viii Table 4-26 The results of the correlation tests on the sampled listed firms with capitalization
performed with the discount rates increased by 200 bps ... 71
Table 4-27 The statistical tests on the sampled firms with the discount rate decreased by 200 bps . 72
Table 4-28 The statistical tests on the sampled listed firms with the discount rate increased by 200
bps ... 73
Table 4-29 The descriptive statistics for the capitalization of operating leases of the sampled firms
with the ratios of the remaining lease life reduced by 25% ... 74
Table 4-30 The descriptive statistics for the capitalization of operating leases of the sampled listed
firms with the ratios of remaining lease life increased by 25% ... 75
Table 4-31 The changes in the median values from capitalizing the sampled listed firms’operating
leases because of the sensitivity test for the ratio of remaining lease life (RL) ... 75
Table 4-32 The correlation of pre- and post-capitalization values of the sampled listed firms, when
capitalization of operating leases was performed with the individual values of RL reduced by 25% .. 76
Table 4-33 The correlation of pre- and post-capitalization values of the sampled listed firms when
capitalization of operating leases was performed with the individual RL values increased by 25%.... 77
Table 4-34 The results of statistical tests run on the sampled listed firms when capitalization was
performed with the RL decreased by 25% ... 78
Table 4-35 The results of statistical tests run on the sampled listed firms when capitalization was
ix
List of Figures
Figure 1-1 Changes in accounting regulations for leasing arrangements (compiled by the author) ... 1
Figure 1-2 A timeline of the background of research into accounting for operating leases (compiled
by the author) ... 2
Figure 2-1 The organisation of the literature review (compiled by author) ... 8
Figure 2-2 The major contributors to knowledge about accounting for leases (compiled by author) .. 9
Figure 2-3 The timeline for the development of IFRS 16 Leases (adapted from Deloitte, IASPlus) ... 11
Figure 3-1 A repeated measurement design for experimental research (adapted from Roscoe, 1975,
p. 225). ... 44
Figure 4-1 The category classification of the sampled listed companies. ... 59
x
List of Abbreviations
EBIT is earnings before interest and taxation
EBITDA is earnings before interest, taxation, depreciation and amortization
EBITDAR is earnings before interest, taxation, depreciation, amortization and rental expense
EPS is earnings per share
FASB is the Financial Accounting Standards Board
FMLP is future minimum lease payments
D/E is the ratio of debt-to-equity
D/A is the ratio of debt-to-assets
IASB is the International Accounting Standards Board
IFRS 16 is the International Financial Reporting Standard (IFRS) 16 Leases
NZ IAS 17 is the New Zealand Equivalent to International Accounting Standard 17 Leases
NZ IFRS 16 is the New Zealand Equivalent to International Financial Reporting Standard 16 Leases
NZX is the New Zealand Stock Exchange
ROA is return on assets
ROE is return on equity
ROCE is return on capital employed
SFAS No.13 is the Statement of Financial Accounting Standards No.13
xi
List of Formulas
(3.1) Discount rate = Interest expense/Interest-bearing debt
(3.2) FMLPt+1=FMLPt * df
(3.3) FMLP2 to 5=∑4t=1FMLP1 * df t
(3.4) FMLP2 to 5=∑4t=1FMLP1 / (1+df)t
(3.5) PVA/PVL=RL/TL * (PVTL/ PVFLP)
(3.6) PVA/PVL=RL/TL * (PVAFr%, TL/ PVAFr%, RL)
1
Chapter 1:
Introduction
1.1.
Nature of the study
In February 2016, the External Reporting Board (XRB) introduced the New Zealand version of the
new international accounting standard devoted to the regulation of the accounting treatment of
leases. From 1 January, 2019, the New Zealand Equivalent to International Financing Reporting
Standard 16 Leases (NZ IFRS 16) is compulsory for Tier 1 and Tier 2 for-profit entities (NZ IFRS 16,
par. NZ 2.1). The new accounting regulation brings major changes in accounting for operating leases
by lessees, whereas the changes for lessors are seen as insignificant. Given that leasing is often
regarded as a method of financing, the effects of the change provide a consequential interesting
investigation topic.
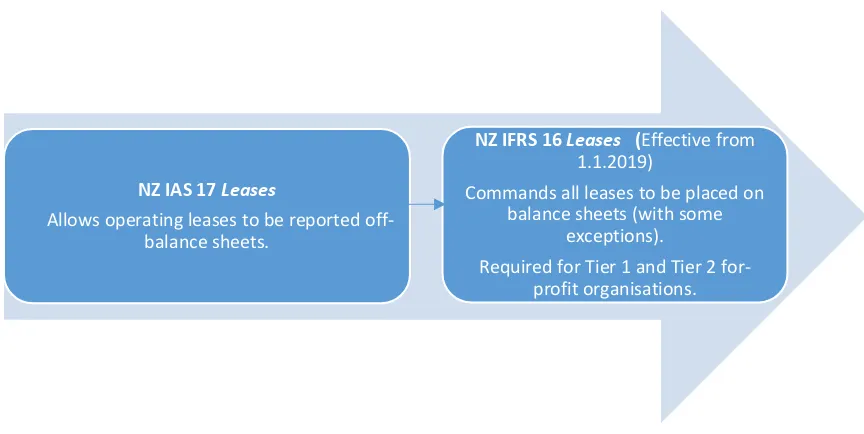
The development in accounting regulations on leases is presented in Figure 1-1.
Figure 1-1 Changes in accounting regulations for leasing arrangements (compiled by the author)
The current accounting standard, NZ IAS 17 Leases, allows lessee companies to keep operating
leases off the balance sheet, reporting them only in the notes to the financial statements. However,
the new NZ IFRS standard requires a different treatment of operating leases. The standard
paragraph 22 demands lessees recognise two elements: right-of-use assets at cost and lease
liabilities at present value (NZ IFRS 16, par. 22, 23, 26). An accounting treatment of existing leases
requires a procedure usually referred to as capitalization of operating leases. Hence, this study
investigates the impact of the capitalization of operating leases, reported in the notes to financial
statements of New Zealand listed companies, under the requirements of NZ IAS 17.
NZ IAS 17 Leases
Allows operating leases to be reported off-balance sheets.
NZ IFRS 16 Leases (Effective from
1.1.2019)
Commands all leases to be placed on balance sheets (with some
exceptions).
2
1.2.
History and background of research into accounting for leases
The historical developments in accounting for leases can be divided into three phases: the birth of
the problem; major developments in the academic pool of knowledge; and actualization of the
problem of accounting for leases. Figure 1-2 illustrates the timeline of the background to research
into accounting for operating leases.
Figure 1-2 A timeline of the background of research into accounting for operating leases (compiled by the author)
1.2.1. Statement of Financial Accounting Standards No.13
The root of the problem relating to the treatment of operating leases can be linked to the SFAS
No.13 released by the FASB in 1976. The document segregated leases into two types: Capital leases
and Operating leases. In addition, the standard allowed different disclosure for each type of lease,
with the possibility for operating leases to stay off-balance sheet (SFAS No.13, 1976).
Such an approach, in the opinion of academics, led to businesses having an incentive to get their
rental arrangements adjusted to meet the criteria of an operating lease. For example, Abdel-khalik
(1981) highlights the following points:
i. firms’ management tries to keep the leases off-the balance sheet; and
ii. financing is arranged so that leases are off-the balance sheet.
In addition, Abdel-khalik (1981) claims there is no evidence to think otherwise. Imhoff & Thomas
(1988) indicate that companies substitute capital leases for operating leases by restructuring the
leasing agreement terms. Imhoff, Lipe & Wright (1991) observe that managers avoid capitalization of
leases to improve performance and leverage indicators. Beattie, Edwards & Goodacre (1998) note
that lease contracts were designed so that the arrangements were classified as operating leases.
Beattie, Goodacre & Thomson (2000) estimate operating leases to be about 13 times larger than
finance leases and report a gap in taking operating leases into account in previous studies about
capital structure and lease-debt substitutability. Goodacre (2003) finds that off-balance sheet
operating leases are a major source of finance in the UK retail sector. Finally, Fulbier, Silva &
Pferdehirt (2008) argue that the separation of leases into finance and operating provides incentives
for firms to choose operating lease contracts over finance lease contracts. The authors claim that
1976 Statement of
Financial Accounting Standards No.13
(the birth of the problem)
1991-2015 Major
developments in academic accounting thought - starts with the
work by Imhoff, Lipe & Wrath (1991)
January 2016
-Actualization of the problem with the IASB
announcing development of IFRS 16
3 such a tactic allows companies to avoid on-balance-sheet debt (Fulbier et al., 2008). Using a sample
of 366 firms from the 2003 S&P 500 index, Duke, Hsieh, & Su (2009) conclude that firms with lease
arrangements classified as operating leases were able to avoid showing lease-related liabilities equal
to 11% of their Total liabilities and lease-related assets equal to 4% of their Total assets. In addition,
the authors argue that by reporting leases as operating, a business can improve its Debt/Equity ratio,
Current ratio and Return on assets (for firms that have their income1 for year 2003 decreased if
operating leases were classified as capital leases).
The significance of SFAS No.13 seems to be in its impact on the consequent accounting regulations.
These include IAS 17 Accounting for Leases announced by the International Accounting Standards
Committee (IASC) in 1982. After a number of modifications by the IASC and the IASB, the current
version of IAS 17 was adopted by New Zealand. Thus, the currently used NZ IAS 17 Leases, released
in November 2012, inherited the issues embedded in SFAS No.13 in 1976.
1.2.2. Developments in academic accounting thought
The shortcomings of SFAS No.13 could be seen serving as a factor that formed the demand for an
accurate financial analysis of the off-balance-sheet assets and liabilities. Imhoff et al. (1991, 1997)
provide a response to this challenge by offering a method of Constructive Capitalization of operating
leases. This method had a direct impact on subsequent research on accounting for leases.
Table 1-1 shows the years, authors and countries of the core research devoted to the problem
before the IASB announced the development of IFRS 16. Table 1-1 illustrates the impact of the
capitalization of operating leases studied in different countries, the authors’ assessment of the effect
of treating off-balance sheet operating leases using different sets of benchmarks and their findings.
These studies and the most recent Post IFRS 16 publications are discussed in detail in Chapter 2.
1 Although in their Sample selection subsection Duke et al. (2009) do not specify what type of income was
meant, their reference to the work of Imhoff et al. (1997) in Methodology, the choice of variables in
Descriptive statistics subsection and their further analysis in the Empirical analysis section allow us to infer that
4 Table 1-1 A summary of pre-IFRS 16 studies on the effects of the capitalization of operating leases
(compiled by the author)
Author(s) Country(ies) Result of capitalization
Imhoff, Lipe & Wright (1991) United States Significant decreases in ROA and D/E
Imhoff, Lipe & Wright (1997) United States Potentially major impact on profitability
Beattie, Edwards & Goodacre
(1998) United Kingdom
The major effect on profit margins, ROA, assets turnover, and gearing indicators.
Bennett & Bradbury (2003) New Zealand Effect on leverage, liquidity, and profitability.
Goodacre (2003) United Kingdom Effect on operating margins, ROA,
assets turnover, and gearing.
Durocher (2008) Canada Major impact on financial position
and financial performance
Fulbier, Silva & Pferdehirt (2008) Spain
Significant impact on financial position, but lesser effect on financial performance
Duke, Hsieh & Su (2009) United States
Increases in D/E, D/A, ROA. Decreases in Interest and rent expense coverage ratio and Current ratio.
Branswijck, Longueville & Everaert (2011)
Belgium & The Netherlands
Major impact on D/E, ROA, Current ratio.
de Villiers & Middelberg (2013) South Africa Significant impact on financial ratios.
Fito, Moya & Orgaz (2013) Spain
Impact on financial position and performance, significant effect on leverage.
Tai (2013) China Effect on ROA and D/E.
Wong, Joshi & Manesh (2015) Australia Major impact on ROA, D/E, D/A. Non-significant impact on ROE.
1.2.3. International Financial Reporting Standard 16 Leases
In January 2016, the problem of accounting for operating leases developed further because the IASB
announced the issue of IFRS 16 Leases. The standard-setting body claimed the objective was the
enhancement of transparency of information about lease obligations (IASB, 2016). This regulation
eliminated the division of leasing into different types and treated all leasing arrangements as finance
leases. Such a transformation in the understanding of leases meant significant changes to accounting
practices and the financial statements of companies. Table 1-2 explains the effects of IFRS 16 on
balance sheets.
The IASB clarified that compliance with IFRS 16 required firms to recognise lease assets and lease
5 classification and movement of assets and leases from the notes to financial statements to the
balance sheets of firms.
Table 1-2 Changes in a company's balance sheet (adapted from the IASB, 2016, p. 4)
Item IAS 17 IFRS 16
Finance leases Operating leases All leases
Assets $$$ --- $$$
Liabilities $$$ --- $$$
Off balance sheet rights
and obligations --- $$$ ---
* The table shows the IASB’s view of the changes to a company’s balance sheet.
Table 1-3 explains the effects of IFRS 16 on income statements.
Table 1-3 Changes in a company's income statement (adapted from the IASB, 2016, p. 4)
IAS 17 IFRS 16
Finance leases Operating leases All leases
Revenue item $$$ $$$ $$$
Operating costs (excluding depreciation
and amortisation) --- Single expense ---
EBITDA*
Depreciation and amortisation Depreciation --- Depreciation
Operating profit
Finance costs Interest --- Interest
Profit before tax
* The table shows the IASB’s view of the changes to a company’s income statement.
To comply with IFRS 16, companies needed to recognise Depreciation of lease assets and Interest on
lease liabilities of operating leases. Hence, the arrows show the movement of outlays from ‘Single
(rental) expense’ under IAS 17 to Depreciation and Interest expenses under IFRS 16.
Although the IASB acknowledged the effect of the new regulation on financial statements, as shown
in Tables 1-2 and 1-3, the standard-setting board concluded that IFRS 16 would bring a more
accurate representation of firms’ assets and liabilities2. In addition, the IASB expected the standard
to result in greater transparency of information about companies’ leverage and capital structure.
Thus, the standard-setter expected the benefits of the change to outweigh the costs (IASB, 2016).
The summary of costs and benefits discussed by the IASB are provided in Section 2.4.3 via Table 2-7.
The impact of IFRS 16 was reviewed in Section 6 Effects on a company’s financial statements of the
Effects Analysis, a paper for IFRS 16 produced by the IASB (see Table 2-8). For example, leverage was
2 The standard-setter makes this conclusion in the subsection named Conclusion – do the benefits outweigh
costs? In this subsection of the Effects Analysis of the standard, the IASB discusses the benefit of a more
6 expected to increase because of the growth in liabilities and a decline in Equity3; current ratio was
expected to decrease because of growth in Current liabilities; asset turnover was expected to
decrease because of the positive change in the amount of Total assets; and, finally, EBIT should grow
because of depreciation being charged instead of a single rental expense (IASB, 2016).
Since the announcement of the new regulations in January 2016, the pool of knowledge has been
enriched by a number of publications by academics and accounting practitioners. However, few
studies involve empirical research and none has a focus on the New Zealand commercial
environment. This study is an attempt to bridge that gap.
1.3.
Problem statement, research design and research question
A review of existing academic and professional publications indicated the impact of capitalization of
operating leases varies significantly depending on geographical location and industry. Therefore, the
problem for this study was linked to the impact of the NZ version of IFRS 16 (NZ IFRS 16) on the
financial position (balance sheet) and financial performance (income statement) of the NZX listed
firms. Adopting the terminology and the financial metrics used by the IASB, the study focusses on
three particular areas: Liquidity, Long-term solvency and Profitability.
The study design includes the:
purpose of the study;
extent of researcher interference;
study setting;
research strategies;
analysis unit; and
the time horizon (Sekaran & Bougie, 2013).
This study involves obtaining the financial statements of the NZX listed companies for the financial
year 2017. To apply the requirements of NZ IFRS 16, this study performs an accounting treatment of
operating leases for the sampled listed firms. This is to establish the cause-and-effect relationships
between the requirements of the new accounting standard and the financial position/performance
of the sampled companies.
3 The forecasted decrease in Equity is explained by the standard-setter as the result of the carrying amount of
7 The research questions are:
i. What is the impact of NZ IFRS 16 on the key financial metrics of lessees, as identified by
International Accounting Standards Board, on NZX listed companies?
ii. Does the effect of NZ IFRS 16 on the financial statements of the NZX listed firms, which use
operating leases, vary within the sample?
This study largely uses the financial metrics/ratios used by the IASB in Subsection 6.5 Effects on key
financial metrics of the Effects Analysis. The list and discussion of the tools used by this study is
provided in Section 3.4 Financial metrics and ratios and in Table 3-2.
1.4.
Thesis structure
This thesis is organised as follows:
Chapter 2 discusses previous studies on the effect of capitalization of operating leases on the
financial position and financial performance of firms.
Chapter 3 presents the research design and methodology used in the study.
Chapter 4 discusses the results of the study.
Chapter 5 summarises the results, discusses the limitations of the study, the practical implications
8
C
Chapter 2:
Literature Review
This chapter systematises and explains the sources and information relating to the problem of
accounting for leases. In addition, the review aims to demonstrate the gap in current knowledge that
represents an opportunity for a contribution to the literature.
2.1.Introduction
Most of the literature review is devoted to the most relevant set of publications starting with the
development of the Constructive Capitalization method by Imhoff et al. (1991; 1997). This decision,
to start the literature review with the 1991 and 1997 publications was made because the Imhoff et
al. studies represent a methodological basis for treating off-balance sheet operating leases. The
subsequent academic research uses the Constructive Capitalization method and presents evidence
of the impact(s) of capitalization of operating leases on the financial position and financial
performance of companies across a number of countries.
The next part of the review largely focusses on academic publications, the standard-setter’s and
practitioners’ contributions after IFRS 16 Leases was announced by the IASB in January 2016. The
final part of the review consists of several observations based on the initial collection and search of
the financial statements of the NZX listed companies. Figure 2-1 shows the major parties that have
contributed to the current pool of knowledge about accounting for leases.
Figure 2-1 The organisation of the literature review (compiled by author)
Academic evidence about the effect of capitalization on financial statements of the firms obtained from a number
of different countries (1991-2015).
The most recent studies devoted to the impact of IFRS 16 from academic
and business accounting sources (years 2016-2018).
Initial observations from the financial statements FY2016-FY2017 of NZX
9
2.2.
The major contributors to knowledge about accounting for leases
Knowledge on accounting for leases can be classified in terms of contributing parties. Figure 2-2
shows the major contributors to the knowledge of accounting for leases.
Figure 2-2 The major contributors to knowledge about accounting for leases (compiled by author)
In the standard-setters group, there are several major standard-setting organisations. First, there is
the FASB, the body that issued SFAS No.13, which directly influences the current regulations on
accounting for leases not only in the US but worldwide. The IASC and its successor, the IASB,
adopted the division of leases into operating and financing as suggested by the FASB. Secondly, the
IASC and the IASB, the regulators that issued and modified the current international accounting
standard, IAS 17, produced the new regulation, IFRS 16, and issued the Effects Analysis paper that
explains the costs and benefits of implementing IFRS 16.
The last major contributor to this group is the XRB that provides the New Zealand-specific version of
the accounting standards. The power of the XRB comes from the Financial Reporting Act (FRA) 2013,
which assured the continuation of the External Reporting Board (XRB) as a Crown entity and
successor to the Accounting Standards Review Board (FRA, 2013, s11). In addition, the XRB has been
given authority to implement a strategy for tiers of financial reporting (FRA 2013, s. 30).
The role of XRB should not be underestimated since it appoints the New Zealand Accounting
Standards Board of the XRB (NZASB) to issue accounting standards based on the standards issued by
international bodies (Financial Reporting Strategy Parameters for the NZASB, 2011. s 21). However,
the XRB can impose additional requirements in the standard, e.g., the applicability to Tier 2 for-profit
organizations. This was a requirement in the initial variant of the New Zealand version of IFRS 16
standard. The board amended the standard in July 2018.
Academics represent the second group of contributors to the pool of knowledge. Durocher (2008)
suggests a classification of academic research devoted to the effect of capitalization of operating
leases into three types of study:
i. bankruptcy prediction studies;
Accounting for leasing arrangements Standard-setters
Academics
10 ii. market-based studies; and
iii. behavioural studies (Durocher, 2008).
However, it seems that this classification does not contain the type of empirical studies that focus on
the direct impact of capitalization of operating leases on the financial position and financial
performance of companies. This study reviews such academic studies and attempts to provide New
Zealand-specific evidence on the impact of bringing off-balance sheet operating leases on to firms’
balance sheets.
The last group of contributors to the field of accounting knowledge on leases are business
practitioners. The Big 4 accounting firms, various other accounting organisations and professional
accounting bodies have provided contributions aimed at understanding and predicting the impact of
IFRS 16. However, only a few of those papers satisfy the requirements of an empirical study4.
2.3.
A summary of the information sources
Information about the problem in this study originates from a number of sources. Table 2-1
summarises the data sources that could be used for a study on accounting for leases.
Table 2-1 The sources of information used in this study (compiled by author)
Source Description
Accounting Standards SFAS No.13, NZIAS 17, IFRS 16, NZIFRS 16, AASB 16
Additional materials/ Effects analysis
Effects Analysis IFRS 16 Leases by the IASB, Additional material for IFRS 16 by the IFRS Foundation.
Textbooks Various research books and accounting for leases books.
Peer-reviewed journals Academic and professional journal articles
Business publications
Research, accounting alerts and guides provided by accounting practitioners, including materials placed on firms’ websites.
Importantly, Table 2-1 indicates the availability of a range of information sources. However, some
information sources, such as the mass media and popular internet channels, are not included
because they do not meet the hallmarks of research and therefore lack credibility.
2.4.
The development of IFRS 16 Leases
An important stimulus for this study devoted to accounting for operational leases was the process
for the development of the new Leases standard by the IASB. Figure 2-3 presents the timeline for the
development of IFRS 16 that influenced the studies devoted to the problem of accounting for leases.
4 For example, purposiveness, rigour, testability, replicability, precision and confidence, objectivity,
11 Figure 2-3 The timeline for the development of IFRS 16 Leases (adapted from Deloitte, IASPlus)
Academic studies of prime interest during this phase of accounting for leases are summarised below.
2.4.1. Pre-IFRS - 16 publications
Imhoff et al. (1991) set a milestone in academic research on accounting for operating leases that
provided a method for capitalizing operating leases reported off the balance sheets of businesses.
The significance of the study came from prior research lacking such methodology. The literature
review shows that all the academic studies we include in this section and in the section below had
used the Constructive Capitalization by Imhoff et al. (1991), though some authors modified it to
make it suitable for their studies5. Imhoff, Lipe & Wright (1993) provide evidence that, compared
with their method of capitalization, heuristics used by analysts tended to overstate unrecorded lease
liabilities. Bennett & Bradbury (2003) and Pardo & Giner (2018) also find that heuristic methods
compare unfavourably with the Constructive Capitalization method of Imhoff et al. (1991); they led
to an overstatement of lease-related assets and liabilities.
According to Imhoff et al. (1991, p. 51), their Constructive Capitalization allows the calculation of
important financial ratios as “if the operating leases had been capitalized at their inception”. Such an
accounting procedure provides a basis for accurate financial analysis via an estimate of the
off-balance sheet assets and liabilities. The demand for an accurate analysis can be explained by the
authors observing a number of businesses that were using more assets than their balance sheets
were reporting and these businesses were more leveraged than their investors/owners might assess
from the Debt-to-Equity ratio (D/E) ratios of such firms. In addition, Imhoff et al. (1991, p. 51) note
the presence of a significant number of entities reporting “very large non-cancellable operating lease
commitments extending many years in the future”. Importantly, their study uses a sample of
companies in seven industries to examine the effects of constructive capitalization of operating
leases on assets, liabilities, ROA, leverage ratios and net income benchmarks (Imhoff et al., 1991).
5 A study by Moralez-Diaz & Zamora-Ramirez (2018) is an exception; these authors suggest their own method
of capitalizing off-balance sheet leases. However, they compare their developments with Constructive
Capitaliation by Imhoff et al. (1991). July 2006 Added to the IASB's agenda 19 March 2009 Discussion Paper DP/2009/1 Leases: Preliminary Views 17 August 2010 Exposure Draft ED/2010/9 Leases published
21 July 2011
12 Imhoff et al. (1991) observe mean decreases in ROA varying from 34% for lessees that had a
significant volume of operating leases relative to Total assets (high lessees) to 10% for lessees that
were using a lesser volume of operating leases relative to Total assets (low lessees). In addition, the
authors note the mean decreases in the D/E from 191% for high volume lessees to 47% for low
volume lessees. The conclusion indicates that users of financial statements ought to capitalize
operating leases if their analysis involves firms that have material leasing arrangements (Imhoff et
al., 1991).
Imhoff, Lipe & Wright (1997) claim their study in 1991 focused largely on the balance sheet effect of
capitalization. Hence, there was a need to discuss the impact of capitalization on income statements
of firms. The 1997 study used the following variables: ROA, ROE, Net income and Operating income.
These metrics were obtained from the financial statements of Southwest Airlines for 1990 to 1994.
In addition, the income effects of Constructive Capitalization reported by the authors has been
further illustrated by application to and comparison of the balance sheet and income statement
effects of capitalizing operating leases. Such a comparison was achieved using the financial results of
several iconic retailers: K-Mart Corporation, Weis Markets Inc. and National Convenience Stores.
Imhoff et al. (1997) find Constructive Capitalization impacts the comparability of the financial results
of the companies. The study reports intercompany differences in ROA of Weis Markets Inc. and
National Convenience Stores decreasing from 69% before capitalization to 29% after capitalization
Imhoff et al. (1997) argue that pre-capitalization of Weis Markets Inc. showed its ROE is 9% higher
than the ROE of National Convenience Stores but, having the operating leases capitalized made the
ROE of Weis Markets Inc. 35% lower than the ROE of National Convenience Stores. The main results
of Imhoff et al.’s (1997) study show that adjustments to operating leases produce a significant effect
on the profitability metrics (ROA and ROE) of firms. However, these changes were seen by the
authors as “unpredictable in their direction” (Imhoff et al., 1997, p. 31).
One of the first seminal academic publications based on the method suggested by Imhoff et al.
(1991; 1997) was by Beattie, Edwards & Goodacre (1998). They use the financial statements of 232
randomly sampled companies listed on the UK stock exchange. The paper assessed the impact of
capitalization of operating leases on the following financial ratios: Profit margin; ROE, ROA, Return
on capital employed (ROCE); Asset turnover, Interest cover and three variants of the Gearing ratio.
The authors note their capitalization method is similar to Constructive Capitalization suggested by
Imhoff et al. (1991). However, the authors argue that Constructive Capitalization was invented and
tested in the US environment. Therefore, the authors ‘developed’ Imhoff et al.’s (1991) method
further to accommodate “company-specific assumptions in respect of the remaining lease, the asset
13 The findings include a number of important conclusions:
operating leases represent a major source of long-term financing;
capitalization of operating leases could result in recording additional long-term liabilities
equal to 39% of reported long-term debt;
capitalization of operating leases represented unrecorded assets of 6% of total assets6; and
capitalization has a significant impact (at the 1% level) on the following factors: Profit
margin, ROA, Asset turnover and gearing indicators (Beattie et al., 1998).
Beattie et al.’s (1988) study used the paired t-test and the Wilcoxon signed rank test to establish the
statistical significance of the findings. In addition, the authors performed sensitivity analysis for the
core assumptions: discount rate and lease lives. Beattie et al. (1998) also performed an industry
analysis to find that the magnitude of the impact of capitalization varied for different industries. The
greatest effect was for the services sector (Beattie et al., 1998).
Bennett & Bradbury (2003) studied a number of effects of capitalization of operating leases using a
sample of financial statements of 38 companies listed on the New Zealand Stock Exchange. The
study uses the Constructive Capitalization method developed by Imhoff et al. (1991) with the aim of
providing non-US evidence on the impact of capitalizing off-balance sheet operating leases. More
importantly, Bennett & Bradbury (2003) compare the use of Constructive Capitalization with the
treatment of operating leases using the ‘rule of thumb’ heuristics methods, noted in the study as
RENT8 and RENT67. One limitation of the study could be the assumption of 0.81 assets to liability
ratio for all the firms in the study sample. The authors report median increases of 11.7% in Total
liabilities, median increases of 5.2% in Total assets and median decreases of 1.6% in Total equity.
Bennett & Bradbury (2003) also discuss increases in the median Debt-to-Assets ratio (D/A) from
0.463 to 0.525, decreases in the median Current ratio from 1.752 to 1.693 and decreases in the
median ROA from 0.117 to 0.109. The authors used the Spearman correlation to validate the
capitalization procedure and performed a sensitivity analysis for the calculated periods of remaining
lease life. Bennett & Bradbury (2003) conclude that capitalization of operating leases produces a
6 Table 6 titled “Estimated mean capitalized value of operating lease assets and liabilities for 1994” presented
by Beattie et al. (1998) in their study allows us to conclude that they meant the percentage representation of total assets for the sample mean.
7 RENT8 was explained by Bennett & Bradbury (2003) as a treatment of operating leases when the current
14 material impact on reported liabilities, which is linked to the effect on leverage8. In addition, they
reveal that capitalization affects the liquidity and profitability ratios of the sampled firms. As
discussed in this section, the comparison of Constructive Capitalization with heuristic methods
allowed the authors to conclude that the heuristic methods tend to overstate lease-related assets
and lease-related liabilities.
Bennett & Bradbury’s (2003) study was preceded by Bennett & Bradbury (1998) that examined the
effect of the adjustment of operating leases on the 1997 financial statements of Air New Zealand.
The study discusses the following changes to the financial position of the company: a 10.5% increase
in Total assets, a 25% increase in Total liabilities and a 4% decrease in Total equity. In addition, in
assessing the impact on the financial performance of Air New Zealand, the authors report that there
was a 17.7% increase in EBIT, an increase in D/A from 49.9% to 56.5%, a decrease in the Current
ratio from 0.878 to 0.763, an increase in ROA from 5.6% to 5.9% and, finally, an increase in ROE from
9% to 9.3% (Bennett & Bradbury, 1998). Thus, the authors find capitalization of operating leases
produces a significant effect on two particular performance ratios: Leverage and Short-term liquidity
(Bennett & Bradbury, 1998). To relax the effect of the assumptions about the discount rate, a
sensitivity analysis using the interest rates for secured loans reported by the company was
performed.
Goodacre (2003) presents a study of operating lease financing in the UK retail sector. The study
provides a number of observations on the significance of operating leases for the industry. The
author finds the volume of off-balance operating leases was 3.3 times higher than on-balance sheet
long-term debt, but the volume of finance leases was non-significant. In addition, Goodacre (2003)
argues the size of operating leased assets equals 28% of the total reported assets.
In the discussion of the impact of the capitalization of operating leases, Goodacre used the set of
nine ratios used by Beattie et al. (1998). In addition, the author adopts the modifications to
Constructive Capitalization by Beattie et al. 1998) as follows: company-specific assumptions of the
total and remaining lives of the operating leases, the proportion of assets/liabilities and an effective
tax rate (Goodacre, 2003). This allowed the author to find that adjustments to off-balance sheet
operating leases produce a considerable effect on balance sheet values. To illustrate, the study finds
that the UK retail industry had an average ratio of long-term operating lease liabilities over
on-balance sheet long-term debt of 1.6 for food retailers and up to 5.1 for general retailers. The study
also finds operating lease liabilities were, on average, about 37 times the size of finance leases
8 The Summary section of the study by Bennett & Bradbury (2003) does not describe the impact on reported
15 (Goodacre, 2003). On the asset side, Goodacre (2003) notes that off-balance sheet assets, based on
mean values, equal 16% of Total assets for food retailers and 37% of Total assets for general
retailers. Finally, the study makes a number of observations on the impact of capitalization on the
performance ratios of the sampled companies. The author reports median increases in operating
margins from 8.1% to 11.5%, decreases in ROA, decreases in Asset turnover and increases in all three
gearing ratios. Goodacre (2003) gives an example of the net Debt-to-Equity metric growing from 17%
to 157%. The study also reports increases in the ROE, ROCE and Interest cover ratios. Goodacre
(2003) used Pearson and Spearman correlation tests to measure the relationship between the pre-
and post-capitalization ratios. In addition, t-tests and the Wilcoxon signed rank test were used to
establish statistical significance. The author concludes that the requirement to capitalize operating
leases can produce a major effect on the operating performance of firms working in the UK retail
sector.
Durocher (2008) provides empirical evidence of the effects of capitalization of operating leases in
Canada. The study was based on a sample of the 100 largest (by revenue) Canadian public
companies and uses a set of ratios aimed at assessing the impact of accounting adjustments within
the three areas presented in Table 2-2. Durocher claims that his method of capitalizing leases
included refinements to the method of Constructive Capitalization. The author also notes that the
studies preceding his work applied Constructive Capitalization using sample-wide assumptions for
the following: the interest rate, length of the remaining lease and total lease lives, proportion of
assets to lease liabilities9 and tax rates (several studies, according to Durocher). Durocher’s study
justifies recording the company-specific tax rates by the fact that studies preceding his work did not
consider the effect of capitalizing of operating leases on future taxes.
Table 2-2 shows the ratios used in Durocher’s (2008) study to assess the effect of capitalization on
financial strength, management performance, and investment return. Durocher claims the major
impact of capitalization on the benchmarks of financial position with Total assets demonstrating a
mean increase of 5.6% and a median increase of 2.6%. In addition, Total liabilities show a mean
increase of 11.5% and a median increase of 5.5% (Durocher, 2008). Referring to the effects on
financial performance, Durocher (2008) observes a 2.66% increase in the D/A ratio; a slight decrease
in the Current ratio from 1.37 to 1.3; a slight increase in ROA from 4.21% to 4.24%; a decrease in ROE
from 10.98% to 10.24% and a decrease in EPS from 1,451.14 to 1,450.69. Durocher’s study provides
9 Under this proportion, Durocher means the ratio of remaining lease life to total lease life. The author
16 an industry analysis based on 12 sectors. Based on the author’s conclusions, adjustment of operating
leases has a major effect on Leverage and Liquidity of the sampled companies across all industries.
Table 2-2 The choice of ratios to assess the effects of capitalization of operating leases (adapted from Durocher, 2008)
Financial strength Management
performance Investment return
Leverage (D/A ratio) ROE Earnings per share (EPS)
Liquidity (Current ratio) ROA
The effect on income statements and, thus, the effect on financial performance was significant for
only a few sectors, including merchandising and lodging, oil and gas and financial services. For the
statistical analysis, Durocher used the Spearman and Pearson rank correlation tests to test the ratio
relationships before and after capitalization. Durocher uses the t-test and Wilcoxon signed rank test
to establish the statistical significance of the findings.
Fulbier, Silva & Pferdehirt (2008) present more evidence on the impact of lease capitalization on
financial ratios. To measure the effect, the authors use a sample of 90 German listed companies.
Fulbier et al. (2008) perform their treatment of off-balance sheet operating leases using a method
based on Constructive Capitalization by Imhoff et al. (1991; 1997). However, the authors report
some modifications to that methodology. They use specific interest10 and tax rates for every sampled
firm, when possible, and separate FMLP into five contract baskets11.
Table 2-3 shows the set of financial ratios used by Fulbier et al. (2008) to measure the effect of
capitalizing operating leases on the following areas: the structure of balance sheet; profitability and
expenses, and firm valuation from the capital perspective. Fulbier et al. (2008) conclude that
modified constructive capitalization of the off-balance sheet operating leases produces a substantial
impact on the financial position of firms. The strength of this effect varies depending on the industry
10 Fulbier et al. (2008) note the lack of availability of data for lease-related interest rates, therefore the authors
use the rates for pensions and/or other provisions as the interest rate required for capitalizing operating leases.
11 The authors explain that the latter modification of dividing the FMLP into five baskets was needed because
the original Constructive Capitalization method of Imhoff et al. (1991) used one asset-to-liability ratio to the whole portfolio of operating leases, whereas Fulbier et al. (2008 p. 60) point out that such an approach ”accepts misspecified asset values and equity impacts”. In addition, the authors identified existing studies that attempted to overcome this issue by calculating the weighted average for the remaining and total lives of operating leases. Fulbier et al. (2008) chose a different approach, the use of five contract baskets with
different lifetimes from “within 1 Year” to “5 Years or more” and perform capitalization for each basket before aggregating the results and adjusting the financial statements. This allows Fulbier et al. (2008) to take into account that operating leases within the portfolio of a firm’s leases, which may expire in different periods. (See
Appendix 3 of this study for an illustration of capitalization performed using the “five contract basket”
17 of the sampled companies. However, the authors see the impact of capitalization on the ratios of
financial performance as minor. The robustness of the study was achieved with the “use of
company-specific discount and tax rates”. In addition, the study’s results were enhanced by
Table 2-3 The choice of ratios to assess the impact of capitalization of operating leases (adapted from Fulbier et al., 2008)
Structural changes in balance sheets Profitability and expense structure Firm valuation from the capital perspective
The intensity of investment (NCA/TA) Profit margin (PM) EPS
Equity-to-Assets (E/A) ROA Price-earnings (P/E)
Debt-to-Equity (D/E) ROCE Book-to-market (B/M)
Capital Employed (CE) ROE
Time interest earned (TIE)
Turnover capital employed (TCE)
sensitivity analysis based on the following assumptions used in the process of capitalizing operating
leases:
the ratio of remaining lease life to total lease life; and
the rates for discounting future operating lease payments.
These assumptions and the consequent sensitivity analysis are used in this study. More importantly,
Fulbier et al. (2008) use the Standard & Poor’s CreditStats factor model as a control model to test
and compare the adjustment of the off balance sheet operating leases with the effect of capitalizing
these operating leases using the Constructive Capitalization method. The authors observe a number
of flaws in the CreditStats factor model, in contrast with the Constructive Capitalization method, e.g.,
it views lease assets equal to lease liabilities. The authors find CreditStats and Constructive
Capitalization produce “only slightly different results” (Fulbier et al., 2018, p. 138). The statistical
significance of the findings in Fulbier et al. (2008) was confirmed using parametric t-tests and
non-parametric Wilcoxon signed rank tests.
Duke et al. (2009) investigated the impact of capitalization of operating leases for a sample of 366
firms from the S&P 500 index in 2003. The authors divided the sample into two subgroups: negative
income and positive income. The criterion for the division was based on the effect of reporting
operating leases as capital leases on income of the sampled firms in 2003. Duke et al. (2009)
acknowledge that their capitalization of operating leases of the sampled firms is based on Imhoff et
al.’s (1991) method. The authors note that preceding studies used company-specific assumptions12
12 Among the exemplified studies were Beattie et al. (1998) and Bennett & Bradbury (2003), which have been
18 for lease lives, discounting rates, proportions of assets to liabilities and tax rate. However, Duke et
al. (2009) chose a different tactic and did their capitalization using uniform assumptions for the
above mentioned variables, except the tax rate13. The study describes the effect of capitalization
using five financial ratios with the results reported using the means for both income groups of the
sample. Duke et al. (2009) find capitalization of operating leases results in a mean increase of 13.4%
and a 12.2% in D/E; in a 5.2% increase and a 3.3% increase in D/A; in a 8.3% decrease and a 3.8%
increase in ROA percentage; 1.21% decrease and a 1.5% increase in Interest and rent expense
coverage ratio; and a 6.4% decrease and 5.2% decrease in Current ratio for the negative and positive
income subgroups, respectively. The statistical significance of their findings was confirmed with
paired t-tests.
Branswijck, Longueville & Everaert (2011) discuss the financial outcome of the capitalization of
operating leases in two different countries: Belgium and The Netherlands. The authors, taking into
account the exposure draft (ED/2010/9) Leases issued by the IASB, focus their study on assessing the
magnitude of the effect of capitalization in relation to factors such as the industry, size and
accounting culture (country) of the firm. To capitalize operating leases, Branswijck et al. (2011) adapt
the Constructive Capitalization method of Imhoff et al. (1991, 1997). The authors modified the stage
of capitalization procedure that involves the estimation of the remaining lease life. This modification
is explained by the constraints on the financial information in the annual statements of Belgian and
Dutch listed firms. One hypothesis tested in the study related to the possibility of the process of
capitalization of operating leases having an effect on financial ratios of a business. This was achieved
using a sample of 128 listed Belgian companies and 116 listed Netherlands companies. The findings
show capitalization of operating leases produces a major impact on the following ratios:
D/E;
ROA; and
Current ratio (Branswijck et al., 2011).
The statistical significance of these results was obtained using a paired sample t-test. In addition,
Branswijck et al. (2011) claim that the industry effect of capitalization varies across the six examined
sectors of the two economies. For the impact on the D/E, ROA, and Current ratio, the authors
13 The authors explain such an approach in their study is because of the lack of data for the remaining lives of
operating leases and ‘the implicit discount rates’ for US firms. In addition, Duke et al. (2009) note that the tactic of using uniform assumptions was used with the purpose of including as many firms as possible in the study sample. Finally, the authors argue that the results from the preceding studies indicate that the