EFFICIENT DEFECT DETECTION
ALGORITHM FOR GRAY LEVEL
DIGITAL IMAGES USING GABOR
WAVELET FILTER AND GAUSSIAN
FILTER
K.N.SIVABALAN
Assistant Professor, Latha Madhavan Engineering College
DR.D.GNANADURAI Principal, J.P.College of Engineering
Abstract: The Automated visual inspection systems are utilized effectively to identify the defects in various digital images in industries. In our research work we have used Gabor filter and Gaussian filter to eliminate the texture elements in the digital image by isolating the defected area. Then a fast searching algorithm which uses feature extraction parameters is deployed to identify the defected pixels and to effectively segment it. The proposed technique is suitable for texture and non texture images. Thus the Algorithm is used to identify the defects in the digital texture image using non texture methods.
Keywords: Gabor Filter,Wavelet,Texture,Gaussian Filter
1. Introduction
research paper consists of the overall plan of the research work. The next division explains the elimination of texture elements using Gabor filter. The subsequent divisions are smoothing high energy points with Gaussian filter, Deployment of Fast Searching Algorithm, Segmentation of defected areas,Gaborfiltermethod,Analysis,conclusion and references.
2.Overall Architecture
After initial preprocessing the gray level image is applied to the Gabor wavelet filter which in turns eliminates the high intensity texture components and it is smoothed.
Fig 1.1 Overall Process of Algorithm
The Gabor filter output is fed as input to Gaussian filter in order to identify the high energy pixels and smoothed. The output will be an image which eliminates all the texture elements. The Searching Algorithm performs spatial operations on each pixel based upon the features extracted from the image. This Algorithm makes a clear distinction between defected and non defected areas. After the deployment of searching algorithm the segmentation operation is performed on the resultant image of searching Algorithm to identify the defects
3.Elimination of texture elements using Gabor filter
The Gabor Kernel function is a complex sinusoid function which acts with specific frequency and with different orientations. The complete Gabor 2D function with non orthogonal basis is mentioned as
) 1 ( ) 2 exp( . 2
1 exp 2
1 )
,
( 2
2 2 2
Wx j y
x y
x y
x
y x
In Eq. (1)
x,
y were Gaussian major and minor widths and W is the radial frequency. The complex Gabor wavelet function has real and imaginary parts. Later the real and imaginary parts are convoluted to form the filtered image. The Gabor wavelet function is applied on the original gray level image as a result the majority of the texture elements will be smoothed. The convoluted image will almost remove the majority of the texture elements and also isolates the defect from the high intensity texture elements. The defect in the image is assumed to be a low intensity region where as the texture components of the image are high intensity regions.Original
Gabor Filter
Gaussian Filter
Searching Algorithm
Segmentation
4.Smoothing High Energy points with Gaussian Filter
The output of the Gabor filter is fed as input to Gaussian filter to identify the high energy points of the image components. The high energy points such as the texture elements will be identified and smoothed with the help of Gaussian filter. The Gaussian filter uses the following equation
G(x, y) = 2
2 2
2 2
2
1
y x
e
(2)The Eq.(2) is applied on the image to identify the high energy points and to smoothen it. The resultant output will be image which consists of only the defected area and minor texture areas where the majority of the texture elements are removed.
5.Deployment of Fast Searching Algorithm
The first process in deploying this algorithm is to extract the features of the resultant image from the Gaussian filter output. The various features such as minimum,maximum,median,mean,standard deviation are calculated from the resultant image.The features are calculated for the whole image.The minimum for image f(x,y) can be calculated as
Minimum=Min (f(x, y)) (3) x=1,2,…M
y=1,2,…N
In Eq. (3) x and y varies
The maximum point can be calculated for the image f(x, y) as
Maximum=Max (f(x, y)) (4) x=1,2,…M
y=1, 2,…N
In Eq. (4) x and y varies
The mean value of image f(x, y) can be calculated as
N
X
M
y
x
f
(
,
)
(5)
x
=1, 2,…M y=1, 2,…NIn Eq. (5) x and y varies to identify the intensity of each pixel The standard deviation of an image f(x,y) can be calculated as
N
X
M
D
X
y
x
f
(
,
)
(6)x
=1,2,…M y= 1,2,…NIn Eq. (6) x and y varies where D is deviation and M is the maximum no of elements in row and N is the maximum no of elements in column.After feature extraction threshold is calculated by the difference between mean and standard deviation and it is given by the equation as follows
Threshold=
(7)X
Y
X
y
x
f
2 2
)
,
(
(8) Where X=f(x,y) and Y=f(x,y+1) x=1,2,….My=1,2,….N
if the intensity value of the pixel f(x,y) is less than the threshold then the intensity value of the pixel f(x,y) is calculated as
X
Y
X
y
x
f
2 2
)
,
(
(9)Where X=f(x,y) and Y=f(x,y+1) x=1,2,….M
y=1,2,….N
The Eq.(8) and (9) performs the appropriate operations on the pixels with respect to conditions set on intensity variations.The algorithm makes a clear distinction between the defected and non defected regions.
6.Segmentation of defected areas
The defected areas are identified from the image which has been processed by the searching algorithm.The first process to identify the defects is to calculate the median of image f(x,y).The median can be calculated as Median(M)=xm|(x1,x2,…xm,xm+1,..xn (10)
Where n is odd
The above equation states xm is the middle value of the intensities of the image when arranged in ascending
order .The above case can be only be applied if the number of pixels in each row is odd.The median value is found for even number of pixels using the following equation
Median(M)=
2
1
mm
x
x
|x1,..,xm,xm+1,..xn
Where n is even (11)
The above mentioned equation states in case the number of pixels in the image is even the middle value xm of
the ascending order wise arranged row and the next value to middle value xm+1 is averaged to find the median
value.The standard deviation is calculated based on Eq.(6).The pixels which are greater than the sum of median,standard deviation is classified as defected region .The Median is represented as M and the resultant image is represented as K.The following equation depicts the resultant image
Otherwise
M
y
x
f
y
x
K
0
)
(
)
,
(
1
)
,
(
(12)Eq.(12) states that M is Median and
is standard deviation7.Results
(a)
(b)
(c)
(d) (e)
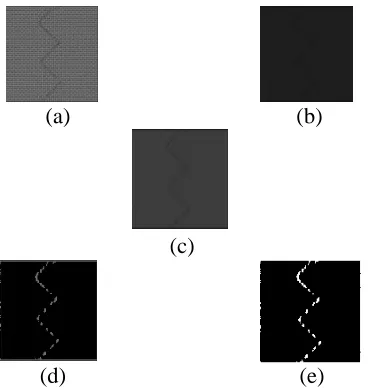
Fig 1 (a)Original image (b)Gabor filter output (c) Gaussian filter output (d) Output of Searching algorithm (e) Segmented output
Fig 1 Shows the cracked wall form Fig 1(a) shows the original image.Fig1 (b) is convoluted image from the gabor filter.Fig1(c) shows the Gaussian filter output and fig1(d) shows the processed output of the algorithm.Fig1(e) shows the defected area segmented from the image.Fig 2 shows a Tile with zig zag crack in which Fig2(a)-Fig2(e) shows the various processed states of the image
(a) (b)
(c)
(d)
(e)
Fig 2 (a)Original image (b)Convoluted output from gabor filter (c)Gaussian filter output (d) Processed output from searching algorithm (e) Segmented output.
Fig 3 shows the Orange fruit which has some defected portions
(a) (b)
(c)
(d) (e)
8.Optimal Gabor Filter Method
The optimal Gabor filter method was proposed by Hamid Alimohamdi in his research work [4] detecting skin defects in fruits. The 2D Gabor filter is applied on the image which has different scales and frequencies. The real and the imaginary parts are convoluted to form the filtered image. The Gabor wavelet function is given as
) 13 ( ) 2
exp( . 2
1 exp 2
1 )
,
( 2
2
2 2
Wx j
y x
y x y
x
y x
The Gabor filter gives two types of output one the convoluted image and identified defected region image. The optimized filter is chosen by results based on convolution
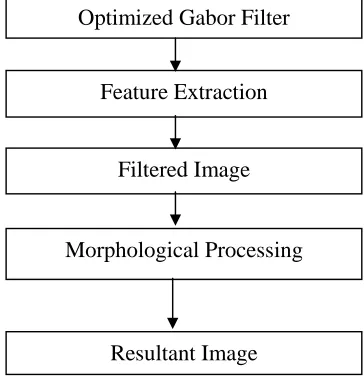
Flow Diagram of Gabor filter Method
The Optimized filter is chosen from varied scales and rotations. The Feature is extracted such as mean and standard variation. The optimum value is chosen by mean divided by square of standard deviation. The threshold value is chosen from the mean value with appropriate intensity variation to obtain the filtered image. The Filtered image is subjected to morphological operations such as dilation and erosion with the help of structural element to obtain the resultant image. Figure 4 consists of a crack in a wall and the convoluted and segmented images
(a) (b) (c) Fig 4 (a) Original image (b) Convoluted Gabor filter image (c) Segmented image Figure 5 consists of a Zig Zag crack in a tile
(a) (b) (c) Fig 5 (a) Original image (b) Convoluted Gabor filter image (c) Segmented image
Figure 6 consists of mango fruit with damaged areas
(a) (b) (c) Fig 6 (a) Original image (b)Convoluted Gabor filter image (c) Segmented image
Optimized Gabor Filter
Feature Extraction
Filtered Image
Morphological Processing
Figure 6 shows the original image, the convoluted image and the segmented image of a spoiled mango fruit.
9.Analysis
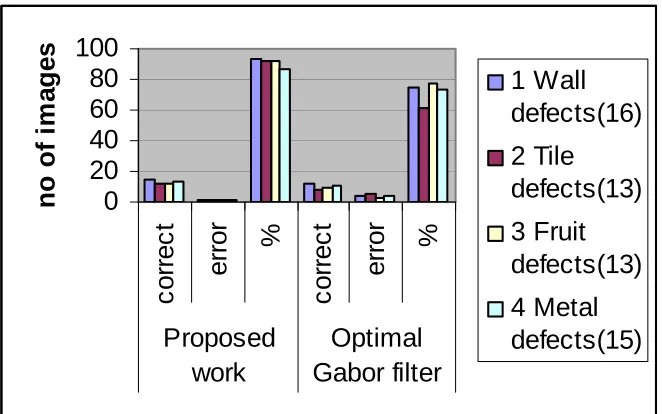
Various images with defects such as cracked walls,broken tiles,defected metals and spoiled fruits were utilized to identify the effectiveness of the algorithm and it is also compared with optimized gabor filter method.The algorithm is more than 85% efficient in detecting the defects.
S.no Image defect
types(total images)
Proposed work Optimal Gabor filter method
correct error % correct error %
1 Wall defects(16) 15 1 93.7 12 4 75
2 Tile defects(13) 12 1 92.3 8 5 61.5
3 Fruit defects(13) 12 1 92.3 10 3 76.9
4 Metal defects(15) 13 2 86.6 11 4 73.3
Table 1 Efficiency comparative analysis
The following diagram shows the pictorial representation of the above statistics
0
20
40
60
80
100
co
rr
e
ct
e
rro
r
%
co
rr
e
ct
e
rro
r
%
Proposed
work
Optimal
Gabor filter
no of
i
m
a
g
e
s
1 Wall
defects(16)
2 Tile
defects(13)
3 Fruit
defects(13)
4 Metal
defects(15)
Chart Analysis 10.Conclusion
The proposed algorithm is tested with various sample images with defects. The Algorithm has proved to be 85% efficient in the sample images which we have tested. The Algorithm is suitable for both texture and non texture images.This proposed research work detects the defects in texture images with non texture methods.How ever this algorithm is suitable for images which have defects in low intensity levels.For detecting defects in high intensity levels further analytical and algorithmic research has to be done.
11.References
[1] Ajay Kumar,Grantham Pang “Defect detection in texture materials using gabor filters” The university of Hong Kong,Hong kong [2] Claus Neubauer “Segmentation of defects in textile fabric” 1992 IEEE
[4] Hamid Alimohamdi, Alireza Ahmady “Detecting skin defect of fruits using optimal Gabor wavelet filter” by International conference on Digital image Processing
[5] Henry Ngan.Y.T, Grantham Pang K.H., Yung.S.P, Michael k.ng “Wavelet based methods on patterned fabric defect detection” by Journal of Pattern recognition, 2006, Elsevier
[6] Henry Ngan.Y.T,Grantham pang.K.H,Yung.S.P,Michael K.Ng “Wavelet based methods on pattern fabric defect detection” Elsevier,Pattern Recognition 38(2005) 559-576
[7] Jun Xie, Yifeneg Jiang, Hung-tat Tsai “Segmentation of kidney from ultra sound images based on texture and shape priors” by IEEE transaction of medical imaging, 2005
[8] kaicheng yin, Weidong yu “Image processing for the use of garment production detection System” by 2008 Congress on image and signal processing
[9] Kaicheng Yin,Weidong Yu “Image Processing for the use of garment production detection system” 2008 congress on image and signal processing
[10] Pei Li,A.Lynn Abbott,Daniel L.Schmoldt “Automated analysis of CT images for the inspection of Hardwood Logs”1996 IEEE [11] Serdaroglu.A, Ertuzun.A, Ercil.A “Defect detection in textile fabric images using wavelet transforms and independent component
analysis”
[12] Sobral.J.L “Optimized filters for texture defect detection”
[13] Tamnun E Mursalin,Fajrana Zebin Eishita,Ahmed Ridwanul Islam “Fabric Defect Inspection System using Neural Network and Microcontroller” 2005-2008 Journal of theoretical and Applied information technology
[14] Yanfang Han,Pengfei Shi “An Adaptive level-selecting wavelet transform for texture defect detection” Elsevier Image and Vision computing (2007) 1239-1248
[15] Yi-Leng Chen,Tse-Wei Chen,Shao-Yi Chien “Fast texture feature extraction method based on segmentation for image retrivel” ICSE 2009
[16] Yiling Chen, Tse-Wei Chen, shao-yichen “Fast texture feature extraction method based on segmentation for image retrieval” by 13th IEEE International Symposium on consumer electronics, 2009