Moisture Dependent Physical Properties of
Soybean
S.S. Shirkole1, R.N. Kenghe2* & P.M. Nimkar3
1and 3 Department of Agricultural Process Engineering, Faculty of Agricultural Engineering, Panjabrao Deshmukh Krishi Vidyapeeth, Akola-
444 104 (India)
2*. Corresponding author, Department of Agricultural Process Engineering, Mahatma Phule Krishi Vidyapeeth, Rahuri-413 722 (India)
Email: rnkenghe@yahoo.co.in
……….
Abstract: Soybean varieties (cv. TAMS-38 and JS- 335) were evaluated for their physical properties that are often required in order to design production processes and equipments at moisture contents of 7.30% to 30.80% and 7.35% to 30.70% (d.b.) for TAMS-38 and JS-335 respectively. The grain size, thousand grain weight, and angle of repose were found linearly increased with increase in moisture contents. The grain sizes was found increased from 5.92 to 6.65 and 5.64 to 6.37mm; thousand grain weight 124.2 to 154.4 and 103.5 to 137.3 g; and angle repose 27.37 to 30.37 and 28.00 to 30.850., respectively, with the increase in moisture contents. The results indicated that per cent increase in terminal velocity of TAMS- 38 and JS- 335 were 20.0% and 13.79%. The bulk density, true density, porosity and sphericity were found linearly decreased with increase in moisture content. The bulk density was decreased from 673.5 to 608.6 and 662.4 to 598.4 kg/m3 , true density 1192.1 to 983.4 and 1147.1 to 948.4 kg/m3, porosity 43.4% to 38.1% and 42.2% to 36.9% whereas, sphericity decreased from 85.1% to 77.4% and 86.3% to 78.3%, respectively for TAMS- 38 and JS- 335 with corresponding increase in moisture content. The values of static coefficient of friction varied from 0.390 to 1.428 against various surfaces.
Keywords: soybean; physical properties; true density; sphericity; moisture
1. Introduction
Soybean (glycine max L.) crop is gaining increasingly importance because it is one of the main food source of protein in human and animal nutrition. It is a food source which contains high quality protein and does not contain cholesterol and saturated fatty acids. It is used in food industry for products like gliserol and soybean oil. A large number of Indian and Western dishes such as bread, chapati, milk, sweets, and pastries can be prepared with soybean. Soybean has been reported to have originated in Eastern Asia. It contains about 40% protein and 20% oil. Soybean protein is rich in the valuable amino acid lycine (5%). India contributing 4% of the soybean production to the total world production. In India during 2006-07 area, production and yield of soybean is reported as 2.16 million hectares, 1.23 million tonnes and 567 kg/ha, respectively [1]. Production of soybean in India at present time is restricted mainly to Madhya Pradesh, Uttar Pradesh, Maharashtra and Rajasthan. It is also grown on a small acreage in Andhra Pradesh, Karnataka, Nagaland, and Gujarat. Modern technology of harvesting and threshing requires the knowledge of physical and mechanical properties of agricultural produce [2]. In recent years number of researchers studied the moisture dependent properties of various seeds, fruits which are frequently required for designing aeration, drying, storage and transportation equipments. The moisture dependent physical and mechanical properties were studies for minor millets [3] wheat kernel [4], pomegranate seeds [5] and feba beans [6] Moisture dependent physical properties of soybean are still scaring therefore, the present investigation was planned to evaluate these properties.
2. Materials and Methods
2.1 Test Samples
calculated quantity of distilled water and conditioned to raise their moisture content to the desired levels with the method described by [7]
2.2 Determination of Physical Properties
The physical properties, viz., grain size, sphericity, bulk density, true density, porosity, thousand grain weight, angle of repose, terminal velocity and static coefficient of friction for selected varieties of soybean were studied at different five levels of moisture content from 7.30%, 13.15%, 19.10%, 24.90% and to 30.80% and 7.35%, 13.20%, 19.05%, 24.80% and 30.70% (d.b.), respectively in order to relate the property to moisture content. Moisture content of grain sample of known weight (about 25 g) was determined following a standard oven drying method at an air temperature of 103 + 20 C for 72 h and subsequently cooling in desiccators for one hour before taking a final weight. Average of five replications was noted and reported as moisture content of the sample.
The geometric mean diameter (grain size), sphericity, were calculated according to method described by [8]. Bulk density, true density and porosity were measured as per the method given in [9]. One thousand randomly selected sound grains of soybean sample at various moisture levels were measured as per the procedure described in [9]. Angle of repose was determined by angle of repose apparatus as suggested in [10] .The static coefficient of friction was determined for six different structural materials, namely, stainless steel, aluminium, galvanized iron, mild steel, plywood, and rubber on the laboratory instrument developed at the department. A plastic cylinder of 100 mm diameter and 50 mm height was placed on an adjustable tilting plate faced with the test surface and filled with the sample of about 150 g. The cylinder was raised slightly so as not to touch the surface. The structural surface with the cylinder resting on it was inclined gradually, using a screw device (screw pitch 1.4 mm), until the box just started to slide down. The angle tilt was read from a graduated scale as given in [11] and as suggested by [12]. All the observations were replicated five times and the average values were reported.
The terminal velocity of the grain at different moisture contents were measured using an air column in which the material was suspended in the air stream. Relative opening of a regulating valve provided at blower output and was used to control the airflow rate. In the beginning, the blower output was set at minimum. For each test a sample was dropped in the air stream from the top of an air column. Then airflow rate was gradually increased till the grain mass gets suspended in the air stream. Air velocity near the location of grain suspension was measured using a constant temperature- type anemometer having a least count of 0.1 m/ s. All the properties were determined with five replicated samples.
2.3 Data Analysis
The results obtained was analyzed by using completely randomized design for the analysis of variance showing the effect of moisture content on these physical properties of soybean. Two varieties of soybean and five moisture levels were the independent variables and the physical properties were the dependent variables. The treatment effects were analyzed using ANOVA PROC of SAS software.
3. Results and Discussion 3.1 Grain size
The variation observed in grain size of soybean with increase in the moisture content is shown graphically in figure 1; indicating that the grain size increased linearly with increase in moisture content. The grain sizes were found to be increased from 5.92 to 6.65 and 5.64 to 6.37 mm respectively for TAMS -38 and JS-335. This variation in grain size with moisture content was significant at 1% level of significance. The results showing increase in grain size with increase in moisture content were in agreement with the earlier findings for rough rice [13], laurel seeds [14] , soybean [15] and for lentils [16] Following relationship could represent the variation in grain size with moisture content.
TAMS- 38 Dm = 5.688 + 0.030M R2= 0.994 (1)
JS- 335 Dm = 5.399 + 0.032M R2 =0.998 (2)
where,
Fig 1: Effect of moisture content on size of different varieties of soybean
3.2 Sphericity
The experimental results in respect of sphericity of soybean with increase in the moisture content is shown graphically in figure 2; which indicated that the sphericity decreased linearly with increase in moisture content. The values of sphericity was found decreased from 85.1% to 77.4%; 86.3% to 78.3%, respectively for TAMS-38 and JS-335. This variation in sphericity with moisture content was significant at 1% level of significance. The sphericity of these grains was found to have the following relationship with moisture content.
TAMS-38 S = 87.18 - 0.321M R2 = 0.994 (3)
JS-335 S = -0.331M + 88.77 R2 = 0.990 (4)
where,
S = sphericity, % and M = moisture content, % (d.b.).
The linearly negative change of sphericity depending on the increase of moisture content was reported in earlier findings for pigeonpea [17], lathyrus [18], and for red bean [19].
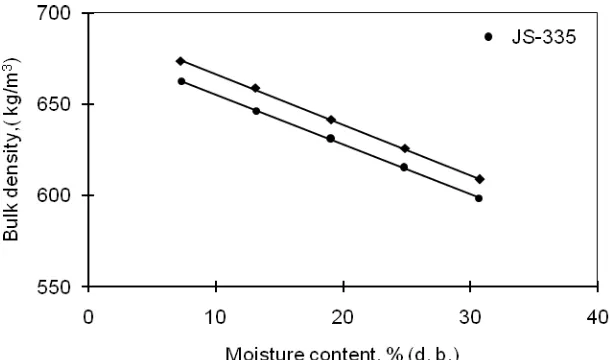
3.3 Bulk density
The results of bulk density with moisture content are graphically shown in figure 3. It was observed that the bulk density decreased linearly with increase in moisture content and this change was significant at 1% level of significance. The bulk density was decreased from 673.5 to 608.6; 662.4 to 598.4 kg/m3, respectively. The decrease in bulk density for soybean sample with increase in moisture content indicated that the increase in mass owing to moisture gain in the grain sample was lower than accompanying volumetric expansion of the bulk. The bulk density of this grain was found to have the following relationship with moisture content.
TAMS-38 ρb = 694.5 - 2.773M R2 =0.994 (5)
JS- 335 ρb = 682.5 − 2.720M R2 = 0.999 (6)
where,
ρb = bulk density, kg/m3,and
M = moisture content, % (d. b.).
Similar trends were reported for laurel seed [14], lentils [16], lathyrus [18], shelled and kernel walnuts [20] and for minor millets [21].
Fig 3: Effect of moisture content on bulk density of different varieties of soybean
3.4 True density
The variation in true density values with moisture contents is graphically shown in figure 4. It was found that the true density values decreased linearly with increase in moisture content. The values of true density were decreased from 1192.0 to 983.4; 1147.1 to 948.4 kg/m3. The decrease in true density value for the soybean grain with increase in moisture content might be attributed to the relatively higher true volume as compared to corresponding mass of the grain attained due to adsorption of water. The variation in true density with moisture content of soybean was significant at 1% of significance level and the relationship between true density and moisture content could be represented with the following relationship:
TAMS- 38 ρt = 1250 - 8.058M R2 = 0.934 (7)
JS- 335 ρt = 1206 − 8.484M R2 = 0.999 (8)
where,
ρt = true density, kg/m3, and
Similar trends were also observed for red kidney bean [22], safflower seed [23] and for moth gram [7]
Fig 4: Effect of moisture content on true density of different varieties of soybean
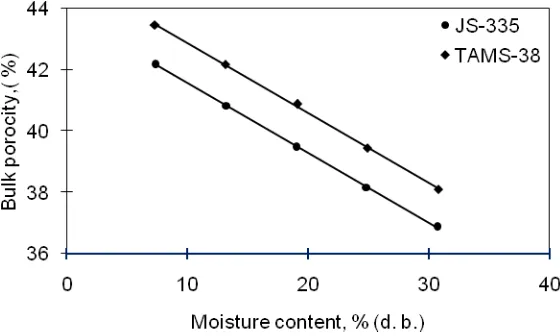
3.5 Bulk porosity
The experimental results for bulk porosity with moisture content are shown graphically in figure 5. Porosity values were found to be decreased linearly with increase in moisture content and this change was significant at 1% level of significance. The decrease in porosity values were 43.4 to 38.1; 42.2 to 36.9%, respectively for TAMS-38 and JS- 335. The relationship between porosity and moisture content of soybean is represented with the equation:
TAMS -38 ε = 45.18 - 0.229M R2 = 0.995 (9)
JS- 335 ε = 43.85 − 0.227M R2 = 0.999 (10)
where,
ε = porosity, % and
M = moisture content, % (d.b.).
The results were in agreement with the reported results for sorghum seed [24] , soybean [15], bambara groundnuts
[25]
and for lentil [16]
3.6 Thousand grain weight
The results obtained for thousand grain weight of soybean with increase in the moisture content is shown graphically in figure 6. It was observed that thousand grain weight increased linearly with the increase in moisture content and this change was significant at 1% level of significance. The values found increased from 124.2 to 154.4, 103.5 to 137.3 g, respectively, for TAMS-38 and JS-335. This increase could be attributed to the moisture absorbed by the grains. The variation of thousand grain weight with the moisture content of the grains could be represented by the following equation:
TAMS- 38 Wt= 114.5 + 1.295M R2 = 0.994 (11)
JS-335 Wt = 92.50 + 1.468M R2 = 0.999 (12)
where,
Wt = thousand grain weight, g and
M = moisture content, % (d.b.).
The results of effect of grain moisture on thousand grain weight have been reported for olive cultivars [26] , rough rice [13] , paddy grains [27], lathyrus [18] and for red bean [19]
Fig 6: Effect of moisture content on 1000- grain weight of different varieties of soybean
3.7 Angle of repose
The variation observed in angle of repose of soybean with increase in the moisture content is shown graphically in figure 7. It was observed that angle of repose increased linearly with the increase in moisture content and this change is significant at 1% level of significance. The values of angle of repose was increased from 27.3 to 30.3, 28.0 to 30.80, respectively for TAMS-38 and JS-335. At higher moisture content within the experimental range, grain might tend to stick together resulting in better stability and less flowability, which increases the value of angle of repose. The variation in angle of repose with the moisture content of the grain could be represented by the following equation:
TAMS-38 Ф = 26.45 + 0.128M R2 = 0.992 (13)
JS-335 Ф = 27.25 + 0.121M R2 = 0.981 (14)
where,
Ф = angle of repose, degree and M = moisture content, % (d.b.).
Fig 7: Effect of moisture content on angle of repose of different varieties of soybean
3.8 Static coefficient of friction
The static coefficient of friction for soybean determined with respect to six different structural surfaces, are given in Table 1. It was observed that the static coefficient of friction for soybean increased with increase in moisture content on all surfaces. The values of static coefficient of friction were found in the range of 0.390 to 1.428 against various surfaces for both the soybean varieties tested in the specified level of moisture contents. At all moisture levels, the static coefficient of friction was greatest against rubber followed by plywood, mild steel, galvanized iron, aluminium and the least for stainless steel. It was observed that moisture had more effect than the material surface on the static coefficient of friction. This is owing to the increased adhesion between the grain and the material surface at higher moisture content. Similar results were reported for rye kernel [29], wheat grain [30], wheat kernel [4], minor millets [3] and for rough rice [13].
Table 1. Values of static coefficient of friction for different varieties of soybean against different surfaces
Soybean variety
Moisture content
% (d.b.)
Stainless
steel Aluminium
Galvanized
iron Mild steel Plywood Rubber
TAMS- 38
7.30
0.37 (0.021) 0.98 (0.012) 1.03 (0.004) 1.13 (0.004) 1.16 (0.015) 1.18 (0.002)
13.15
0.55 (0.001) 1.00 (0.100) 1.06 (0.002) 1.15 (0.015) 1.17 (0.002) 1.19 (0.001)
19.10
0.63 (0.002) 1.01 (0.002) 1.13 (0.020) 1.16 (0.020) 1.91 (0.030) 1.20 (0.002)
24.90
0.87 (0.001) 1.07 (0.002) 1.17 (0.001) 1.20 (0.002) 1.23 (0.003) 1.24 (0.003)
30.80
0.85 (0.050) 1.17 (0.002) 1.30 (0.025) 1.32 (0.007) 1.37 (0.002) 1.39 (0.001)
JS-335
7.35
0.64 (0.040) 0.91 (0.030) 0.94 (0.002) 1.09 (0.001) 1.24 (0.002) 1.27 (0.003)
13.20
0.63 (0.002) 1.01 (0.002) 1.03 (0.002) 1.11 (0.030) 1.26 (0.003) 1.29 (0.002)
19.05
0.64 (0.002) 1.02 (0.003) 1.05 (0.003) 1.13 (0.003) 1.28 (0.002) 1.30 (0.020)
24.80
0.78 (0.001) 1.17 (0.001) 1.18 (0.015) 1.23 (0.002) 1.29 (0.002) 1.32 (0.001)
30.70
1.00 (0.100) 1.19 (0.002) 1.23 (0.002) 1.28 (0.002) 1.32 (0.001) 1.42 (0.003)
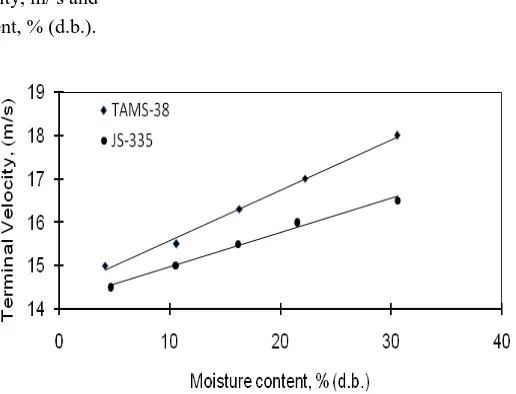
3.9 Terminal velocity
Results obtained for experimental values of terminal velocity of different varieties of soybean are as shown in figure 8. It was observed that the terminal velocity increased linearly with the increase in moisture content and this change was significant at 1% level of significance. The results were in agreement with the results reported for moth gram [7], red bean [19] and for feba bean [6]. The variation of terminal velocity with increase in grain moisture content could be correlated with following relationships:
TAMS-38 Vt = 14.43 + 0.118M R2 = 0.994 (15)
JS-335 Vt = 14.22 + 0.078M R2 = 0.990 (16)
where,
Vt= terminal velocity, m/ s and
M = moisture content, % (d.b.).
Fig 8: Effect of moisture content on terminal velocity of soybean
4. Conclusions
The physical properties of soybean grains showed linear regression equations as a function of moisture content with high correlation except sphericity. The grain size, thousand grain weight, terminal velocity and angle of repose were found linearly increased. The percent increase found was 12.94%; 12.33%, 24.24%; 32.66%, 20.0%; 13.79% and 10.96%; 10.17%, respectively for TAMS-38 and JS-335. The bulk density, true density, porosity and sphericity were found linearly decreased. The percent decrease found was 9.63%; 9.65%; 17.49%; 17.32%; 12.37%; 12.55% and 9.03%; 9.25%, respectively. The values of static coefficient of friction were found in the range of 0.390 to 1.428 against various surfaces for both the soybean varieties tested in the specified level of moisture contents.
5. References
[1] IOS Area and production of crops in India. Indian Official Statistics, Directorate of Economics and Statistics, 2007.
[2] Grundas, S. and G. Skubisz Physical properties of cereal grain and rape stem, Research Agricultural Engineering, 54, (2), 2008, 80– 90.
[3] Subramanian, S and R.ViswanathanBulk density and friction coefficients of selected minor millets and flours. Journal of Food Engineering, 81(1), 2006, 118-126.
[4] Dziki, D., J. Laskowski., M. Siastala and B. Biernacka Influence of moisture content on wheat kernel mechanical properties determined on the basis of a shear test. International Agrophysics, 24, 2010, 237-242.
[5] Kingsly, A.R.P., D. B. Singh. M.R Manikantan and R.K. Jain Moisture dependent physical properties of dried pomegranate seeds. Journal of Food Engineering, 75, 2006, 492-496.
[6] Altuntasa, E. and M.Yildizb Effect of moisture content on some physical and mechanical properties of faba bean (Vicia faba L.) grains. Journal of Food Engineering, 78 (1), 2007, 174-183.
[7] Nimkar, P.M., D.S. Madwe and R.M. Dudhe Physical properties of moth gram. Biosystems Engineering, 91(2), 2005, 183-189. [8] Mohsenin, N.N.. Physical Properties of Plant and Animal Materials. Gordon and Breach Science Publishers, 1986, New York. [9] ISI Methods of analysis for food grains. Determination of hectoliter weight. Indian Standard Institution, (4333 Part- III), 1967,New
Delhi.
[12] Izli, N., H.Unal and M. Sincik Physical and mechanical properties of rapeseed at different moisture content. International Agrophysics, 23, 2009, 137-145.
[13] Araghi, H. A., M. Sadeghi, and A. Hemmat Physical properties of two rough rice varieties affected by moisture content. International Agrophysics, 24, 2010, 205-207.
[14] Yurtlu, Y.B., E. Yesiloglu and F. Arslanoglu Physical properties of bay laurel seeds. International Agrophysics,24, 2010, 325- 328. [15] Kibar, H. and T. Ozturk. 2008. Physical and mechanical properties of soybean. International Agrophysics, 22, 239-244.
[16] Amin, M.N., M.A. Hossain and K.C. Roy Effects of moisture content on some physical properties of lentil seeds. Journal of Food Engineering, 65, 2004, 83-87.
[17] Baryeh, E.A. and B.K .Mangope Some physical properties of QP-38 variety pigeon pea. Journal of Food Engineering, 56, 2002, 59-65.
[18] Zewdu, A. and W. Solomon Moisture dependent physical properties of grass pea (lathyrus sativus. L.) seeds. Agricultural Engineering International, CIGR e-Journal, 10, 2008, FP 06027.
[19] Kiani, D. M. Kiani, S. Minaei, H Maghsoudi and V.M. Ghasemi Moisture dependent physical properties of red bean (Phaseolus vulgaris L.) grains. International Agrophysics, 22, 2008, 231-237.
[20] Altuntas, E. and M. Erkol Physical properties of shelled and kernel walnuts as affected by the moisture content. Czech Journal of Food Science, 28, 2010, 547–556.
[21] Balasubramanian, S. and R.Viswanathan.Influence of moisture content on physical properties of minor millets. Journal of Food Science and Technology, 47(3), 2010, 279-284.
[22] Isik, E. and H. Unal Moisture dependent physical properties of white speckled red kidney bean grains. Journal of Food Engineering, 82(2), 2007, 209-216.
[23] Baümler, E., A. Cuniberti, S.M Nolasco, and I.C. Riccobene Moisture dependent physical and compression properties of safflower seed. Journal of Food Engineering, 72, 2006, 134-140.
[24] Mwithiga, G. and M.M. Sifuna Effect of moisture content on the physical properties of three varieties of sorghum seeds. Journal of Food Engineering, 75, 2005, 480-486.
[25] Baryeh, E.A Physical properties of bambara groundnuts. Journal of Food Engineering, 47, 2001, 321-326.
[26] Ozturk, I., S. Ercisli and M. Kara Chosen physical properties of olive cultivars (olea europaea L.). International Agrophysics. 23, 2009, 309- 312.
[27] Asli-Ardeh E.A., Y.A. Gilandeh and S. ShojaeiDetermination of dynamic friction coefficient of paddy grains on different surfaces. International Agrophysics, 24, 2010, 101-105.
[28] Ndukwu, M. C Determination of selected physical properties of Brachystegia eurycoma seeds. Research Agricultural Engineering, 54, (2): 2008, 80–90.