454
Safety Practice In The UK Shipping Industry – A
Quantitative Assessment
Veluplay G.K., Shenoi R.A., Tsimplis M.N., Abdul Rahman, N.S.F.
Abstract: This paper assesses the safety practice of the shipping industry using primary evidence from responses to a questionnaire on safety aspects completed by 317 seafarers who either work on UK registered vessels or hold a UK Certificate of Competency (CoC) while working on non-UK vessels. Hierarchical Cluster analysis has been used to classify the selected safety aspects into two clusters based on their internal consistency. Multiple Regression Analysis has been used to identify the parameters based on the seafarer‘s perception that, influence the safety culture in shipping based on the seafarer‘s perception. Five parameters have a particularly close relationship with safety culture: these are reporting culture; communication and language barrier; health awareness; importance of maritime regulations; and risk awareness. The results also highlight some areas of concern as perceived by seafarers. Safety practice aspects where improvements need to be made are also identified in the paper.
Index Terms: Safety culture, Quantitative assessment, Cluster analysis, Maritime safety, Factor analysis, Multiple Regression analysis, Human error.
————————————————————
1.
INTRODUCTION
Environmental conditions, technical failures, human errors and cargo related factors are the main factors causing accidents on ships [1]. Rothblum [2] argued that most accidents happened due to a combination of human error and organizational factors people performed. Apart from causing loss of life and personal injury, property damage and pollution, serious accidents also lead to alterations to the regulatory system applicable to shipping. The sinking of the ‗Herald of Free Enterprise‘ turned the attention of policy makers towards safety management and triggered the establishment of the International Safety Management (ISM) Code for the safe management and operation of ships and pollution prevention [3], introduced by the International Maritime Organisation (IMO) in mid-1998. The regulatory response aimed in preventing recurrence of accidents caused by human errors [4]. Indeed, since the ISM Code was implemented, the safety record of the shipping industry appears to have improved [5] .This is supported by an analysis [5] which identified a reduction by 12.2% of the number of accidents in Greek ships due to human error in the period after the ISM Code was implemented. However, maritime accidents are still happening on a daily basis around the globe. A total of 24,545 accidents have been recorded world-wide in the period 2005-2014 [6]. This number indicates that there is room for improvement either in the ISM Code itself or its implementation.
Thus, research on the safety parameters and factors that causes accidents is topical and of practical significance. While the statistical analysis of accidents can illustrate the importance of the problem and lead to conclusions concerning the efficiency of regulatory changes, understanding the factors that contribute to the creation of risks is more challenging. In this respect, the perception and the views of seafarers working on board ships can provide useful insight about the prevailing safety culture and changes in its perception. This paper undertakes a quantitative study on the seafarers‘ perception of safety culture in shipping industry. The main aim of this study is to explore the perception of safety seafarers hold through two related objectives: 1) relationships seafarers perceive to exist among various safety parameters on-board ships and 2) identify the safety aspects the seafarers believe contribute most towards an improved on-board safety culture.
2.
SAFETY PRACTICE ASPECTS
2.1.Definition of safety culture and its aspects
Safety culture is defined as a product of attitudes, perceptions, competencies and patterns of behaviour that determine the commitment, style and proficiency of an organisation‘s health and safety management [7]. In other words, a blend of attitudes, values and perceptions that is practised or done in a workplace. The concept of safety culture is used to refer to the behavioural aspects (responses of an individual to adapt to his/her environment) and the situational aspects (an individual‘s action beyond control) of a company [8]. Oltedal [9] who studied safety culture and safety management within the Norwegian shipping industry, has pointed out that both organisational culture (risk perception, standards and moral principles) and managerial features (commitments and supports) influence safety. Seafarers are both part of the safety culture attitudes and at risk of its failures. That is why this research studies the seafarer‘s perception of whether several safety aspects, perceived as independent parameters, affect the safety culture in shipping, perceived as the dependent parameter.
2.2 Ten safety practise aspects
There is a wide range of safety practice aspects to be assessed. Many researchers label safety aspects differently ————————————————
Veluplay G.K is a research fellow in Universiti Malaysia Terengganu, Malaysia and recently completed a PhD degree in maritime safety in University of Southampton, United Kingdom. E-mail: vgobikrishnan@yahoo.com
Shenoi R.A. is a professor of lightweight structures within Engineering and Physical Sciences at the University of Southampton, United Kingdom. E-mail: R.A.Shenoi@soton.ac.uk
Tsimplis M.N.is a Professor of Law at the City University of Hong Kong, Hong Kong. E-mail: mtsimpli@cityu.edu.hk
and include a variation of items within aspects that makes comparisons of the safety culture research to be complex. In this study, the researcher has studied different aspects of safety practice, which concern industrial practice and including those in shipping sector. Based on the reading, ten aspects/variables of the safety practise that have been identified in the published literature as having an impact on safety culture were selected and included in the questionnaire this research was based on. The researcher has improvised the scope of the existing safety aspects based on literature review and discussions with with experts in the field. An overview of the content of each aspect is outlined below.
1. Working environment satisfaction
Working environment satisfaction is achieved when the work place is safe, supportive and understanding. Such a work place enables personnel to perform effectively [10] and influences an individual‘s perspective on risk and safety in shipping sector [11]. However, seafarers are also exposed to stress factors in working environment such as adverse weather, noise, high job demand, shift work and isolation from family and friends [12]. Conversely, studies shows there is a positive connection between work environment and job satisfaction on the one hand and improved work performance on the other hand [13]. Therefore, working environment satisfaction aspect is definitely has to be studied as it has an important role in safety practice.
2. Reporting culture
A reporting culture encourages institutionally the seafarer to report incidents or anomalies using a well-functioning reporting system which is then used further to prevent similar occurrence in the future [11]. However, studies have showed that a reporting culture is lacking in the shipping industry [14] despite the compulsory character of The International Safety Management Code (ISM Code) which requires shipping companies to establish a system for reporting incidents and near misses [15]. Therefore, reporting culture aspect is vital to be studied as it can help to find the best practices for near miss reporting and to improve utilisation of reporting in shipping.
3. Communication and language barrier
Communication is vital to guarantee that the right people are kept informed of the state of the system in order to make the right moves and decisions [11]. Holt [16] claimed that good communication is an important element of safety that could result in better safety standards and effect of safety policies. The use of a common language is crucial for efficient communication in the normal daily work both on board the ship and in seeking assistance from the managing office. The ISM Code requires shipping companies to ensure that all personnel receive all the information on the safety management system (SMS) in a language understood by them. The company should also ensure that the ship‘s personnel are able to communicate effectively while carrying out their duties related to the SMS [15]. This has strengthen the fact that communication and language barrier is an important aspect in safety practice that needs to be studied.
4. Competency level
The competency level of employees depends on effective education and training. Inadequate education and training are among the causes linked to accidents in the maritime sector [17]. In this study, seafarers were asked to assess their competency level they believe they reflect and how such level contributes towards the safety of the ship‘s operation. Based on regulation requirements, seafarers are require to have specific training and able to display the abilities require by their job and have examined and deemed competent. Hence, the competency level aspect is another important factor of safety practice that needs to be studied.
5. Shore management support
Shore support is crucial to assist a ship to perform all operations smoothly and safely. These safety aspects assesses the importance of ship-shore interface management in achieving safety on-board the ship [18]. It addresses the question whether the needs of seafarers such as information and advice on safety and work-related issues, healthcare and training is being received. In fact, the shipping trade or activities cannot survive only with the help of ships and seafarers, and therefore the interference and support from shore management is important. Without the involvement of shore management support, it is not possible for a ship to perform all the operations on its own. Hence, this brings in the need to study the importance of shore management support.
6. Health awareness
In this contex, health awareness is defined as conscious perception of physical and health status that allows one to recognise harmful life style or surroundings that could affect their health. It is also defined as the pursuit of optimum health [19]. This parameter is assessed by a number of questions related to the seafarer‘s routine and lifestyle. Studies have revealed that poor health awareness could increase the risk of fatigue or injuries and also will diminish work performance and safety [20]. Studies have also showed that health related issues among seafarers has increased by 50% upon boarding ship. For example, the physical and psychosocial stresses among seafarers remain significant despite the improved environment on board ships. Seafarers‘ health is always being affected by poor management strategies, reductions in crew sizes which eventually increases the working hours, and overload of paperwork which have the potential to led to fatigue [21]. Therefore, health awareness is an important aspect of safety practice that needs to be studied.
7. Safety culture
456 responses of good safety culture prevailing. On the other
hand, everything to do with shipping has to have an element of safety culture, which makes people to aware about working safely [23]. Without an effective safety culture people would not aware about preventing accidents and simply deal with them as and when they happen. This is the reason the safety culture aspect is included in this study.
8. Importance of maritime regulations
Safety regulation and its implementation influences industrial performances of hazardous activities from health, safety and environmental considerations [24]. In the shipping industry, safety regulations can decrease the frequency of accidents and also motivate maritime organisations to take safety precautions more seriously [25]. The seafarer‘s perception on importance of maritime regulations will be assessed by several questions related to the seafarer‘s responsibilities and compliance to the regulations. It is important for the seafarers to fully understand and obey the regulations and hence, this aspect is included in this study to determine whether the seafarers in the UK shipping industry are aware, the importance of maritime regulations as a part of safety practice.
9. Risk awareness
Risk is the combination of the frequency and the severity of the consequence [26], which clear two components of the likelihood of occurrence and the probability of severity of the unpredictable consequences. Seafarer‘s risk awareness is an indicator of the actual shipboard safety level such as hazard, gain or loss and uncertainty [27]. It may be directly or indirectly affected by an organisation‘s safety management procedures [28]. As an initiative, in Norway, many regulations have been implemented as priority is given to safety in the offshore industry. The existence of hazardous risk that lead to risk of occupational accidents and major accidents highlight the importance of having such regulations [28]. Therefore, it is important for a seafarer to aware and be alert of any risk around on the ship as it could prevent casualty. In this section, the level of risk awareness among the seafarer‘s is assessed based on questions related to their working procedures and styles. Hence, risk awareness is a vital aspect to study safety practice in the UK shipping industry
10. Job satisfaction
Job satisfaction is closely linked with performance. A satisfied work force will create a good atmosphere within the organisation or on board, which will encourage the crew to perform better and thus enhance the safety. Moreover, a person with high level of job satisfaction, will portrait positive attitudes towards the job, while a person with low level of satisfaction will possess negative attitudes towards the job [29]. An organisation plays an important role to create a satisfied work force [29]. For example, working environment based on contract length, schedule and time off, ship life category, continuous support and motivation from the company and supervisor, and professional development will attract and motivate employees to keep coming to work and achieve better work performance [30]. Since job satisfaction has a huge impact of work
performance, it is important to include this aspect to study the safety practice in the UK shipping industry.
3.
DATA AND METHODOLOGY
A quantitative questionnaire-based survey method has been used to identify the relationships in the seafarer‘s perception among the ten safety practices. The process used to collect the relevant data is described in the following sub-section.
3.1. Identify study aim and objectives
The main aim of this study is to explore the perception of safety seafarers hold through two related objectives: 1) relationships seafarers perceive that exist among various safety practice aspects on-board ships and 2) identify safety aspects that shipping personnel believes contribute most towards an improved on-board safety culture.
3.2. Study design
For this study, a questionnaire survey based quantitative method was undertaken. There are three main types of quantitative research methods, namely: descriptive; experimental; and causal comparative [31]. In this study, a descriptive method was adopted to develop an understanding of the perception of safety culture on board ships. A descriptive method examines a situation, which is the safety practice in shipping industry and involves identification of features of a particular phenomenon based on a questionnaire survey by exploring the correlation between two or more variables. After the indicators and variables of interest have been identified (Section 2.2) and their components have been defined, the researcher can begin designing the questionnaire. Design of the questionnaire can be split into three elements [32] such as:
Determining the questions to be asked. Selecting and specifying the question type.
Designing the question sequence and overall questionnaire layout.
Determining the questions to be asked
In this step, a connection needs to be developed between the research aims and the individual questions by the research issues. In this study, the relevant questions were determined based on the literature as discussed in Section 2.2. A total of 61 questions related to 10 different safety practice aspects were developed. Selecting and specifying the question typesIn this study, closed-ended questions were used. There are several reasons for choosing the questions of this type such as:
These are easier and quicker as the respondents of the study are busy and not all the time available on shore.
It is easier to compare the answers of different respondents.
The answers are easier to code and analyse statistically.
Designing the question sequence and overall questionnaire layout
Don‘t Know, Strongly Disagree, Disagree, Not Sure, Agree and Strongly Agree. The numeric value assigned for this scale is starting at 0 and finishing at 5.
3.3. Data and sources
3.3.1. Data
Data to be used for the analysis is derived from answers to specific questions in the questionnaire. The questions were based on the 10 safety practice aspects identified as important in the relevant literature. A total of 64 close-ended questions with answers on a 5-point scale (1-5) were chosen. The reasons behind choosing questions of this type are: a) that they are easier and quicker to answer; b) that it is easy to compare the answers of different respondents; and c) that the answers are easier to code and analyse statistically.
3.3.2. Identity of respondents
The survey was conducted in two different places: a Maritime Academy (Location A) with 142 respondents and a Shipping Company (Location B) with 175 respondents. According to the ethical elements of research [33], the identities of the individual respondents or companies/institutions involved in the study are kept confidential. The ethic submission and approval has been attached in Appendix A. Seafarers involved in this study include ship engineers, bridge officers, ratings and cadets. The respondents comprised seafarers of various nationalities who work on UK registered vessels or who hold the UK Certificate of Competency (CoC) but work on non-UK registered vessels.
a. Pilot study
A pilot study was conducted prior to the main study to determine if the structure and questions of the questionnaire are yielding the kind of information that is needed. The pilot study took place in Maritime Academy A with 30 respondents. After completing the pilot study, improvements were made to the study design and the research process (refer to sub-section 3.4.2, a. Pilot study).
b. Main study
The study survey took place in the two different places with 317 respondents in total.
3.4. Variables and methods of analysis
3.4.1. Variables
Safety culture as assessed by the seafarers was chosen as the dependent variable. The other nine parameters (working environment; reporting culture; communication and language barrier; competency level; shore management support; health awareness; importance of maritime regulations; risk awareness and job satisfaction) were considered as independent variables potentially contributing to safety culture. This choice is based on the literature, which suggests that the nine safety aspects have influence and will affect the safety culture. Moreover, researchers such as Ek et al. [34], Zohar [35] and Havold [36] have claimed in their research that these safety aspects are important to measure safety culture. In this study, safety culture is not measured independently.
Instead, it is derived from the seafarer‘s questionnaire responses. Thus, this study analyses the link between safety culture and the other parameters in the seafarers‘ perception. Only if it is assumed that, the perception of seafarers about safety culture is an objective measure of safety culture the study can be interpreted as informing on safety on board ships. It is not clear whether such an assumption holds true. However, in the absence of other objective measures of safety culture, which is said to reflect what happens when no-one is watching, the perception of seafarers is considered as a good descriptor that can be relied upon, always aware of the practical limitation of deriving all data from the same source and the same questionnaire. In statistics, a dependent variable is the variable being tested and measured in an experiment. An independent variable is one that is changed or controlled in an experiment to test the effects on the dependent variable [37]. To identify the relationship between dependent and independent variables, a hypothesis is developed. The hypothesis is a formal statement that presents the expected relationship between an independent and dependent variable [38]. A null hypothesis H0 is the commonly accepted fact and it is the opposite of the alternate hypothesis Hn. Generally, researchers come up with an alternate hypothesis; one that they think explains a phenomenon, and then work to reject the null hypothesis [38]. The hypotheses H0 and Hn in this context are as follows.
General H0: The nine safety aspects collectively do not have a positive impact on safety culture in the perception of seafarers.
Hn (n = 1,2,3, …, 9): The safety aspect has positive impact on safety culture in the perception of seafarers. The safety aspects are as following:
H1: Working environment; H2: Reporting culture; H3: Communication and language barrier; H4: Competency level; H5: Shore management support; H6: Health awareness; H7: Importance of maritime regulations; H8: Risk awareness; and H9: Job satisfaction.
3.4.2 Methods/techniques of analysis
a. Pilot study
Firstly, in the pilot study, a reliability analysis was conducted to measure the internal consistency of the questionnaire. This is an important concern when a psychological test is used to measure some quality or behaviour [39]. It is a way to measure the relationship of group of questions with each other where, it will be an important criterion to decide whether it is appropriate carry out survey in a bigger scale and to attain the intended results. Cronbach‘s alpha, α determines the internal consistency, which is represented through a set of variables as shown in Equation 1. A value of α above 0.6 indicates a high degree of internal consistency [40].
( ) (1)
458 acceptable, as almost all alpha values exceed 0.70. The
item-total correlations, (correlation between the question score) for all the remaining items indicate good correlation. According to Coniam and Falvey [40], values of an item-total correlation between 0 and 0.19 indicate that the item has poor correlation between other items, values of 0.2 - 0.39 indicate good correlation, and values of 0.4 and above indicate very good correlation. Therefore, the pilot study results showed that the survey instrument had sufficiently good reliability or internal consistency to enable use of the questionnaire for the main study.
b. Main study
Reliability of the survey instrument (Factor Analysis) As this study measures the relationship among the 10 safety practice aspects, therefore, it is reasonable to examine the questions relating to the 10 safety practice aspects to identify their reliability. The reliability test had been implied in the pilot study and for the main study. The reliability test was conducted using a Cronbach‘s alpha test. Cronbach's alpha test has been chosen in this study, to examine the error factors that may have occurred due to the use of a range of items for measuring the relationships among the safety aspects. Cronbach‘s alpha is based on the assumption that each test item measures the same latent trait on the same scale [41]. Therefore, if a factor analysis of the items indicates that, there are multiple factors or traits that are being measured by the items; the assumption of the same latent trait is violated. Therefore, this analysis is conducted prior to Hierarchical Cluster Analysis and Multiple Linear Regression Analysis.
Hierarchical Cluster Analysis and Multiple Linear Regression Analysis
Statistical analyses such as Hierarchical Cluster Analysis and Multiple Linear Regression Analysis were applied to the data derived from the main study using the Statistical Package for the Social Sciences (SPSS) [42]. Hierarchical Cluster analysis is an exploratory analysis that discover structures within the data. It is an appropriate method for identifying homogenous groups of objects called clusters [42] in which, will be useful to identify the relationships among various safety aspects in the perception of seafarers . It groups data objects based only on information found in the data that illustrate the object and their relationships. In this study, Hierarchical Cluster Analysis has been used to group the nine independent variables into clusters, which represent the distance between safety aspects based on Pearson correlation. Reliability test is also has been applied to the main study to determine the internal consistency of the safety aspects. The analysis was carried out based on the methodology introduced by Schmitt [43] where, the Cronbach‘s alpha values were compared to corrected correlations between aspects and importantly not to a fixed cut-off value [34]. Schmitt has also claimed that this analysis is sufficient for assessing the internal consistency than using a cut-off value. According to Ek [34], to ensure a high degree of internal consistency, the values of Cronbach‘s alpha should be significantly larger than the correlations between aspects corrected for attenuation. The relationships between the aspects based on seafarer‘s perception were investigated by applying variable
Hierarchical Cluster analysis. The clustering method has applied average linkage (between groups) technique to obtain accurate evaluation of the distance between the variables. The measure chosen to represent the distance between aspects (to determine how closely related two aspects are) was based on the Cronbach‘s Alpha. Then, a multiple regression analysis was carried out including both the dependent parameter (safety culture) and the nine independent parameters to test the relationship between independent and the dependent parameters in the perception of the seafarers. It is an appropriate analysis to account for the variation in the dependent variable as a combination of linear relationship with two or more independent variables.
4.
RESULTS
4.1 Reliability of the survey instrument (Factor Analysis)
she would have obtained if questioned on all possible items in the universe (the true score)‖, [44]. The output of this column indicates how the alpha scale would change if the item was deleted from the scale. Overall, the table shows that the alpha coefficient if the safety practice aspects is 0.9879, which is slightly above the acceptable value of 0.90. This alpha value is then is acceptable because it is not too far from the acceptable range. This therefore indicates that the eight safety practice aspects were measuring the safety practice relationship in the UK shipping industry. To sum up, this section aimed to assess the reliability of 10 safety practice aspects in measuring safety practice in the UK shipping industry. The assessment was accomplished with Cronbach‘s alpha test. The results from the Cronbach‘s alpha test indicate that the questions from working environment satisfaction and reporting culture was not a good measure of safety practice. Therefore, the items were removed. Other questions such as Safety7 and Imp4 were also had low correlation; however, the items were not removed because its removal would not significantly improve the overall measurement scale. Nevertheless, the overall alpha scale (α= 0.9879) is above
minimum of 0.70, which indicates that the eight remaining safety practice aspects were a reliable measure of safety practice. This means that the questions for the eight safety practice aspects can be used to assess the measurement of the relationship among the safety practice aspects in the UK shipping industry.
4.2. Cluster analysis
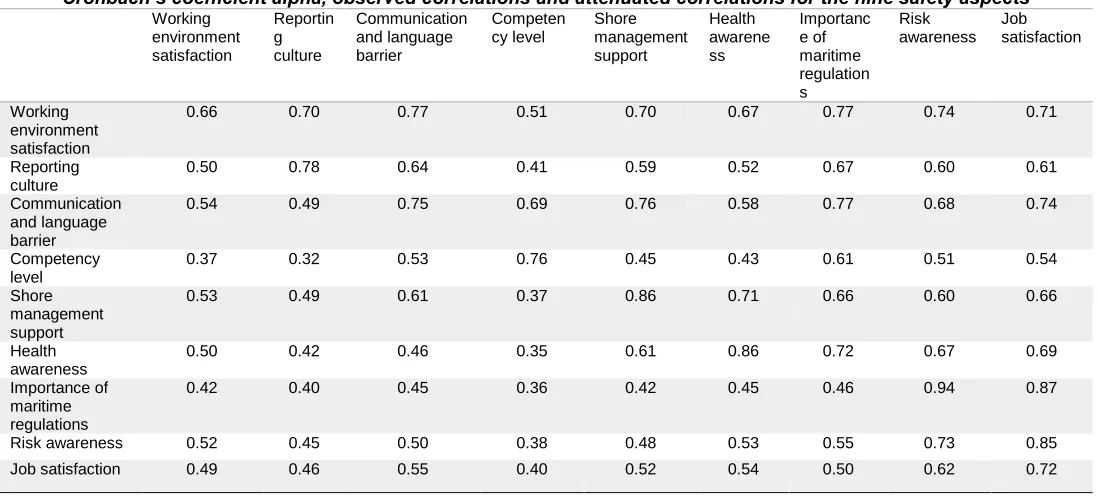
4.2.1. Cronbach’s coefficient alpha, observed correlations and attenuated correlations
The Cronbach‘s coefficient alpha values high compared to the common cut-off value which is 0.6 [45] underlining that these nine aspects are related and measuring the same aspects. To ensure a high degree of internal consistency, the values of Cronbach‘s alpha should be significantly larger than the correlations between aspects corrected for attenuation. The results presented in Table 2 highlight a high degree of internal consistency, as the values of Cronbach‘s alpha are fairly larger than the correlations between aspects corrected for attenuation.
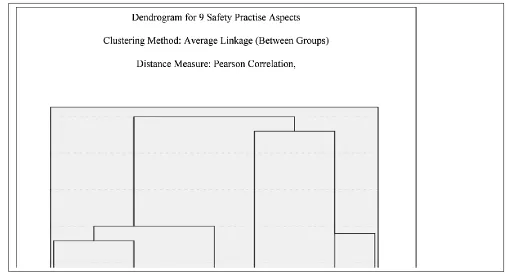
4.1.2. Dendrogram Relationships among ten safety practise aspects
The results from the cluster analysis, in terms of the relationships among the nine safety practice (independent parameters) are presented as a dendrogram in Fig.1. The bars in the graph represent the strenght of the relationship, in which the more related the aspects, the smaller the distance between them.
Based on Fig.1, two clusters of safety aspects were formed . The details of the clusters are as follows:
1. First cluster: risk awareness, competency level, job satisfaction and shore management support.
2. Second Cluster: reporting culture, importance of maritime regulations, health awareness, communication and language barrier, and working environment satisfaction.
In the first cluster, job satisfaction and shore management support are closely related based on the perception of the seafarers. This shows that the shore management is giving nescessary support to the seafarers the job satisfaction is also higher. This finding is consistent with previous studies. For example, according to Newman et al. [46], the findings over the last decades suggest that there is a connection between organisational effectivess from the management perspetives and desired work outcome. Slišković and Penezić [47] who studied job satisfaction in a sample of Croatian seafarers, found that most seafarers listed good company management and equal treatment as a special source of satisfaction. A continuous support and appreciation from the management and the willingness to accept the opinions of the personnel would give a positive impact in work progress. The management role is therefore vital to motivate the seafarers to work efficiently. According to the seafarers‘, risk awareness and competency level are also closely related in the first cluster. This shows that when seafarers get sufficient training and skills, then this will enhances their risk awareness. Most of the respondents considered that
460 Based on the seafarers‘ perception, working environment
satisfaction and health awareness aspects are also closely related in the second cluster. This indicates that most seafarers that took part in the survey are working in a safe environment under the management that always particular about their employee‘s health which includes mental and physical. A good working environment will enhance the seafarers‘s productivity and emotions as most of them are from different nationalities that work thousands of miles away from families and are very pontential to be affected by stress or isolation. This finding relates to the study by Knutsson [52] where he has also identified an association between the work environment and health awareness. They have stated that poor work environment could lead to health disorders such as depression and mood disorders. Therefore, maintaining a good working environment should be a priority in all companies and on-board ships to promote safety and health awareness. Reporting culture and competency level are not closely related in the seafarers‘ perception. Competency level, which is determined by sufficient training and skills, is crucial to emphasise the importance of reporting and to implement corrective actions appropriately. However, the result shows that the seafarers are not fully aware of the importance of the practice of reporting of incidents. In addition to that, reporting culture is also not closely related with shore management support based on the seafarers‘ perception. Interestingly, the result is very contrasting. Apparently, a continuous management support should encourage the seafarers to report incidents. It can be speculated that these results indicate that the respondents distinguish between the reporting of incidents on board and the quality of management support they receive. The lack of connection could be considered as a potential safety problem because the poor reporting culture will prevent the shipping companies from learning from past incidents and implement changes. Therefore, the management should play the role effectively by providing sufficient support and trainings to their employees. The aspect of communication and language barrier and importance of maritime regulation were not closely related according to the seafarers‘ point of view. Such relationship may be formed due to the result of poor understanding and implementation of regulations. It may also suggest that in the mind of the seafarer‘s the international character of maritime regulation would have an effect even where there were communication problems on board. However, because the maritime regulations themselves require the establishment of good communication on board the latter assumption can not be supported. For example, the STWC [53] convention states that the administrations should give priorities to communication and language skills in maintaining safety of life and property at sea and also in preventing pollution. Therefore, it is necessary for shipping companies to give more attention to issues related to communication by providing relevant traning and education to their employees‘. According to the seafarers‘, importance of maritime regulations and risk awareness aspects were not closely associated as they belong to different clusters. It is very interesting because in this case both variables would reasonably be expected to increase or decrease together as both the variables have influence on each other. This result indicates that the seafarers do not make the link
in this study, only two dendrograms have formed two clusters and one formed three clusters. As our analysis indicates three clusters when the years of experience are taken into account and discrepancy could be due to the age of participants but also to other demographic differences (companies, nationalities, age and number of respondents) not explored on either of the two studies.
4.2 Multiple Linear Regression analysis
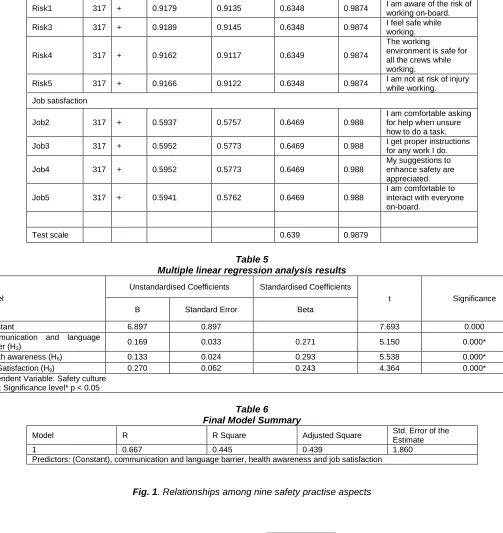
This study examines whether, in the mind of the seafarers, the nine safety aspects (independent variables) are linearly correlated with safety practice. The level of significance (p-value) was set to p < 0.05. A low p-value (< 0.05) indicates that the null hypothesis can be rejected [54]. Therefore, the multiple regression enables the identification of independent variables that influencing safety practice. A multiple regression model involving all the variables included. The model was rebuilt by an iterating process removing at each step a variable that was not statistically significant at the chosen level of p-value (<0.05). Table 5 summarises the multiple regression analysis results. The tables have five columns with aspects such as model (independent variables), unstandardised coefficients, standardised coefficients, t-value and significance. The unstandardised coefficient represents an average change in the dependent variable associated with a one-unit change in the dependent variable keeping the independent variables constant [55]. A standardised coefficient compares the strength of the effect of each individual independent variable to the dependent variable [55]. This means the higher the value of standardised coefficient (beta), the stronger the effect. The t-value is a standardised value that is calculated from sample data using t-test. T-test is a measure used to compare a sample mean to a hypothesised value during a hypothesis test [55]. The significance value or know as p-value is used to determine statistical significance in a hypothesis. Based on Table 5, three independent variables (communication and language barrier, health awareness and job satisfaction) are enough to describe the maximum amount of variance in safety culture. In addition to that, the positive beta coefficient (B) values of the three independent variables also shows the degree of relationship to the dependent variable. The Beta coefficient (B) is an aspect that compares the strength of the effect of each individual independent variable to the dependent variable [55]. It is also the degree of change (or rapidity or steepness) in the outcome for every 1-unit of change in the independent variable [55]. In other words, the B value represents the slope of the line between the independent variable and the dependent variable. These findings are supported by Ek et al. [34], who examined the relationships among safety culture aspects, particularly communication and reporting aspects where these aspects promote openness and insights about safety culture and performance among the crew. Studies have also shown that risk awareness may influence safety and attitudes towards safety [34]. Slišković and Penezić [56] have claimed that work-related stressors such as demands of job, relationships at work and change management could increase the risk of health issues among seafarers, where it may affect the safety culture. Table 6 present the final model of the analysis for safety practice aspects, built on the minimum number of safety practice parameters that can
account for the perception of safety culture held by the seafarers. The table has five columns such as model, R-value, R-square, adjusted square and standard error of the estimate. The R-value represents the correlation coefficient and R-square is a statistical measure used to determine how close the data are to the fitted regression line [55]. In other words, it is the percentage of the response variable variation that is explained by a linear model. The adjusted square is a modified version of R-square that has been adjusted for the number of independent variable in the model [55]. The adjusted square will only increase if the removal of insignificant variables improves the model. The standard error of the estimate is a measure of the accuracy of predictions made with a regression line [55]. In other words, the smaller the standard error of the estimate is, the more accurate the predictions are. In this study, the coefficient of multiple determination, R2, gives the proportion of the variation in the safety culture explained by the independent variables in the model. R2 is a statistical aspect that is used to measure how close the data are to the fitted regression line. The table shows that, when the five independent variables are fitted to the safety culture variable, the value of the adjusted R2 is 0.445, suggesting the complete model was predictive for safety culture for safety practice in the UK shipping industry. This means that, close to 50% of the variation in safety culture data as perceived by the seafarers are explained by the independent variables listed in the table. This confirms that the independent variables have significant effect on safety culture.
5.
CONCLUSION
462 Hierarchical Cluster analysis the relationships among the
nine safety aspects (independent variables) have been well portrayed based on their internal consistency. This analysis was useful to identify safety aspects that are closely related by the cluster formation to explore their connection to be related to the safety culture in shipping industry. Experience and additional training does change the perception seafarers have on safety aspects as the comparison between the perceptions of longer serving seafarers to those with less experience indicates. The only similarity was both groups shows a relationship between health awareness and communication and language barrier and working environment satisfaction. The findings from multiple regression analysis have identified the variables that have close relationship with dependent variable (safety culture) based on seafarer‘s perception. For all seafarers; communication and language barrier, health awareness and job satisfaction aspects are the primary aspects that influence the safety culture. Measuring safety culture among seafarers from their point of view can provide the management of shipping companies and stakeholders to measure and view the problems and threats in the industry in order to improve the safety culture. Identifying areas where the perception does not reflect the expected linkage is indicative of inefficient training or understanding of the linkage between the various aspects of safety. This suggests that such questionnaire data can be used to monitor safety development and improvement over time to further enhance the appropriate changes. Making the effort on safety more visible could motivate the seafarers in the continuous process of improving safety.
ACKNOWLEDGEMENT
The research project leading to these results has received funding from the Universiti Malaysia Terengganu. The authors would like to acknowledge the assistance of all respondents of the survey for their time and help.
REFERENCES
[1] Akten, N. (2006) Shipping Accidents: A Serious Threat For Marine Environment. Journal of Black Sea/Mediterranean Environment, 12 (3).
[2] Rothblum, A.M. (2000) Human Error And Marine Safety. National Safety Council Congress and Expo, Orlando, FL.
[3] Imo (1998b) SOLAS: The International Convention For The Safety Of Life At Sea, 1974. Available from: http://www.imo.org/en/OurWork/Safety/Regulations/Do cuments/SOLAS98final.pdf [Accessed 27 April 2017]. [4] Tzannatos, E. (2010) Human Element And Accidents In
Greek Shipping. Journal of Navigation, 63 (01), 119-127.
[5] Tzannatos, E. and Kokotos, D. (2009) Analysis Of Accidents In Greek Shipping During The Pre-And Post-ISM Period. Marine Policy, 33 (4), 679-684. [6] Allianz (2015) Safety And Shipping Review 2015.
Available from:
https://www.allianz.com/v_1427190309000/media/pres s/document/other/Shipping-Review-2015.pdf
[Accessed 23 May 2016].
[7] Health and Commission, S. (1993) Organizing For Safety: Third Report Of The Human Factors Study Group Of ACSNI. Sudbury, UK: HSE Books.
[8] Human Engineering (2005) A Review Of Safety Culture And Safety Climate Literature For The Development Of The Safety Culture Inspection Toolkit. Executive,
H.A.S. Available from:
http://www.hse.gov.uk/research/rrpdf/rr367.pdf [Accessed 26 April 2017].
[9] Oltedal, H.A. (2011) Safety Culture And Safety Management Within The Norwegian-Controlled Shipping Industry. State of art, Interrelationships and Influencing Factors‖, University of Stavanger, Doctor of Philosophy, 26.
[10] Oswald, A. (2012) The Effect Of Working Environment On Workers Performance: The Case Of Reproductive And Child Health Care Providers In Tarime District, Muhimbili University of Health and Allied Sciences. [11] Ek, A. (2006) Safety Culture In Sea And Aviation
Transport, PhD, Lund University. Available from: http://lup.lub.lu.se/search/ws/files/4508145/546921.pdf [Accessed 12 December 2016]
[12] Nielsen, M.B., Bergheim, K. and Eid, J. (2013) Relationships Between Work Environment Factors And Workers‘ Well-Being In The Maritime Industry. Int Marit Health, 64 (2), 80-88.
[13] Skalli, A., Theodossiou, I. and Vasileiou, E. (2008) Jobs As Lancaster Goods: Facets Of Job Satisfaction And Overall Job Satisfaction. The Journal of Socio-Economics, 37 (5), 1906-1920.
[14] Storgård, J., Erdogan, I. and Tapaninen, U. (2012) Indicent Reporting In Shipping. Experiences and best practices for the Baltic Sea.
[15] Revised ISM Code (2015) International Management Code For The Safe Operation Of Ships And For Pollution Prevention (International Safety Management
(ISM) Code). Available from:
https://assets.publishing.service.gov.uk/government/up loads/system/uploads/attachment_data/file/508080/IS M_I2S_Feb_2015_Updated_150316.pdf [Accessed 19 June 2018].
[16] Holt, A.S.J. (2008) Principles Of Construction Safety. John Wiley & Sons.
[17] Squire, D. (2005) The Human
Element In Shipping. Available from: http://www.he-alert.org/filemanager/root/site_assets/standalone_pdfs _0355-/he00350.pdf [Accessed 12 December 2016]. [18] O'toole, M. (2002) The Relationship Between
Employees' Perceptions Of Safety And Organizational Culture. Journal of safety research, 33 (2), 231-243. [19] Ladki, S.M., Mikdashi, T. and Dah, A. (1998) Health
Awareness And Life-Style Practices Of Foodservice Employees. Journal of the International Academy of Hospitality Research logo, (11).
[20] Josten, E.J. and Thierry, H. (2003) The Effects Of Extended Workdays On Fatigue, Health, Performance And Satisfaction In Nursing. Journal of advanced nursing, 44 (6), 643-652.
[21] Zakaria, M. (2009) Health And Safe Shipping. Seaways.
Available from:
http://www.nautinst.org/filemanager/root/site_assets/fo rums/fatigue_forum/health_and_safe_shipping_-_mohammed_zakaria.pdf [Accessed 9 February 2017]. [22] Schein, E.H. (2010) Organizational Culture And
[23] Birkett, H. (2017) What Is Safety Culture? UK Chamber
of Shipping. Available from:
https://www.ukchamberofshipping.com/latest/what-safety-culture/ [Accessed 30 July 2019].
[24] Baram, M.S., Lindøe, P., Lindoe, P., Baram, M. and Renn, O. (2013) Modes Of Risk Regulation For Prevention Of Major Industrial Accidents. Risk Governance Of Offshore Oil And Gas Operations, 34-55.
[25] Størkersen, K.V. (2015) Survival Versus Safety At Sea. Regulators‘ Portrayal Of Paralysis In Safety Regulation Development. Safety science, 75, 90-99.
[26] Imo, SI 2013/. Available from: http://www.imo.org/OurWork/HumanElement/SafetyCu lture/Pages/Default.aspx [Accessed 19 April 2017]. [27] Grabowski, M., Ayyalasomayajula,
P., Merrick, J. and Mccafferty, D. (2007) Accident Precursors And Safety Nets: Leading Indicators Of Tanker Operations Safety. Maritime Policy & Management, 34 (5), 405-425.
[28] Rundmo, T. (1997) Associations Between Risk Perception And Safety. Occupational Health and Industrial Medicine, 2 (37), 53.
[29] Pushpakumari, M. (2008) The impact Of Job Satisfaction On Job Performance: An Empirical Analysis City Forum. 89-105.
[30] Hu, H.-H., Zhao, J. and Carter, C. (2003) Employee Job Satisfaction In Major Cruise Lines. Hospitality Review, 21 (1), 2.
[31] Leedy, P.D. and Ormrod, J.E. (2005) Practical Research. Pearson Custom.
[32] Burgess, T.F. (2001) Guide to the Design of Questionnaires. A General Introduction To The Design Of Questionnaires For Survey Research.
[33] Uos, SI 2012/. University Of Southampton (UoS): University Of Southampton (UoS). Available from: http://www.southampton.ac.uk/about/governance/polici es/ethics.page.
[34] Ek, Å., Runefors, M. and Borell, J. (2014) Relationships Between Safety Culture Aspects–A Work Process To Enable Interpretation. Marine Policy, 44, 179-186. [35] Zohar, D. (1980) Safety Climate In Industrial
Organizations: Theoretical And Applied Implications. Journal of applied psychology, 65 (1), 96.
[36] Havold, J.I. (2000) Culture In Maritime Safety. Maritime Policy & Management, 27 (1), 79-88.
[37] Chatfield, C. (1983) Statistics For Technology: A Course In Applied Statistics. CRC Press.
[38] Creswell, J.W. and Clark, V.L.P. (2007) Designing And Conducting Mixed Methods Research.
[39] Rosenthal, R. and Rosnow, R.L. (1991) Essentials Of Behavioral Research: Methods And Data Analysis. McGraw-Hill Humanities Social.
[40] Coniam, D. and Falvey, P. (2000) The Relevance And Applicability Of Cloze In English Language Benchmarking In Hong Kong. New Horizons in Education, 42 (11), 1-10.
[41] Tavakol, M. and Dennick, R. (2011) Making Sense Of Cronbach's Alpha. International journal of medical education, 2, 53.
[42] Sarstedt, M. and Mooi, E. (2014) A Concise Guide To Market Research. The Process, Data, and Methods Using IBM SPSS STatistics.
[43] Schmitt, N. (1996) Uses And Abuses Of Coefficient Alpha. Psychological assessment, 8 (4), 350.
[44] Marija, J. (2003) SPSS 12.0 Statistical Procedures Companion. Prentice Hall.
[45] Hair, J.F., Black, W.C., Babin, B.J., Anderson, R.E. and Tatham, R.L. (2006) Multivariate Data Analysis. [46] Newman, A., Ucbasaran, D., Zhu, F. and Hirst, G.
(2014) Psychological Capital: A Review And Synthesis. Journal of Organizational Behavior, 35 (S1), S120-S138.
[47] Slišković, A. and Penezić, Z. (2015a) Descriptive Study Of Job Satisfaction And Job Dissatisfaction In A Sample Of Croatian Seafarers. Int Marit Health, 66 (2), 97-105.
[48] Rundmo, T., Nordfjærn, T., Iversen, H.H., Oltedal, S. and Jørgensen, S.H. (2011) The Role Of Risk Perception And Other Risk-Related Judgements In Transportation Mode Use. Safety science, 49 (2), 226-235.
[49] European Marine Energy Centre, E. (2008) Guidelines For Health And Safety In The Marine Energy Industry.
(Emec), E.M.E.C. Available from:
http://www.google.co.uk/url?sa=t&rct=j&q=&esrc=s&so urce=web&cd=2&cad=rja&uact=8&ved=0ahUKEwjy1d
vdp-7YAhUOM8AKHQFDDQIQFggtMAE&url=http%3A%2 F%2Fwww.emec.org.uk%2F%3Fwpfb_dl%3D38&usg =AOvVaw2IypMH1mWZwhA9d8SyNL1h [Accessed 23 January 2018].
[50] Rydstedt, L.W. and Lundh, M. (2010) An Ocean Of Stress? The Relationship Between Psychosocial Workload And Mental Strain Among Engine Officers In The Swedish Merchant Fleet. Int Marit Health, 62 (3), 168-175.
[51] Mearns, K., Whitaker, S.M. and Flin, R. (2003) Safety Climate, Safety Management Practice And Safety Performance In Offshore Environments. Safety science, 41 (8), 641-680.
[52] Knutsson, A. (2003) Health Disorders Of Shift Workers. Occupational medicine, 53 (2), 103-108.
[53] Stcw (2010) STCW A Guide For Seafarers. Available from:
http://www.mptusa.com/pdf/STCW_guide_english.pdf [Accessed 16 March 2017].
[54] Tranmer, M. and Elliot, M. (2008) Multiple linear regression. The Cathie Marsh Centre for Census and Survey Research (CCSR).
[55] Cohen, J., Cohen, P., West, S.G. and Aiken, L.S. (2013) Applied Multiple Regression/Correlation Analysis For The Behavioral sciences. Routledge.
[56] Slišković, A. and Penezić, Z. (2015b) Occupational Stressors, Risks And Health In The Seafaring Population. Review of Psychology, 22 (1-2), 29-40.
466
Table 1
Summary Statistics
Sections Cronbach‘s Alpha, ( ) Item – Total Correlations,
Working Environment Satisfaction 0.651 >0.2
Reporting Culture 0.759 >0.4
Communication and Language Barrier 0.740 >0.3
Competency Level 0.813 >0.5
Shore Management Support 0.688 >0.2
Health Awareness 0.827 >0.2
Safety culture 0.650 >0.2
Importance of Maritime Regulations 0.770 >0.4
Risk Awareness 0.676 >0.2
Job Satisfaction 0.798 >0.4
Table 2
Cronbach’s coefficient alpha, observed correlations and attenuated correlations for the nine safety aspects
Working
environment satisfaction
Reportin g culture
Communication and language barrier
Competen cy level
Shore management support
Health awarene ss
Importanc e of maritime regulation s
Risk awareness
Job satisfaction
Working environment satisfaction
0.66 0.70 0.77 0.51 0.70 0.67 0.77 0.74 0.71
Reporting culture
0.50 0.78 0.64 0.41 0.59 0.52 0.67 0.60 0.61
Communication and language barrier
0.54 0.49 0.75 0.69 0.76 0.58 0.77 0.68 0.74
Competency level
0.37 0.32 0.53 0.76 0.45 0.43 0.61 0.51 0.54
Shore management support
0.53 0.49 0.61 0.37 0.86 0.71 0.66 0.60 0.66
Health awareness
0.50 0.42 0.46 0.35 0.61 0.86 0.72 0.67 0.69
Importance of maritime regulations
0.42 0.40 0.45 0.36 0.42 0.45 0.46 0.94 0.87
Risk awareness 0.52 0.45 0.50 0.38 0.48 0.53 0.55 0.73 0.85
Job satisfaction 0.49 0.46 0.55 0.40 0.52 0.54 0.50 0.62 0.72
*Cronbach‘s coefficient alpha values are presented in bold and in the diagonal, observed correlations between safety aspects are below the diagonal and correlations corrected for attenuation are above diagonal
Table 3
Reliability test results for survey instrument (Factor Analysis)
Safety Practice Aspects
Obs Sign item-test correlation
item-rest correlation
average interitem correlation
alpha Item lable
Working environment satisfaction
W1 317 + 0.103 0.0765 0.4682 0.9794
The working
environment on-board is very friendly.
W4 317 + 0.1086 0.0821 0.4681 0.9794
The working environment is organized.
W5 316 + 0.1029 0.0764 0.4682 0.9794 I feel safe working here.
W6 317 + 0.0921 0.0655 0.4685 0.9794 Working procedures are
clear and well written. W7 317 + 0.0404 0.0137 0.4698 0.9795 My work is appreciated by the company.
R5 317 + 0.0607 0.0341 0.4693 0.9795 Reports are always taken seriously.
R6 317 - 0.0146 -0.0121 0.4705 0.9796
I report if I accidentally damage equipment on-board.
R8 317 - 0.035 0.0083 0.47 0.9795
Previous reports are useful for up-coming voyages.
R9 317 - 0.0412 0.0145 0.4698 0.9795 I learn much from past
reports. Communication and language barrier
com2 317 + 0.8967 0.8913 0.4474 0.9776 All the instructions are easily understood.
com3 317 + 0.8978 0.8924 0.4474 0.9776
I have received sufficient training on how to communicate in emergency situations. com4 317 + 0.6525 0.6367 0.4538 0.9782 It is easy to talk with
team members. com5 317 + 0.6448 0.6287 0.454 0.9782 It is easy to talk with the
Master and Officers.
com6 317 + 0.6444 0.6284 0.454 0.9782
I can deliver any messages/ideas/instruct ions clearly.
com7 317 + 0.7056 0.6918 0.4524 0.9781
Language differences in multi-cultural crews are not a threat to safety.
com8 317 + 0.8977 0.8923 0.4474 0.9776
There is good communication on this ship about safety issues.
Competency Level
competency1 317 + 0.8986 0.8933 0.4474 0.9776 I have good knowledge about my job.
competency2 317 + 0.8982 0.8928 0.4474 0.9776 I have received the appropriate education.
competency3 317 + 0.8975 0.8921 0.4474 0.9776
I have received the training necessary to work safely on this ship.
competency4 317 + 0.897 0.8916 0.4474 0.9776
The training I have undertaken is relevant in practice.
competency5 317 + 0.8971 0.8917 0.4474 0.9776
The training and education I have received are essential for me to work effectively. Shore management support
shore1 317 + 0.8987 0.8934 0.4474 0.9776
The company management staff are friendly.
shore2 317 + 0.8987 0.8934 0.4474 0.9776
Management support the employees to perform well.
shore3 317 + 0.7093 0.6956 0.4523 0.9781
Management do not put pressure on the employees to achieve targets.
shore4 317 + 0.5896 0.5718 0.4555 0.9783
I do not experience conflicts with my employers.
shore5 317 + 0.7095 0.6959 0.4523 0.9781
Management staff regularly give
importance to problems raised by employees. shore6 317 + 0.5169 0.4969 0.4574 0.9785 Management is working
for good safety.
shore7 317 + 0.5757 0.5574 0.4558 0.9784
Management never put schedule or cost above safety.
468 health1 317 + 0.8886 0.8828 0.4477 0.9777 I am getting enough
sleep.
health2 317 + 0.9 0.8948 0.4474 0.9776 I am getting enough
rest hours.
health3 317 + 0.9005 0.8953 0.4473 0.9776
The company cares about my health and safety.
health4 317 + 0.9155 0.911 0.4469 0.9776
Suggestions to improve health and safety are welcomed.
health5 317 + 0.9147 0.9102 0.447 0.9776
I fully understand and am aware of my responsibilities for health and safety.
health6 317 + 0.9147 0.9102 0.447 0.9776 Management
encourages safe work.
health7 317 + 0.9133 0.9087 0.447 0.9776
The crew is not encouraged to put health issues in second place to achieve a target.
health9 317 + 0.7553 0.7435 0.4511 0.978
The crew is expected to follow the work/rest cycle.
health10 317 + 0.9137 0.9091 0.447 0.9776 I have time to do my work.
Safety Culture
safety4 317 + 0.9147 0.9101 0.447 0.9776 The safety training on-board is sufficient. safety5 317 + 0.9109 0.9061 0.4471 0.9776 Fire drills are performed frequently.
safety6 317 + 0.9153 0.9108 0.447 0.9776
My co-workers do not pressure me to take shortcuts in my work. safety7 317 + 0.3961 0.3732 0.4605 0.9788 I am familiar with the
on-board safety goals.
safety8 317 + 0.9157 0.9112 0.4469 0.9776
Crews have adequate training in emergency procedures.
Importance of maritime regulations
Imp2 317 + 0.9169 0.9125 0.4469 0.9776
This company follows all the regulations for the safety of the company and employees.
Imp3 317 + 0.8664 0.8595 0.4482 0.9777
This company follows the regulations effectively.
Imp4 317 + 0.3953 0.3724 0.4606 0.9788
I am aware the importance of maritime regulations.
Imp5 317 + 0.9151 0.9106 0.447 0.9776
I understand the consequences in the absence of safety regulations.
Imp6 317 + 0.913 0.9084 0.447 0.9776
All the employees are well exposed to the regulations. Risk awareness
Risk1 317 + 0.9142 0.9096 0.447 0.9776 I am aware of the risk of working on-board. Risk3 317 + 0.9173 0.9129 0.4469 0.9776 I feel safe while
working.
Risk4 317 + 0.9144 0.9099 0.447 0.9776
The working
environment is safe for all the crews while working.
Risk5 317 + 0.9159 0.9114 0.4469 0.9776 I am not at risk of injury while working. Job satisfaction
for help when unsure how to do a task. Job3 317 + 0.5911 0.5733 0.4554 0.9783 I get proper instructions
for any work I do.
Job4 317 + 0.5919 0.5742 0.4554 0.9783
My suggestions to enhance safety are appreciated.
Job5 317 + 0.5901 0.5723 0.4555 0.9783
I am comfortable to interact with everyone on-board.
Test scale 0.4531 0.9785
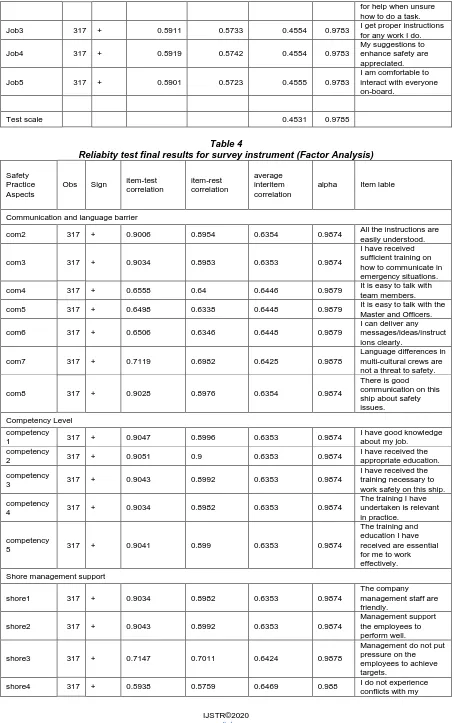
Table 4
Reliabity test final results for survey instrument (Factor Analysis)
Safety Practice Aspects
Obs Sign item-test correlation
item-rest correlation
average interitem correlation
alpha Item lable
Communication and language barrier
com2 317 + 0.9006 0.8954 0.6354 0.9874 All the instructions are easily understood.
com3 317 + 0.9034 0.8983 0.6353 0.9874
I have received sufficient training on how to communicate in emergency situations. com4 317 + 0.6558 0.64 0.6446 0.9879 It is easy to talk with
team members. com5 317 + 0.6498 0.6338 0.6448 0.9879 It is easy to talk with the
Master and Officers.
com6 317 + 0.6506 0.6346 0.6448 0.9879
I can deliver any messages/ideas/instruct ions clearly.
com7 317 + 0.7119 0.6982 0.6425 0.9878
Language differences in multi-cultural crews are not a threat to safety.
com8 317 + 0.9028 0.8976 0.6354 0.9874
There is good communication on this ship about safety issues.
Competency Level competency
1 317 + 0.9047 0.8996 0.6353 0.9874
I have good knowledge about my job.
competency
2 317 + 0.9051 0.9 0.6353 0.9874
I have received the appropriate education. competency
3 317 + 0.9043 0.8992 0.6353 0.9874
I have received the training necessary to work safely on this ship. competency
4 317 + 0.9034 0.8982 0.6353 0.9874
The training I have undertaken is relevant in practice.
competency
5 317 + 0.9041 0.899 0.6353 0.9874
The training and education I have received are essential for me to work effectively. Shore management support
shore1 317 + 0.9034 0.8982 0.6353 0.9874
The company management staff are friendly.
shore2 317 + 0.9043 0.8992 0.6353 0.9874
Management support the employees to perform well.
shore3 317 + 0.7147 0.7011 0.6424 0.9878
Management do not put pressure on the employees to achieve targets.
470 employers.
shore5 317 + 0.715 0.7014 0.6424 0.9878
Management staff regularly give
importance to problems raised by employees. shore6 317 + 0.5167 0.4965 0.6498 0.9882 Management is working
for good safety.
shore7 317 + 0.5881 0.57 0.6471 0.988
Management never put schedule or cost above safety.
Health awareness
health1 317 + 0.8911 0.8854 0.6358 0.9874 I am getting enough sleep.
health2 317 + 0.9025 0.8973 0.6354 0.9874 I am getting enough rest hours.
health3 317 + 0.9048 0.8997 0.6353 0.9874
The company cares about my health and safety.
health4 317 + 0.9182 0.9138 0.6348 0.9874
Suggestions to improve health and safety are welcomed.
health5 317 + 0.9181 0.9137 0.6348 0.9874
I fully understand and am aware of my responsibilities for health and safety.
health6 317 + 0.9181 0.9137 0.6348 0.9874 Management
encourages safe work.
health7 317 + 0.9168 0.9123 0.6348 0.9874
The crew is not encouraged to put health issues in second place to achieve a target.
health9 317 + 0.7583 0.7465 0.6408 0.9877
The crew is expected to follow the work/rest cycle.
health10 317 + 0.9157 0.9112 0.6349 0.9874 I have time to do my work.
Safety Culture
safety4 317 + 0.9177 0.9133 0.6348 0.9874 The safety training on-board is sufficient. safety5 317 + 0.9142 0.9096 0.6349 0.9874 Fire drills are performed frequently.
safety6 317 + 0.9177 0.9133 0.6348 0.9874
My co-workers do not pressure me to take shortcuts in my work. safety7 317 + 0.393 0.3698 0.6544 0.9884 I am familiar with the
on-board safety goals.
safety8 317 + 0.9186 0.9143 0.6348 0.9874
Crews have adequate training in emergency procedures.
Importance of maritime regulations
Imp2 317 + 0.9192 0.9149 0.6348 0.9874
This company follows all the regulations for the safety of the company and employees.
Imp3 317 + 0.8662 0.8592 0.6367 0.9875
This company follows the regulations effectively.
Imp4 317 + 0.3919 0.3687 0.6545 0.9884
I am aware the importance of maritime regulations.
Imp5 317 + 0.9189 0.9146 0.6348 0.9874
I understand the consequences in the absence of safety regulations.
Imp6 317 + 0.9162 0.9117 0.6349 0.9874
Risk1 317 + 0.9179 0.9135 0.6348 0.9874 I am aware of the risk of working on-board. Risk3 317 + 0.9189 0.9145 0.6348 0.9874 I feel safe while
working.
Risk4 317 + 0.9162 0.9117 0.6349 0.9874
The working
environment is safe for all the crews while working.
Risk5 317 + 0.9166 0.9122 0.6348 0.9874 I am not at risk of injury while working. Job satisfaction
Job2 317 + 0.5937 0.5757 0.6469 0.988
I am comfortable asking for help when unsure how to do a task. Job3 317 + 0.5952 0.5773 0.6469 0.988 I get proper instructions
for any work I do.
Job4 317 + 0.5952 0.5773 0.6469 0.988
My suggestions to enhance safety are appreciated.
Job5 317 + 0.5941 0.5762 0.6469 0.988
I am comfortable to interact with everyone on-board.
Test scale 0.639 0.9879
Table 5
Multiple linear regression analysis results
Model
Unstandardised Coefficients Standardised Coefficients
t Significance
B Standard Error Beta
Constant 6.897 0.897 7.693 0.000
Communication and language
barrier (H3) 0.169 0.033 0.271 5.150 0.000*
Health awareness (H6) 0.133 0.024 0.293 5.538 0.000*
Job Satisfaction (H9) 0.270 0.062 0.243 4.364 0.000*
Dependent Variable: Safety culture Note: Significance level* p < 0.05
Table 6 Final Model Summary
Model R R Square Adjusted Square Std. Error of the
Estimate
1 0.667 0.445 0.439 1.860
Predictors: (Constant), communication and language barrier, health awareness and job satisfaction
Fig. 1. Relationships among nine safety practise aspects
472
Fig. 2. Perception of seafarers with above ten years of working experience