United Kingdom Vol. IV, Issue 12, December 2016
Licensed under Creative Common Page 423
http://ijecm.co.uk/
ISSN 2348 0386
STUDY THE EFFECT OF LIQUIDITY OF STOCK ON
STOCK RETURNS IN THE COMPANIES LISTED
IN TEHRAN STOCK EXCHANGE
Hamid Reza Shammakhi
Faculty Member of Islamic Azad University, Islamshahr Branch, Iran
Azita Mehrabi
MA Student of Islamic Azad University, Electronic Faculty, Iran azitamehrabi@gmail.com
Abstract
One of the key issues in investment is assets liquidity for investors choosing investment options
not only consider risk and efficiency, but also liquidity. Benchmark of stock liquidity is among
information that several studies have used to predict stock returns. The impact of this property
of the securities on capital market variables has been the subject of many financial researches.
The aim of this study was to investigate the relationship between liquidity and stock returns of
companies listed in Tehran Stock Exchange. In terms of the purpose, this was an applied
research and as for the method, this research was a descriptive – correlation one. Statistical
population comprised all companies listed on the Tehran Stock Exchange; thus using
systematic sampling and compliance with study inclusion criteria, 89 companies qualified for a
period of 5 years were selected as sample. To test the hypothesis, statistical methods combined
data statistical methods were applied using Eviews software. The results of the data analysis
and test of research hypotheses showed that there is a significant positive relationship between
both main dimensions of liquidity, i.e., the number of shares in circulation and the relative price
gap and stock returns of companies listed in Tehran stock exchange. Also, regardless of ratio of
book value to market value in the first hypothesis, there is a significant positive correlation
between stock returns and control variables of corporate size and financial leverage and in the
second hypothesis, between the control variable of book value to the market value ratio,
Licensed under Creative Common Page 424
factor in stock returns, it is recommended that investors consider liquidity in their investment
decisions as an important variable in explaining stock returns. The research can be used by
investment managers and other stakeholders in market.
Keywords: Stock liquidity, Return on equity, Risk and return, Stock exchange, Iran
INTRODUCTION
There are different tools for investment in each financial market based on the scope and depth of the market. Investors select their desired assets based on risk and return of investment. The rate of liquidity of asset is one of the main issues in investment. Liquidity is one the desired features of competitive markets and is defined as performing the transactions quickly with minimal cost and without the influence on price and determinant of market’s survival (Weiss, 2004). Liquidity plays an important role in the valuation of assets. When, investors want to sell their assets, this question is raised if there is a suitable market for them or not? Lower liquidity or a share decrease the appeal of that share for investors; unless higher return is obtained by the owner. liquidity is a function of ability to perform transactions quickly with high volume of securities and low cost. This means that, price of asset in the period between the order to purchase is not changed. The degree of liquidity is low, when the fair cost is not reduced quickly. The rate of stock liquidity affects the decisions of investors to form an investment portfolio. In other word, rational investors expect higher risk and return for the stock with lower liquidity.
Licensed under Creative Common Page 425 Statement of the Problem
People in their investment seek the items as cash banking. Purchasing a share and impossibility to change to the cash actually reduces the motivation of investment and in other hand, people seek other fields or markets for investment. Totally, the main function of capital market as the same as supply the liquidity for securities caused to form a wide part of economic in the countries by volume of exchange in the capital of market in the developed countries with coherent securities. In addition to high return and risk, the issue of liquidity encourages the investors to purchase a share or reduces their interest to share ownership. Although, investors invest in the stock exchange based on the awareness of available risks, but stock liquidity is one of most important variables concerned to purchase a share (yahyazadeh et al, 2020: 113)
THEORETICAL PRINCIPLES
Chan and Faf (2003) used the effect of liquidity of asset in the Australian market through stock turnover on asset pricing in a sectional form. In their study, they used monthly data and controlling factors such as the ratio of book value, firm size and excess market return. They used sectional regression framework to examine the effect of liquidity (stock turnover criterion) on asset pricing in the Australian Market through monthly data and controlling factors such as the ratio of book value, firm size and excess market return.
Bikrosteen (2003) presented a model to examine liquidity increasing, when bid price and the effect of price on exchange was reduced and turnover rate was increased. The results show that their liquidity is positively and highly correlated to stock return.
First criterion of liquidity is Pasteur criteria (2003) that is based on an inverse relationship between price volatility and flow of order. Second criterion of liquidity is market action that is defined as return to bid price changing of sale and purchase and the last criterion proposed by Amihood is the absolute value of stock returns on euro-denominated trading volume. The result of this empirical study shows that the proposed criteria by Amihood resulted in improving the model of asset pricing and is superior on other liquidity criteria. Liu (2006) using a new criterion in liquidity shows that liquidity is an important resource of risk in CAPM model and Fama and French three-factor model.
Licensed under Creative Common Page 426 History of Study
(Taghavi and Biabani, 2003) defined liquidity as facility to sell and purchase assets. Some of the factors related to stock liquidity include number of shares traded per day, number of traded firms per day, the value of shares traded per day, percent of total transactions to market value, number of buyers and buying repetition.
(Dey, 2005) examined the effect of growth of global markets on liquidity and survey if liquidity is a determinant factor for sectional return of the securities or not. He measures the liquidity by stock turnover of company. Stock turnover is measured by dividing value of shares traded on value of capital market. Dey used compound regression method and concluded that year, size, kind of transaction, order competition and growth rate are the most important determinants of liquidity. He used two-stage least regression method and concluded that investors expect more return in the markets with higher stock turnover.
(Marshal and Yang, 2003) examined the relationship between return and liquidity in New Zealand stock exchange. They used bid and ask price difference of stock, stock turnover and bid price difference of stock depreciation (as criteria of stock liquidity) and concluded that the effect of liquidity in these three indices is not fixed. Also, there are some evidences on increasing the liquidity in the January. Marshal in 2006 examined the relationship between stock return and its liquidity in Australian stock exchange. In his study, he used a new liquidity criteria called “average value of orders”. The results of this study suggested the liquidity as the most important determinants for stock return.
(Amri, Ziani and Lovikel, 2004) examined the effect of liquidity on stock return in Tunisia stock exchange through sectional regression and founded a negative relationship between liquidity and stock return using monthly data from 1998 to 2003.
(Yog Change et al, 2010) examined the effect of liquidity on stock return using new evidences in Japan and founded a significant negative relationship between liquidity and stock return.
(Lee, 2011) examined the global price of liquidity risk based on CAPM model derived by Acharya and Pederson and concluded that market of United State is an important derive for global liquidity risk and pricing of liquidity risk is different across the world based on geographical, economic and political factors. His findings show that systematic aspect of liquidity provides some variations for international portfolio.
Licensed under Creative Common Page 427 commercial law in any of the stock exchanges; and concluded that the difference in currency trading rules affect liquidity significantly over time and across markets.
(Mehrani and Rasaeian, 2009) conducted a study titled “the relationship of different criteria of stock liquidity and annual return of stock in Tehran stock exchange from 2002 to 2007 in 156 companies. Their objective to conduct this study was to examine the relationship between annual return of stock (dependent variable) and liquidity criteria of stock such as bid and ask price difference of stock, stock turnover, Rial volume of transactions, repetition of transactions and percent of days of transactions (independent variable).
The result of hypotheses test indicated no significant relationship between stock return and bid and ask price difference of stock, stock turnover, Rial volume of transactions and repetition of transactions from 2002-2007, but a little significant relationship was observed between annual return of stock and percent of days of transactions.
(Yahyazadeh far et al, 2010) in a study titled “study the relationship between liquidity and stock return in Tehran stock exchange” examined the relationship between stock turnover as criterion of liquidity and stock return in Tehran stock exchange from 2002 to 2008 in 269 companies. The variables of study included stock return (dependent variable), turnover rate (independent variable), firm size and ratio of book value to market value (controlling variables). The results of this study suggested a positive and significant relationship between variable coefficient of stock turnover and stock return. In other word, stock return of companies is increased by increasing turnover rate in Tehran stock exchange.
(Ghaemi and Rahimpour, 2010) examined the effect of earnings quarterly announcements on stock liquidity in 157 companies from 2005-2008. They used spread ratio between supply price and demand price as criteria of market liquidity. The cases studied in this study included market model, extraordinary price of supply and demand and the average price of its accumulated abnormal in the time period 20 days before to 20 days after the announcement and 10 days before to 10 days after the announcement of quarterly earnings. The results of study showed that stock liquidity has not been increased after earning quarterly announcement.
Hypotheses of study
Licensed under Creative Common Page 428 criterion in term of multiplicity in the studies is bid price difference (spread) and stock turnover, Rial value of shares traded, waiting time of transactions, flow ratio etc…. are in next priorities. In this study, spread and stock turnover have been used as criteria of liquidity. Hypotheses of study include: 1-spread affect the stock return. 2-stock turnover affect the stock return.
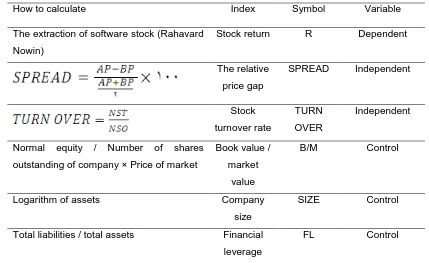
Stock return (dependent variable) is the same return obtained in a period of investment in the stock. Independent variables are the same criteria of liquidity including spread and stock turnover. Spread is obtained by the difference between the lowest bid price and the highest ask price of the stock. Stock turnover is obtained by dividing the volume of the shares traded on number of stock outstanding in a time period. Controlling variables of study include firm size (obtained by natural logarithm of assets), financial leverage (obtained by dividing all assets on total assets) and book value to market value ratio (obtained by dividing normal equity on number of shared outstanding multiplying market value). Estimation method is summarized in Table 1.
Table 1. Introduction and way to calculate the research variables Variable Symbol
Index How to calculate
Dependent R
Stock return The extraction of software stock (Rahavard
Nowin)
Independent SPREAD
The relative price gap
Independent TURN
OVER Stock
turnover rate *100
Control B/M
Book value / market
value Normal equity / Number of shares
outstanding of company × Price of market
Control SIZE
Company size Logarithm of assets
Control FL
Financial leverage Total liabilities / total assets
AP (Ask Price): The average of price proposed of seller BP ( Bid Price): Average of price proposed of buyer Spread: the relative price gap for company I in period t NST(Number of Shares Traded): number of shares traded
Licensed under Creative Common Page 429 Inclusion Criteria
The statistical population of this study included al companies listed in Tehran stock exchange. So, the companies with the inclusion criteria have been selected as sample using systematic sampling:
1. In order to comparability and to avoid heterogeneity, their financial year is ended 29 March, and in the period 2011 to 2015 not have fiscal year change;
2. To choose homogeneous samples, before 2011 in Tehran Stock Exchange is listed and since the beginning of 2011, their shares have been traded;
3. In order to select active companies, trading of these companies during the years 2011 to 2015 in exchange has not been interrupted, in other words, company's shares over the years to be enabled and length of lag not be more than three months;
4. Due to being different of the nature of investment firms, insurance, leasing and banks, this group of companies was removed from sample selected and only companies with manufacturing activity were selected.
Finally, after examining all the companies listed in Tehran Stock Exchange and according to the mentioned properties, 89 companies were eligible that were selected as sample.
ANALYSIS METHOD AND HYPOTHESIS TESTING
This research is applied objectively and in terms of data collecting is descriptive and correlational. For hypothesis testing, regression analysis model by the combined method is used and it is that first Kolmogorov-Smirnov test for investigating normality of variables will be done, and if the test results S-K show that variables of research were normally distributed, then regression analysis can be used. The Durbin-Watson test is used to check for autocorrelation between variables, to collect information related to the theoretical foundations and history of study, study, library method is used, and to collect the financial information, information and figures contained in the Tehran Stock Exchange has been used; Therefore, the information required, the financial reports outstanding of companies, the official website of the Tehran Stock Exchange, and the software of database of Rahavard Nowin is extracted.
Testing hypotheses
Licensed under Creative Common Page 430 Stock liquidity affects stock returns of company and since the liquidity measures are used as a means of measuring the liquidity of the stock, the main hypothesis of the research has become to two secondary hypotheses as follows:
1. The relative price gap has an impact on stock returns of company;
2. The stock turnover rate has an impact on stock returns of company. And as noted, for investigating normalization of data, S-K test is used that its results are presented in Table 2.
Table 2. The results of the S-K test
Financial leverage Company
size Book value /
market value Stock turnover rate The relative price gap Stock return Variable 0.456 0.459 0.479 0.054 0.059 0.094 Significant level Normal Normal Normal Normal Normal Normal Result
The first hypothesis test
According to the entry control variables, the regression equation for this hypothesis is as the equation 1:
In this equation, R is stock returns, SPREAD relative price gap, BTM ratio of book value to market value, SIZE company size, FL financial leverage, and the intercept of the linear relationship is estimate. The results of the regression model test for the first hypothesis is reflected in Table 3.
Table 3: Independent variable: relative price gap Result Sig t static Coefficient Variable - ./000 (6/725) (375 /475) Fixed value Significant ./039 3/255 12/482
The relative price gap
Significant ./000
4/351 22/481
Ratio of book value to market value
Significant ./000 5/869 12/258 Company size Significant ./000 4/389 11/912 Financial leverage
Licensed under Creative Common Page 431 Output of table shows that the significance level of the independent variable (relative price gap) is less than 0.5%; so by confidence level 95%, it can be said that there is a significant positive relationship between the relative price gap and stock returns as well as the table results indicate that there is a significant relationship between the control variables of the ratio of book value to the market value, company size and financial leverage with stock returns that this relationship is positive for all three.
The value 2.007for the statistic Durbin-Watson (that is in the range of 1/5 to 5/2) also indicates no autocorrelation between variables.
Statistic F significance level indicates the significance of total regression model. Given the output of the first hypothesis test, regression equation can be written as follows:
R = -375 / 457 + 12 / 482SPREAD + 22 / 481BTM + 12 / 258SIZE + 11 / 912FL
The second hypothesis test
This hypothesis regression equation considering control variables is as equation 2:
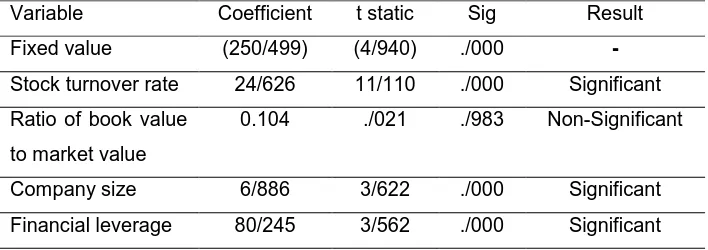
In this equation, R is stock returns, TURN, BTM ratio of book value to market value, SIZE company size, FL financial leverage, and the intercept of the linear relationship is estimate. The results of the regression model test for the second hypothesis is reflected in Table 4.
Table 4: Independent variable: Stock turnover rate Result Sig
t static Coefficient
Variable
- ./000
(4/940) (250/499)
Fixed value
Significant ./000
11/110 24/626
Stock turnover rate
Non-Significant ./983
./021 0.104
Ratio of book value to market value
Significant ./000
3/622 6/886
Company size
Significant ./000
3/562 80/245
Financial leverage
Statistic F: 186.69 Significant level:./000 Multiple correlation coefficient: ./621 Durbin Watson: 1.949 The coefficient of determination: ./386 Adjusted coefficient of determination: ./380
Licensed under Creative Common Page 432 significant relationship between the stock return with control variables of the company size and financial leverage but there is no relationship with ratio of book value to market value.
The value the statistic Durbin-Watson (1.949) also indicates no autocorrelation between variables.
Statistic F significance level indicates the significance of total regression model. Given the output of the second hypothesis test, regression equation can be written as follows:
R = -250/499 + 24/626TURN +. /104BTM + 6/886SIZE + 80/245FL
The determination coefficient value obtained for regression model of each of the hypotheses indicate that the relative price gap with control variables explains 7/21 percent of the stock return changes of stock turnover rate 6/38 percent of total stock returns changes (dependent variable).
DISCUSSION AND CONCLUSION
The first hypothesis was about the relation of relative price gap between stock returns that the results indicated a direct and significant relationship between these two variables. These results are consistent with findings of Amifud and Mendelson (1986), Chalmers and Kadlek (1988), Alzarapo and Ringanam (1993), Marshall& Young (2003) and Fujimoto and Watanab (2006) but
Control variables
Company size
Ratio of book value to market value
Financial leverage
Independent variable
Dependent variable
Stock return
Stock turnover rate
Licensed under Creative Common Page 433 is inconsistent with findings of Chen and Kun (1989), Brennan Vesabramaniyam (1996) and Mehrani and Rasaiian (2009).
Positive relationship between relative price gap of liquidity measures and stock returns means that by increasing the relative price gap, liquidity risk of stock increases and risk increasing follows the expectation of achieving high returns for investors; because as it was referred in theoretical foundations, the relative price gap is considered a reducing measure of liquidity, which means that by increasing relative price gap, liquidity decreases and vice versa.
In the second hypothesis, the relationship between stock turnover rate and stock return was investigated that the results indicated a significant and direct correlation between these two variables. These results are consistent with research findings of Ji Young (2003), Bakir and Stein (2003), Di (2005) and Yahyazadehfar et al (2010) but inconsistent with the findings of Ho (1997) and Chordya (2001); and as it was referred in the theoretical foundations, stock turnover rate is considered an increasing measure of liquidity, which means that by increasing stock turnover rate, liquidity will increase and vice versa.
Positive correlation between stock turnover rate of liquidity measures and stock returns means that the high number of transactions of stock causes welcome of market from stocks and this feature is considered a point for it; Also, with increasing demand for stocks, its market price passes upward trend and produces a high return for investors, in this study it cannot be commented on the relationship between liquidity and stock return; because by increasing relative price gap and consequently reducing stock liquidity, stock return reduces and by increasing the rate of stock turnover and following it increase liquidity, stock return increases.
Note
1 . wyss kiel.2
nicholson.3 chon.4
pastor.5 leo.6
camerton.7 bertolotti.8
marshal.9 omri.10
Yuk.11 lee.12
watson.13 austin.14
hu.15 chordia.16
cumming.17
SUGGESTIONS
Licensed under Creative Common Page 434 1- This study is among the first studies in Iran that studied the impact of different levels of liquidity measures on stock return premium. Therefore, future studies can consider liquidity risk in studying the effect of this variable on stock returns premium.
2- This research examines the impact of liquidity on stock returns premium; so future studies suggest that the impact of these criterion on risk premium.
3 – It is suggested that future research in this area could study issues be related to impact of the stock and assets liquidity on stock returns in periods of recession and economic prosperity, and to distinguish between different industries, corporate size, corporate life cycle, etc.
REFERENCES
Ahmadpur, Ahmad and Rasaiian, Amir 2006. "The relationship between risk measures and difference of proposed price of purchase and selling shares on the Stock Exchange" accounting and auditing investigatings, the No. 46, pp. 47-45
Aitken, M. & Comerton-Ford, C. 2003. “How Should Liquidity Be Measured?”, Pacific-Basin FinanceJournal 11(45–59).
Bertolotti, B.; de Jong, F.; Nicodano, G.; Ibolya, S.2006. “Privatization and Stock Market Liquidity”, Journal of Banking & Finance, Social Sciencetal Augmented-Liquidity A. “2006.
Ghaemi, Mohammad Hossein and Rahimpur. Winter "2010 Earnings Quarterly Announcement and Stock Liquidity", Journal of Accounting Research, the second year, fourth number
J Gavin, Nicholson. & C Geoffrey, Kiel (2015) How Performance of Corporate and Composition Contrasting Informs: Experience of Australian Corporate, Governance Corporate of Theories -189(11). Martin, Young. & B, Marshall (2004), Markets Driven-Order Pure in Returns Stock ,"Market Stock Analysis. Review International of international Finance. 188–173.
Mehrani, Sasan and Rasaiian, Amir. "2008. Investigate the relationship between stock liquidity measures and annual stock returns in Tehran Stock Exchange", Journal of Accounting, University of Shiraz, the first course, the first edition, pp. 222-218
Mehrani, Sasan and Rasaiian, Amir. "2014. Investigate the relationship between stock liquidity measures and annual stock returns in Tehran Stock Exchange", Journal of Accounting, University of Shiraz
N, Loukil.; M, Zayani.; A, Omri (2004). Returns Stock on Liquidity of Finance», Market Stock Tunis the of Investigation Electronic Science Social, Strategies Business and .Publishing.
Weimin, Liu (2003)., Model Pricing Asset, Financial Journal, 82, 671–631.