© Author(s) 2014. CC Attribution 3.0 License.
A Fabry–Perot interferometer-based camera for two-dimensional
mapping of SO
2
distributions
J. Kuhn1, N. Bobrowski1, P. Lübcke1, L. Vogel2, and U. Platt1
1Institute of Environmental Physics, University of Heidelberg, Heidelberg, Germany 2Earth Observation Science, Space Research Centre, University of Leicester, Leicester, UK Correspondence to: J. Kuhn ([email protected])
Received: 19 January 2014 – Published in Atmos. Meas. Tech. Discuss.: 22 May 2014 Revised: 13 September 2014 – Accepted: 20 September 2014 – Published: 10 November 2014
Abstract. We examine a new imaging method for the
re-mote sensing of volcanic gases, which relies on the regu-larly spaced narrow-band absorption structures in the UV– VIS of many molecules. A Fabry–Perot interferometer (FPI) is used to compare the scattered sunlight radiance at wave-lengths corresponding to absorption bands with the radiance at wavelengths in between the bands, thereby identifying and quantifying the gas. In this first theoretical study, we present sample calculations for the detection of sulfur dioxide (SO2). Optimum values for the FPI setup parameters are proposed. Furthermore, the performance of the FPI method is compared to SO2cameras. We show that camera systems using an FPI are far less influenced by changes in atmospheric radiative transfer (e.g., due to aerosol) and have a great potential as a future technique for examining emissions of SO2(or other gases) from volcanic sources and other point sources.
1 Introduction
SO2emission rates are routinely measured as a monitoring parameter at many volcanoes (Galle et al., 2010). The chem-ical lifetime of SO2, which can account for up to 25 % of the total emitted volcanic gas volume (Textor et al., 2004), is on the order of days, and background concentrations in the ambient atmosphere are usually very low (e.g., McGonigle et al., 2004; Beirle et al., 2014). Therefore, volcanic SO2can easily be measured by remote sensing techniques, and it of-ten serves as a dilution tracer when studying the chemistry of more reactive gases emitted by volcanoes (e.g., von Glasow et al., 2009).
Besides COrrelation SPECtroscopy (COSPEC, Moffat and Millan, 1971), differential optical absorption spec-troscopy (DOAS, Platt and Stutz, 2008) has become an in-creasingly more common technique for examining volcanic SO2 emissions. The DOAS technique allows the applica-tion of compact, portable devices, and is furthermore able to measure other gas species (e.g., BrO, OClO, O3) simul-taneously. However, typical DOAS (and COSPEC) measure-ments provide data only in a single viewing direction. One-dimensional data (e.g., cross sections of volcanic plumes) can be derived by scanning DOAS schemes (e.g., Hönninger et al., 2004; Galle et al., 2010), while two-dimensional data can be acquired by imaging DOAS instruments (Bobrowski et al., 2006; Louban et al., 2009), which are, however, com-parably complex and rather slow (with a temporal resolution of about 20 min per image).
300 310 320 330 340 0
0.5 1
optical density
wavelength [nm]
0 0.5 1
rel. solar radiance
0 0.5 1
x 10−18
SO
2
absorption
cross section [cm
2]
0 0.5 1
rel. transmission
0 0.5 1
rel. transmission FPI setting A
0 0.5 1
rel. transmission FPI setting B
ozone (100DU)
AOD (α=1.2) (a)
(b)
(c)
(d)
Filter A Filter A’
Filter B
T
FPI,A
λcut
T
FPI,B
T
bpf
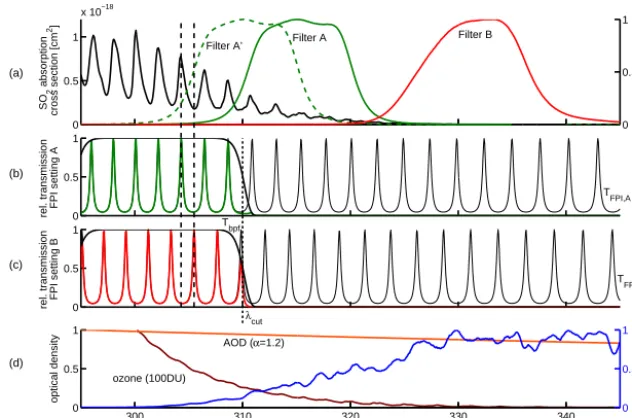
Figure 1. (a) SO2absorption cross section (black drawn line, left ordinate axis, data from Bogumil et al., 2003) as a function of wavelength,
and transmission curves of filters A, A0and B (right ordinate axis); (b), (c) FPI transmission curve for settings A and B; the dashed vertical lines mark the positions at which FPI transmission maxima coincide with maximum and minimum absorption, respectively. (d) Incident solar radiance (blue drawn line, right ordinate axis in relative units), optical density of ozone absorption (100 DU, left ordinate axis) and aerosol extinction (AOD=1 at 295 nm, Ångström exponentα=1.2, left ordinate axis)
slightly longer wavelength ranges (at about 330 nm), where the SO2 absorption is much weaker but aerosol impact is approximately the same as for filter A. This technique al-lows the observation of plume dynamics and measurements of SO2emission fluxes on timescales of seconds, which are for instance suitable for investigating correlations between gas emissions and seismic activity at volcanoes (e.g., Nadeau et al., 2011).
However, the rather broadband transmission curve of the filter used in the SO2 camera encompasses several distinct SO2absorption bands, thereby losing spectral information. Moreover, the difference between the center wavelengths of filter A and filter B is relatively high. Hence, wavelength-dependent impacts on the radiation within the plume (e.g., Mie scattering at plume aerosol) can lead to large errors in the measured SO2 column densities, which are difficult to correct (e.g., Kern et al., 2010a, 2013; Lübcke et al., 2013).
In this paper, a concept for a measurement device com-bining most of the advantages of DOAS as well as of the SO2 camera is introduced (Sect. 2). As mentioned already in Kern et al. (2010b), the regularly spaced narrow-band ab-sorption structure of SO2allows the measurement of SO2by using a Fabry–Perot interferometer (FPI). Radiances at wave-lengths of maximum narrow-band SO2 absorption can be compared to radiances at wavelengths in between these max-ima. Thereby, basic limitations of the SO2camera technique as mentioned above could be drastically reduced (Sect. 3). The FPI technique introduced here is in general similar to the COSPEC method (Moffat and Millan, 1971; Millan,
2008), which has already been successfully applied at var-ious volcanoes for decades. However, the opto-mechanic system is replaced by interferometer optics, resulting in a smaller, more robust and cost-efficient design, which can record one- or two-dimensional data with high temporal res-olution (Sect. 4).
The correlation between the spectral FPI transmission and periodic spectra was first used to study molecular spectra (e.g., Barrett and Myers, 1971). Later, several approaches to identifying and quantifying gases by FPI correlation were re-ported (mainly in the infrared; see, e.g., Wilson et al., 2007; Vargas-Rodriguez and Rutt, 2009). In contrast to previous studies, this study focuses on UV detection and imaging of volcanic gas emissions.
2 SO2camera and FPI measurement principle
IA= Z
IS(λ)·TA(λ)·Q(λ)dλ (1)
IAis compared to a reference radianceIA,0, also measured through filter A:
IA,0=
Z
IS,0(λ)·TA(λ)·Q(λ)dλ (2)
IS,0(λ)is supposed to be the spectral radiance with the radi-ation not passing through the absorber (the volcanic plume). Since it is generally not possible to measureIA,0 with the same viewing direction as IA, a measurement in a slightly different direction outside the plume is commonly used as an approximation.
Via the Beer–Lambert law, these two radiance values are linked to the optical densityτAof the volcanic plume for each pixel in the wavelength range of filter A:
τA= −log
IA
IA,0
=τSO2,A+τother,A, (3)
with
τSO2,A=σSO2,A·SSO2. (4)
The plume optical densityτAin the wavelength window of filter A is a function of the SO2absorption τSO2,A and the
contribution of other extinction effects τother,A (e.g., scat-tering at plume aerosol).σSO2,A is the weighted absorption
cross section of SO2averaged over the wavelength range of filter A.SSO2 is the SO2column density.
In an analogous way,τBis the optical density measured through filter B (∼325–340 nm), where the SO2absorption is significantly smaller (see Fig. 1a):
τB= −log
IB
IB,0
=τSO2,B+τother,B. (5)
The optical densityτBis subtracted fromτAin order to obtain a signal that only depends on SO2absorption. This correction assumes that all extinction originating from effects other than SO2absorption are broadband (approximately independent of wavelength in the regarded spectral range; i.e.,τother,A≈ τother,B):
˜
τ =AA=τA−τB≈τSO2,A−τSO2,B (6)
= σSO2,A−σSO2,B
·SSO2.
˜
τ is called apparent absorbance (AA), and ideally is propor-tional to SSO2. The weighted SO2absorption cross sections
(σSO2,A, σSO2,B) can be determined using calibration cells (e.g., Mori and Burton, 2006). Another possible calibration method for the SO2camera is to use additional DOAS mea-surements (e.g., Lübcke et al., 2013).
Figure 2. Fabry–Perot interferometer: incoming radiation
under-goes multiple reflections between two plane-parallel surfaces of re-flectanceR, mounted at distanced. Interference of the transmitted partial beams leads to the transmission structure (see Eq. 8, Fig. 1), which can be optimized to match periodic absorption structure.
By using an FPI in our new proposed instrument, more detailed spectral information is taken into account, allow-ing a higher SO2sensitivity to be reached. Moreover, inter-ferences of the SO2measurement with radiative transfer ef-fects such as wavelength-dependent (aerosol) extinction and changing ozone background are reduced.
An FPI consists of two plane-parallel surfaces with re-flectanceR at separationd (see Fig. 2). Incident radiation is split up into a reflected and a transmitted part at the in-dividual surfaces. The partial beams pass through different optical path lengths between the two surfaces before leaving the FPI. For radiation of wavelengthλand a refractive index nof the medium between the surfaces, this results in a phase difference
δ(λ;n, d, α)=2π·2nd
λ ·cosα (7)
between two consecutively transmitted (or reflected) partial beams.αis the angle between the propagation direction of the partial beams and the surface normal in between the two surfaces. The reflectance R of the surfaces determines the finesse (F) (see Eq. 10) of the FPI.F is a measure of the number of partial beams, which effectively interfere with each other after being transmitted (or reflected) by the FPI
(F (R)increases monotonically). Superposition of all
trans-mitted partial beams with their respective phase shifts and neglect of absorption effects yield the transmission profile of the FPI (Perot and Fabry, 1899):
TFPI(λ;d, n, α, R)=
1+CF·sin2
δ(λ)
2 −1
(8)
=
1+CF·sin2
2ndπ
λ cosα
−1
with
CF =
4R
(1−R)2≈
4·F2
π2 or F ≈
π
√
R
1−R. (10) The approximation forF in Eq. (10) is only valid forR > 0.5.TFPI is a periodic function ofδ, with maxima forδ at-taining integer multiples of 2π. For an increasing finesse coefficientCF and thus for increasingF orR, the spectral
transmission maxima get sharper.
The periodic, comb-shaped transmission structure of the FPI can be used to compare the radiance transmitted at wave-lengths corresponding to the narrow-band SO2 absorption maxima with those corresponding to absorption minima by using appropriate FPI instrument parameters. In the simplest case, two FPI settings are used. In one FPI setting (setting A, Fig. 1b and c), the parameters are chosen such that the trans-mission maxima of the FPI coincide with the maxima of the absorption structure of SO2. In another setting (setting B), the transmission maxima of the FPI coincide with the min-ima of the SO2absorption structure. Setting B is reached by changingδ. By comparing the transmitted radiances recorded with FPI settings A and B, the SO2 column density can be derived by calibration, similarly to the SO2 camera and COSPEC.
However, scattered solar radiation at wavelength ranges without a narrow-band SO2 absorption structure matching the FPI transmission has to be excluded. Towards shorter wavelengths with a strong narrow-band absorption struc-ture, the scattered solar radiance at ground level decreases very quickly (mostly because of increasing absorption due to stratospheric ozone). For FPI SO2 measurements in the regarded spectral range, it is therefore sufficient to prevent measurements at longer wavelengths, where the SO2 absorp-tion structure is weak. This can be accomplished by a super-imposed short-pass or band-pass interference filter (bpf) with transmissionTbpf(see Fig. 1b and c), which will be charac-terized by the largest transmitted wavelengthλcut.
The radiance measured by the detector after having tra-versed the band-pass filter and the FPI in the settingi= A, B is given by (compare Eq. 1)
IFPI, i=
Z
IS(λ)·TFPI, i(λ)·Tbpf(λ)·Q(λ)dλ. (11)
By comparison to reference measurements
I0,FPI, i=
Z
IS,0(λ)·TFPI, i(λ)·Tbpf(λ)·Q(λ)dλ, (12)
the optical densities for the corresponding FPI transmissions are determined:
τFPI, i= −log
IFPI, i
I0,FPI, i
=τSO2,FPI, i+τother,FPI, i. (13)
τSO2,FPI, i is the part of the SO2 absorption τSO2 seen
through the transmission profile of the respective FPI set-ting and therefore proportional toSSO2. When choosing
set-tings A and B as described above,τSO2,FPI,AandτSO2,FPI,B
differ in the presence of SO2, whileτother,FPI, iis considered
to be approximately the same for the two FPI settings. Simi-larly to the SO2camera, we get
˜
τFPI=AAFPI=τFPI,A−τFPI,B∝τSO2 ∝SSO2 (14)
The crucial difference to the SO2 camera measurement is that instead of comparing the radiances of two separate spec-tral ranges averaged over an FWHM of ∼10 nm, relative changes in the narrow-band absorption structure are now taken into account. Since the transmission structures of FPI settings A and B are interleaved and differ by a shift of only about 1 nm, the approximately broadband, non-SO2 contri-butions ofτother,FPI,Aandτother,FPI,Bcancel each other out more efficiently. AAFPIis therefore much less susceptible to wavelength-dependent effects like, e.g., aerosol extinction.
Characteristics of an SO2FPI device
In the following, the dependency of AAFPI on certain key parameters, like the finesseF of the FPI, the surface sepa-rationd or the incidence angleα of incoming radiation, is discussed.
To examine the characteristics of an FPI measurement as described above, the incoming spectral radiance IS(λ) of scattered solar radiation, having traversed the volcanic plume, is calculated according to the approximation of the Beer–Lambert law:
IS(λ)=IS,0(λ)·e−τ (λ)=IS,0(λ)·e−σSO2(λ)·SSO2 (15) For the moment, the SO2 absorption is assumed to be the only extinction effect on the radiation travers-ing the plume. The absorption cross section σSO2(λ) of
Bogumil et al. (2003) for 293 K was used (see Fig. 1). As the reference radianceIS,0(λ), a measured spectrum of scat-tered sunlight was employed. A modified Gaussian profile was used to model the spectral transmissionTbpf(λ) of the band-pass filter (see Fig. 1):
Tbpf(λ)=A·exp
−0.5 |
λ−λc|
σ γ
(16)
The center wavelengthλc determinesλcut, while A=0.65 andγ=2·σ=15.2 constitute constant shape parameters of the transmission profile, which was matched to a real band-pass interference filter transmission curve.
The integrated radiancesIFPI, iandI0,FPI, i arriving at the
detector can be calculated usingIS,0(λ)andIS(λ)(Eq. 15) multiplied by the transmission curves for the FPI (Eq. 8) and the band-pass filter (Eq. 16).
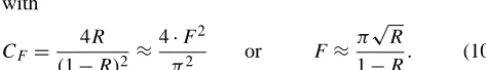
Figure 3. (a) Optical densityτfor an SO2slant column densitySSO2=10
18molec cm−2observed by an FPI setup for varying distanced
between the surfaces, calculated for FPI reflectivities of 0.18, 0.65 and 0.74. The difference in the optical densities recorded at maximum (dA at, e.g., 21.6 µm) and minimum (dB) values is the apparent absorbance. (b) The apparent absorbance (blue line) grows monotonically with the reflectivityR. However, for highR(and thus for highF), the SNR is decreasing, since less radiation is transmitted.
is high enough, small changes inδ(Eq. 7) lead in a good ap-proximation only to a wavelength shift of the transmission curve, while the stretch can be neglected (stretchshift =m+1). For an FPI transmission profile, which is matched to the SO2 absorption cross section in the spectral range of interest (see Fig. 1), the order of the maxima is about m=2nd
λm ≈140.
Therefore, the change between FPI settings A (transmission maxima on SO2absorption bands) and B (transmission max-ima between SO2absorption bands) can easily be realized by a small change ind,nor cosα.
In the following examination, we assume that only the sur-face separationd of the FPI is varied for normal incident ra-diation (α=0) andn=nair. Figure 3a shows the modeled optical density τFPI, measured by an FPI device as a func-tion ofdfor FPI surface reflectivities of 0.18, 0.65 and 0.74. An SO2 slant column density of SSO2 =10
18molec cm−2 (400 ppmm, at standard pressure and 20◦C) was assumed, which is a common value measured at volcanic plumes. The oscillating behavior ofτFPI(d)mirrors the FPI transmission structure being shifted along the wavelength axis across the narrow-band absorption structure of SO2. FPI surface separa-tionsdcorresponding to a maximum optical density (i.e., the FPI transmission maxima coincide with the SO2absorption bands) suggest values fordAin setting A (e.g., 21.6 µm). The changedAB=dB−dAin the FPI surface separation required to reach setting B (minimum optical density, i.e., FPI trans-mission maxima in between SO2absorption bands) would be around 80 nm (for the adjoining minimum).
The modulation of τFPI as a function of d (Fig. 3a) in-creases with the reflectivity R (and thus with the finesse F), since the transmission maxima get sharper, and therefore only radiation most affected by SO2 absorption is transmit-ted. However, a higher finesse must be weighted against the reduced integrated transmission of the FPI, i.e., reduced ra-diation throughput. Since less rara-diation arrives at the detec-tor, the signal-to-noise ratio SNR= AAFPI
1AAFPI starts to decrease
Table 1. Result of the numerical optimization of the SNR of an FPI
SO2measurement forSSO2=10
18molec cm−2;d
Ais the separa-tion of the surfaces in FPI setting A,dAB the change in surface separation to get from FPI setting A to FPI setting B,F the finesse andλcutthe cutoff wavelength of the band-pass filter towards longer wavelengths.
Parameter Maximizing value
dA 21.6 µm dAB 84 nm R 0.65 (F =7.1) λcut 310 nm
again at values ofR exceeding about 0.65, while AAFPI in-creases monotonically (see Fig. 3b).
A similar compromise has to be made when choosing the cutoff wavelength λcut. The SO2 absorption structure van-ishes towards longer wavelengths, while the scattered solar radiance increases. Hence, there is also a certain value for λcutoptimizing the SNR.
In order to be able to assess the noise1AAFPIof a hypo-thetical instrument, we assumedIFPI, iandI0,FPI, ito be
pro-portional to the number of photons reaching a hypothetical detector. Photon statistics then imply that the measurement error of the radiance is given by1I ∝
√
I and that the er-ror in AAFPI,1AAFPIcan be determined via Gaussian error propagation. The absolute value of the SNR is still dependent on the absolute radiances reaching the detector, which we do not know yet. Thus, in this theoretical study, SNR is used as a value proportional to the real SNR, which is sufficient for our optimization problems.
In order to find optimal parameters of an FPI setup for normal incidence of radiation on the FPI (α=0), the SNR was optimized numerically. Table 1 shows the varied setup parameters and their values maximizing the SNR for an SO2 column density ofSSO2=10
0 2 4 6 8 10 −0.2
−0.1 0 0.1 0.2
α [deg]
apparent absorbance
τ
FPI,A − τFPI,B τ
FPI,C − τFPI,D α
max
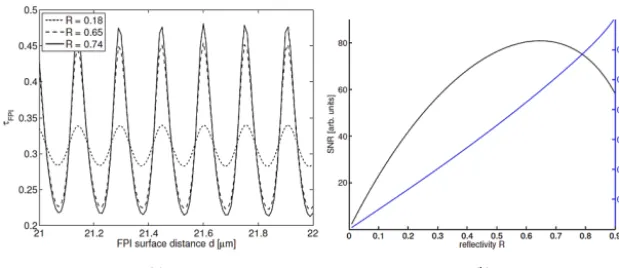
Figure 4. AAFPIas a function of the incident illumination angleα
for an SO2slant column density ofSSO2=10
18molec cm−2(blue
drawn line): small changes in cosαcause a shift ofTFPIin wave-length, which leads to an oscillating progression of AAFPI over α. αmax≈1.8◦ limits the range of angles for the assumption of parallel incident radiation. The dashed line shows a measurement with two different FPI surface separations (dC=dA+12dABand dD=dA+32dAB). By using more than two FPI settings, the sensi-tivity for arbitrary incidence angles can be obtained (see Sect. 4).
Since δ is proportional to cosα (Eq. 7), a small change in cosαalso causes a spectral shift in the FPI transmission structure TFPI. Figure 4 shows the dependency of AAFPI on α for the above-proposed FPI setup and for SSO2=
1018molec cm−2(blue drawn line). The behavior is approx-imately flat until reaching αmax≈1.8◦, which constitutes a limitation for the imaging instrument setups described below (see Sect. 4). For higher values of α, the appar-ent absorbance AAFPIoscillates between negative (τFPI,A< τFPI,B) and positive extrema, attaining FPI incident anglesα with vanishing AAFPI in between them. Since the FPI trans-mission structures of the two settings (A and B) are shifted in the same way across several SO2absorption bands, both positive and negative values of AAFPI carry the same SO2 information. AAFPIcan thus be redefined as|AAFPI|.
3 Comparison to conventional SO2cameras
The measurement principle as described up to now, could, e.g., be used to construct a simple “one-pixel” (OP) FPI SO2detector with a rather narrow FOV. Such an instrument would indeed make sense, since it would have a sensitiv-ity and selectivsensitiv-ity comparable to a spectrometer (as, e.g., used in the Network of Observation of Volcanic and Atmo-spheric Change (NOVAC); see Galle et al., 2010), but could potentially be a more compact and more economic alterna-tive. Likewise, the measurement principle of the filter-based SO2camera could be adopted for an OP instrument. In the
following, we compare the performance of an OP FPI de-vice with a hypothetical OP SO2“camera”. The conclusions drawn are also relevant for two-dimensional (2-D) cameras, i.e., 2-D SO2cameras and 2-D FPI cameras as described in Sect. 4.
An FPI instrument with the parameters of Table 1 was con-sidered; transmission curves of the corresponding settings are shown in Fig. 1. For the SO2camera, the filter curves of Lübcke et al. (2013) were applied (see also Fig. 1). Moreover, a second SO2camera setup with filter A shifted by 5 nm to-wards shorter wavelengths is additionally examined for com-parison to represent different popular setups of SO2cameras. In the following, the shifted filter A is called filter A0.
3.1 Sensitivity to SO2and interference due to Mie scattering
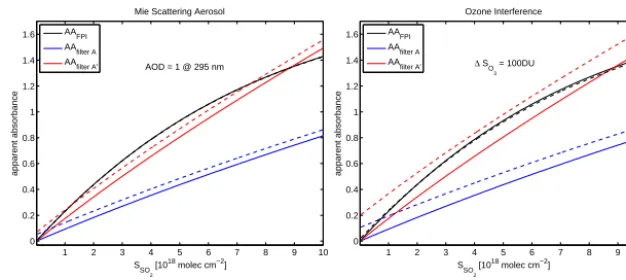
Figure 5a shows the AA for the respective measurement method as a function of the SO2 column density SSO2. In
order to examine the plume aerosol impact on the AA, two calibration curves were simulated for each device. The solid lines show the AA with SO2 absorption being the only effect on IS,0(λ) (see Eq. 15). For the second set of lines (dashed), an additional wavelength-dependent extinc-tionτaerosol(λ) from a Mie scattering aerosol was assumed using an Ångström exponent of 1.2, which was found to be representative for volcanic plumes (Spinetti and Buongiorno, 2007). The wavelength dependency of the aerosol extinction is then described by
τaerosol(λ)=τaerosol, λ0·
λ
λ0
−1.2
. (17)
The aerosol optical density (AOD) was fixed toτaerosol,λ0 =1
atλ0=295 nm, which corresponds to a rather low AOD of a volcanic plume (Fig. 1d).
The SO2 camera with filter A0 is more sensitive to SO2 absorption, sinceσSO2,A0 is greater thanσSO2,A (see Fig. 1
and Eq. 4). However, the increase in sensitivity goes together with a decrease in incoming solar radiance at shorter wave-lengths.
The wavelength-dependent AOD causes a higher extinc-tion in the spectral ranges of filters A and A0 than in the spectral range of filter B (τaerosol,A> τaerosol,B), leading to an offset1AAAODtowards higher AA for the respective SO2 camera setups. For SSO2 =10
18molec cm−2, the assumed, small amount of aerosol thus accounts for relative deviations of 1AAAOD
AA ≈54 % when using filter A, and
1AAAOD
AA ≈38 %
when using filter A0. The smaller relative deviation for fil-ter A0results from the different wavelength dependencies of aerosol extinction and SO2absorption.
The FPI device (drawn black line in Fig. 5a) is more sen-sitive to SO2than either of the two filter-based setups. This is because narrow-band changes in the SO2absorption cross section below 310 nm are larger than the averaged cross sec-tionsσSO2,A0 andσSO2,A, respectively. For increasingSSO
1 2 3 4 5 6 7 8 9 10 0
0.2 0.4 0.6 0.8 1 1.2 1.4
apparent absorbance
SSO
2
[1018 molec cm−2]
AOD = 1 @ 295 nm AAfilter A
AAfilter A′
(a)
1 2 3 4 5 6 7 8 9 10 0
0.2 0.4 0.6 0.8 1 1.2 1.4
apparent absorbance
SSO
2
[1018 molec cm−2] ∆ SO
3
= 100DU AAfilter A
AAfilter A′
(b)
Figure 5. Modeled calibration curves (without aerosol) for the OP FPI SO2 device (black drawn line, flattening for highSSO2 due to
saturation) and the OP filter-based SO2devices with filter A (blue drawn line) and filter A0(red drawn line); (a) deviation (dashed lines) due to Mie scattering aerosol with an optical density (AOD) of 1 at 295 nm. The filter-based SO2devices (regardless of the filter used) show a considerable false positive SO2signal, while the curve for the FPI device hardly separates from the undisturbed calibration curve.
(b) Deviation due to ozone interference, where a change in 1SO3=100 DU was assumed. Again, the FPI measurement shows far less
deviation.
the progression of AAFPIgradually flattens, since saturation effects at wavelengths of strong SO2 absorption bands oc-cur. We ran the simulation to SO2column densities of up to 1019molec cm−2, a value that may only be observed close to the volcanic vent of very strong SO2emitters. The saturation only leads to a reduced sensitivity for very high SO2 absorp-tions, and may be dealt with by carefully calibrating the FPI device.
While a saturation effect can be observed, we also see that there is hardly any sensitivity to the added amount of aerosol (1AAFPI,AOD
AAFPI <1 % forSSO2 =10
18molec cm−2); in fact, the dashed black line is almost completely covered by the drawn black line, meaning that τaerosol,FPI,A≈τaerosol,FPI,B still holds for the chosen FPI settings.
Note that in this simple calculation, we only considered aerosol extinction. This approximation holds for low plume AOD. Radiative transfer effects like light dilution and multi-ple scattering in the plume (e.g., Kern et al., 2010a; Millan, 1980) will still affect the FPI method in a manner similar to almost all passive UV absorption measurements. The FPI approach only removes errors of the traditional SO2 cam-era introduced by measuring at different wavelength ranges, because both FPI signals (A and B) are obtained at nearly the same wavelength range. Radiative transfer calculations remain necessary to assess and possibly correct other error sources fully.
3.2 Ozone interference
Changes in the solar zenith angle (SZA) between background and plume measurement induce changes in the light path of solar radiation through the stratospheric ozone layer. The absorption cross section of ozone drastically increases to-wards shorter UV wavelengths in the observed spectral range (Fig. 1d). A changing background ozone column therefore will affect the above-described SO2measurement principles.
The results of the model calculations are shown in Fig. 5b, where two curves are again plotted for the three measure-ment setups. The solid lines again show the AA caused only by SO2absorption. The dashed lines represent the AA with an additional change in the ozone column density of1SO3=
100 DU. This could for instance be caused by a change in the SZA from 30 to 48◦in a 340 DU atmosphere, occurring be-tween the measurement and the last reference measurement. The simulation again demonstrates that the AA of the SO2 cameras is much more strongly influenced by changes in the ozone background than the AAFPI of the FPI device. The relative deviations of AA forSSO2=10
18molec cm−2 are 1AAAAO3 ≈110 % for both SO2 camera implementa-tions. The FPI device shows a significantly smaller de-viation throughout the observed SSO2 range. While for
lower SSO2,AAFPI is slightly overestimated (
1AAFPI,O3
AAFPI ≈
3 % forSSO2=10
18molec cm−2), saturation at wavelengths of strong SO2absorption bands, and therefore flattening of the calibration curve, occurs earlier.
4 FPI camera implementation
4.1 Scanning OP FPI camera
One possible way to obtain 2-DSSO2distributions is by
Table 2. Comparision of the OP FPI camera and a spectrometer
used in DOAS measurements (Ocean Optics©USB 2000+), when observing the same spectral range: the surface areaAlim and the solid anglelimlimiting the etendueEmaxmainly contribute to the 6–9 times higher SNR of the OP FPI camera.
OP FPI device Spectrometer (DOAS)
Alim 314 mm2 0.05 mm2
lim 3.1×10⁻³sr 49×10−3sr
Alim×lim 973×10−3mm2sr 2.4×10⁻³mm2sr
Emax 400 1
Rel. η 0.2 0.5
NI−1 0.25–0.5 1
IFPI∗
I∗
spec 40–80
r
I∗
FPI
I∗ spec
≈ SNRFPI
SNRspec 6–9
that for a given aperture angle (2·β), the restrictionα < αmax holds for all beams arriving at the FPI. In such a setup, the maximum possible etendue1Emaxis determined byαmaxand the illuminated FPI surface area.
In Table 2, the suggested OP FPI setup is compared to a spectrometer commonly used in volcanic applications (Ocean Optics©USB 2000+) regarding the SNR (note that a telescope usually used with the spectrometer does not re-duce the etendue, if well designed). In order to do this, the relative radiancesIFPI∗ andIspec∗ arriving at the detector of the respective instrument were estimated. Relative values of the maximum possible etendue Emax (normalized to the spec-trometer etendue) and a loss factorηwere taken into account. In addition, the relative radiances have to be divided by the numberNI of radiance measurements needed to obtain one
measurement ofSSO2. For the OP FPI device,N
−1
I can not
exceed 0.5, since at least two radiance measurements (for settings A and B) are needed. Depending on how often a ref-erence measurement (two additional radiance measurements) is recorded, we findNI−1∈ [0.25,0.5]. For the spectrometer, NI=1, and a factor of η=0.5 accounts for losses at the
grating. A factor ofη=0.2 was assumed to account for FPI reflection and absorption. Other losses due to the employed optics were set to unity.
We assumed the FPI to be illuminated on a surface area of 20 mm in diameter (e.g.,R2≈10 mm) and withαmax=1.8◦, which for an aperture angle of 2·β=1◦would require a ra-diusR1=36 mm of lens 1. For the USB 2000+, the limiting factors are thef/4 optics of the spectrometer and the com-monly chosen 1 mm×50 µm entrance slit (assuming that the cylinder lens option in front of the detector is used, which fo-cuses radiation from the complete height of the slit onto the
1The etendue of an optical instrument is a measure of its
maxi-mum possible light throughput, and is defined as the product of the limiting beam solid angle and the receiving area.
Figure 6. Three possible implementations of an FPI camera. In each
setup, the FPI is implemented by two fused silica plates with reflec-tive coatings (reflectivity R) at the inner surfaces, whose separation dis tunable by piezo actuators. The outer surfaces either carry anti-reflective coating or are slightly tilted against each other to exclude additional interference effects. (a) One-pixel FPI instrument: two lenses (lens 1, lens 2) and an aperture determine the aperture angle (2·β) of the instrument, constrained byαmax. Lens 3 projects the radiation onto a UV-sensitive OP detector after having passed the band-pass filter. 2-D data are achieved by scanning, either by ad-ditional optics or by tilting the whole device. (b) 2-D FPI camera, where radiation from FOV is parallelized before being projected onto a 2-D detector. (c) 2-D FPI camera, where radiation from FOV traverses the FPI underα=βfor FOV≈20◦. More than two FPI settings are required to obtain non-vanishing sensitivity throughout the FOV (see Fig. 7).
detector).Emax is then approximated by the product of the limiting surface areaAlimand the limiting solid anglelim.
For a measurement in the same spectral range, the rel-ative SNR would be proportional to
r
IFPI∗ I∗
spec. According to
improved etendue of the FPI instrument can be used to ob-tain a combination of higher SNR (lower detection limit) and higher temporal resolution.
4.2 The 2-D FPI camera
While the use of an FPI in an OP detector has potentially large advantages over conventional spectrometers, the FPI technique can also readily be used as a 2-D detector, just like a SO2camera. In the following, two possible 2-D FPI SO2 camera setups are briefly introduced.
4.2.1 FPI in a parallelized radiation setup
Figure 6b shows a 2-D FPI camera setup. Basically, the im-plementation is similar to that of the OP FPI device. How-ever, lens 1 is removed to increase the field of view to FOV≈2·β=2·arctanR2
f2, and the OP UV detector is
re-placed by a UV-sensitive 2-D detector. The radiation from the FOV traverses the FPI parallelized (α < αmax) in order to avoid the dependence of AAFPIonβ. Evidently, the etendue per pixel is thereby drastically reduced compared to the OP FPI instrument.
This setup (with band-pass interference filters instead of the FPI) was already employed for an SO2camera by Kern et al. (2010b), with a comparable entrance aperture (i.e., maximum incidence angle on the filters ≈αmax) and, thus, comparable etendue. However, for an FPI SO2 camera, the radiance reaching the detector is a factor of∼30–50 smaller (due to FPI reflection and the measurement at shorter wave-lengths; see Fig. 1). Even though the sensitivity of the FPI camera is a factor of∼2 higher (see Fig. 5), the SNR would be distinctly lower. Nevertheless, reduced interference with plume AOD and ozone background variation (see Sect. 3) may outweigh a reduced SNR (higher accuracy at lower pre-cision).
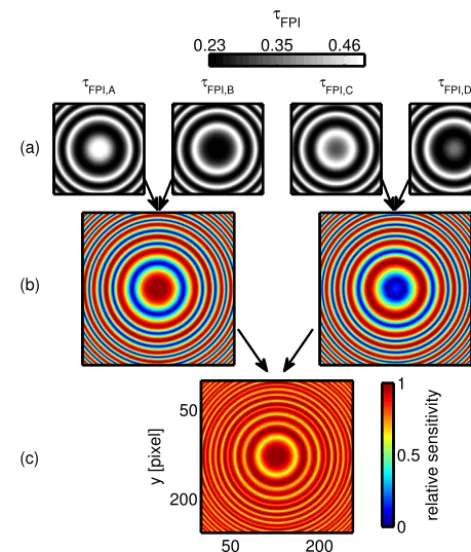
4.2.2 High etendue vs. sensitivity structure
Another implementation of a 2-D FPI camera achieving much higher light throughput is depicted in Fig. 6c. The FPI and the band-pass filter are mounted in front of a lens (lens 3), similar to the SO2camera setup of, e.g., Mori and Burton (2006). For an FOV≈20◦, the etendue is thereby in-creased by a factor of about 32 compared to the setup de-scribed in Sect. 4.2.1, because the radiation is not parallelized anymore. The maximum incident angleαon the FPI is now determined by the angle β=FOV
2 . Each detector pixel ob-serves a small, comparable set of incident angles α. How-ever, for a measurement involving two FPI surface separa-tions, the large range of incident angles α∈ [0◦,10◦]leads to rings of equal, partly vanishing SO2sensitivity on the 2-D detector (see Figs. 4 and 7b). To obtain a more or less con-stant SO2 sensitivity for the entire FOV (for the entire de-tector surface), a measurement has to employ more than two
τ
FPI,A τFPI,B τFPI,C τFPI,D
y [pixel]
x [pixel] 50 200 50
200
relative sensitivity
0 0.5 1 0.23 0.35 0.46
(a)
(b)
(c)
Figure 7. To obtain non-vanishing sensitivity throughout the entire
FOV, the FPI camera setup shown in Fig. 6c requires more than two measurement settings. (a) Distribution ofτFPIon a 2-D detec-tor for FOV≈20◦and two different FPI surface separation pairs (dAanddB=dA+dAB,dC=dA+12dABanddD=dA+32dAB). A homogeneous SSO2 distribution of 10
18molec cm−2 was
as-sumed. (b) Relative sensitivity distributions calculated for each of the d pairs with rings of vanishing sensitivity (blue) at different radii from the detector center. (c) Combining the distributions of
(b) yields non-vanishing sensitivity throughout the entire FOV. By
increasing the number of measurements with different FPI settings, the sensitivity distribution on the detector can be smoothed further.
FPI settings (e.g., more than two FPI surface separationsd). Figure 7 shows how employing a set of measurements with four different values of the FPI surface separationdarranged into two pairs (dAanddB=dA+dAB,dC=dA+12dABand dD=dA+32dAB) leads to an SO2sensitivity varying by only about 32 % across the entire FOV. By increasing the number of measurements with different FPI settings, the sensitivity distribution on the 2-D detector can be smoothed further.
5 Conclusions
parameters of the FPI were specified for SO2, and possible implementations of measurement setups were discussed.
We presented model calculations and compared the FPI method with the interference filter-based SO2 camera method. The FPI method exhibits a 1.3–2.5 times higher SO2 sensitivity. Moreover, a far higher measurement accuracy due to reduced dependence on radiative transfer is reached. For instance, at SSO2 =10
18molec cm−2, the deviations of the AA of SO2cameras were 38–54 % for a low plume AOD of approximately 1 and 110 % for an ozone background change of1SO3 =100 DU. In comparison, AAFPI deviated by only
<1 and 3 %, respectively.
As a one-pixel application, the introduced FPI technique has a higher radiation throughput compared to a common miniature spectrometer, while being of comparable size and weight. Thus, a better SNR is obtained and/or much faster measurements are feasible, while the selectivity and immu-nity to plume AOD and ozone background interferences are still quite good.
Three different imaging implementations were introduced. The first method is based on the whisk-broom imaging ap-proach using an OP FPI device. The second implementa-tion uses an optical system that ensures perpendicular illu-mination of the FPI. In a third approach, a higher radiation throughput is reached by allowing a larger aperture, leading to a non-perpendicular FPI illumination. The resulting varia-tions of the sensitivity across the detector can be partly over-come by using more than two FPI settings.
Besides SO2, the technique discussed in this paper can potentially be applied to study other gases with regularly spaced narrow-band absorption in the UV–VIS – like, e.g., BrO, OClO, or IO.
Acknowledgements. We would like to thank the editor Mur-ray Hamilton, the reviewer Robin Campion and an anonymous reviewer whose comments greatly helped to improve the manuscript. We acknowledge financial support by the Deutsche Forschungsgemeinschaft and the Ruprecht-Karls-Universität Heidelberg within the Open Access Publishing funding program.
Edited by: M. Hamilton
References
Barrett, J. J. and Myers, S. A.: New interferometric method for studying periodic spectra using a Fabry–Perot interferometer, J. Opt. Soc. Am., 61, 1246–1251, 1971.
Beirle, S., Hörmann, C., Penning de Vries, M., Dörner, S., Kern, C., and Wagner, T.: Estimating the volcanic emission rate and atmospheric lifetime of SO2 from space: a case study for K¯ilauea volcano, Hawai’i, Atmos. Chem. Phys., 14, 8309–8322, doi:10.5194/acp-14-8309-2014, 2014.
Bluth, G., Shannon, J., Watson, I., Prata, A., and Realmuto, V.: Development of an ultra-violet digital camera for volcanic SO2 imaging, J. Volcanol. Geoth. Res., 161, 47–56, 2007.
Bobrowski, N., Hönninger, G., Lohberger, F., and Platt, U.: IDOAS: a new monitoring technique to study the 2-D distribution of vol-canic gas emissions, J. Volcanol. Geoth. Res., 150, 329–338, 2006.
Bogumil, K., Orphal, J., Homann, T., Voigt, S., Spietz, P., Fleis-chmann, O., Vogel, A., Hartmann, M., Bovensmann, H., Fr-erick, J., and Burrows, J.: Measurements of molecular absorp-tion spectra with the SCIAMACHY pre-flight model: instrument characterization and reference data for atmospheric remote sens-ing in the 230–2380 nm region, J. Photochem. Photobiol. A, 157, 167–184, 2003.
Galle, B., Johansson, M., Rivera, C., Zhang, Y., Kihlman, M., Kern, C., Lehmann, T., Platt, U., Arellano, S., and Hidalgo, S.: Network for Observation of Volcanic and Atmospheric Change (NOVAC) – A global network for volcanic gas monitoring: net-work layout and instrument description, J. Geophys. Res. D, 115, D05304, doi:10.1029/2009JD011823, 2010.
Hönninger, G., von Friedeburg, C., and Platt, U.: Multi axis dif-ferential optical absorption spectroscopy (MAX-DOAS), Atmos. Chem. Phys., 4, 231–254, doi:10.5194/acp-4-231-2004, 2004. Kern, C., Deutschmann, T., Vogel, L., Wöhrbach, M., Wagner, T.,
and Platt, U.: Radiative transfer corrections for accurate spec-troscopic measurements of volcanic gas emissions, B. Vulcanol., 72, 233–247, 2010a.
Kern, C., Kick, F., Lübcke, P., Vogel, L., Wöhrbach, M., and Platt, U.: Theoretical description of functionality, applications, and limitations of SO2 cameras for the remote sensing of volcanic plumes, Atmos. Meas. Tech., 3, 733–749, doi:10.5194/amt-3-733-2010, 2010b.
Kern, C., Werner, C., Elias, T., Sutton, A. J., and Lübcke, P.: Apply-ing UV cameras for SO2detection to distant or optically thick volcanic plumes, J. Volcanol. Geoth. Res., 262, 80–89, 2013. Louban, I., Bobrowski, N., Rouwet, D., Inguaggiato, S., and
Platt, U.: Imaging DOAS for volcanological applications, B. Vol-canol., 71, 753–765, 2009.
Lübcke, P., Bobrowski, N., Illing, S., Kern, C., Alvarez Nieves, J. M., Vogel, L., Zielcke, J., Delgado Granados, H., and Platt, U.: On the absolute calibration of SO2cameras, Atmos. Meas. Tech., 6, 677–696, doi:10.5194/amt-6-677-2013, 2013.
McGonigle, A. J. S., Delmelle, P., Oppenheimer, C., Tsanev, V. I., Delfosse, T., Williams-Jones, G., Horton, K., and Mather, T. A.: SO2depletion in tropospheric volcanic plumes, Geophys. Res. Lett., 31, L13201, doi:10.1029/2004GL019990, 2004.
Millan, M. M.: Remote sensing of air pollutants, A study of some atmospheric scattering effects, Atmos. Environ., 14, 1241–1253, 1980.
Millan, M. M.: Aborption correlation spectroscopy, in: The COSPEC Cookbook: Making SO2measurements at active vol-canoes, edited by: Williams-Jones, G., Stix, J., and Hickson, C., IAVCEI, Methods in Volcanology, 1, 1–62, 2008.
Moffat, A. J. and Millan, M. M.: The applications of optical corre-lation techniques to the remote sensing of SO2plumes using sky light, Atmos. Environ., 5, 677–690, 1971.
tremor, degassing, and eruption dynamics via SO2imaging, Geo-phys. Res. Lett., 38, L01304, doi:10.1029/2010GL045820, 2011. Perot, A. and Fabry, C.: On the application of interference phe-nomena to the solution of various problems of specrtoscopy and metrology, Astrophys. J., 9, 87–115, 1899.
Platt, U. and Stutz, J.: Differential Optical Absorption Spec-troscopy: Principles and Applications (Physics of Earth and Space Environments), Springer, 2008.
Spinetti, C. and Buongiorno, M.: Vulcanic aerosol optical charac-teristics of Mt. Etna tropospheric plume retrieved by means of airborne multispectral images, J. Atmos. Sol.-Terr. Phy., 69, 981– 994, 2007.
volcanoes, in: Emissions of Atmospheric Trace Gas Compounds, Kluwer, Dordrecht, 296–303, 2004.
Vargas-Rodriguez, E. and Rutt, H. N.: Design of CO, CO2and CH4 gas sensors based on correlation spectroscopy using a Fabry– Perot interferometer, Sensor Actuat. B-Chem., 137, 410–419, 2009.
von Glasow, R., Bobrowski, N., and Kern, C.: The effects of vol-canic eruptions on atmospheric chemistry, Chem. Geol., 263, 131–142, 2008.