www.atmos-meas-tech.net/5/1869/2012/ doi:10.5194/amt-5-1869-2012
© Author(s) 2012. CC Attribution 3.0 License.
Measurement
Techniques
Soot reference materials for instrument calibration and
intercomparisons: a workshop summary with recommendations
D. Baumgardner1, O. Popovicheva2, J. Allan3, V. Bernardoni4, J. Cao5, F. Cavalli6, J. Cozic7, E. Diapouli8,
K. Eleftheriadis8, P. J. Genberg9, C. Gonzalez10, M. Gysel11, A. John12, T. W. Kirchstetter13, T. A. J. Kuhlbusch12,14, M. Laborde11, D. Lack15,16, T. M ¨uller17, R. Niessner18, A. Petzold19, A. Piazzalunga20, J. P. Putaud6, J. Schwarz15,16,
P. Sheridan15, R. Subramanian21, E. Swietlicki9, G. Valli4, R. Vecchi4, and M. Viana22
1Centro Ciencias de la Atm´osfera, Universidad Nacional Aut´onoma de M´exico, Mexico City, Mexico 2Nuclear Physics, Moscow, State University, Moscow, Russia
3University of Manchester, Manchester, UK
4Department of Physics, Universit`a degli Studi di Milano & National Institute of Nuclear Physics, Milan, Italy 5Institute of Earth Environment, Chinese Academy of Sciences, Xian, China
6European Commision – Joint Research Centre – Institute for Environment and Sustainability, Ispra, Italy 7Laboratory of Glaciology and Geophysics of the Environment, St Martin d’H`eres Cedex, France
8E.R.L, Institute of Nuclear Technology & Radiation Protection, N.C.S.R. Demokritos, 15310, Attiki, Greece 9Div. of Nuclear Physics, Lund University, P.O. Box 118, 22100, Lund, Sweden
10National Institute of Standards and Technology, Gaithersburg, MD, USA
11Laboratory of Atmospheric Chemistry, Paul Scherrer Institut, Villigen, Switzerland 12IUTA e.v., Air Quality & Sustainable Nanotechnology Unit, Duisburg, Germany 13Lawrence Berkeley National Laboratory, Berkeley, CA, USA
14King’s College London, Environmental Research Group, London, UK
15Earth Systems Research Laboratory, National Oceanic and Atmospheric Administration, Boulder, CO, USA 16Cooperative Institute for Research in Environmental Sciences, University of Colorado, Boulder, CO, USA 17Leibniz Institute for Tropospheric Research, Leipzig, Germany
18Technische Universit¨at, M¨unchen, Germany
19Deutschen Zentrums f¨ur Luft- und Raumfahrt, Oberpfaffenhofen, Germany
20Department of Environmental and Territorial Sciences, University of Milan-Bicocca & Department of Inorganic,
Metallorganic and Analytical Chemistry, Universit`a degli Studi di Milano, Milan, Italy
21RTI, Research Triangle, NC, USA
22IDAEA-CSIC: Institute for Environmental Assessment and Water Research (IDÆA), Spanish Research Council – CSIC,
Barcelona, Spain
Correspondence to: D. Baumgardner ([email protected])
Received: 24 February 2012 – Published in Atmos. Meas. Tech. Discuss.: 19 March 2012 Revised: 29 June 2012 – Accepted: 29 June 2012 – Published: 2 August 2012
Abstract. Soot, which is produced from biomass burning and the incomplete combustion of fossil and biomass fuels, has been linked to regional and global climate change and to negative health problems. Scientists measure the properties of soot using a variety of methods in order to quantify source emissions and understand its atmospheric chemistry, reactiv-ity under emission conditions, interaction with solar
radia-tion, influence on clouds, and health impacts. A major obsta-cle currently limiting progress is the absence of established standards or reference materials for calibrating the many in-struments used to measure the various properties of soot.
of 2011. The workshop was convened to summarize the cur-rent knowledge on soot measurement techniques, identify the measurement uncertainties and limitations related to the lack of soot SRMs, and identify attributes of SRMs that, if devel-oped, would reduce measurement uncertainties. The work-shop established that suitable SRMs are available for cali-brating some, but not all, measurement methods. The com-munity of users of the single-particle soot-photometer (SP2), an instrument using laser-induced incandescence, identified a suitable SRM, fullerene soot, but users of instruments that measure light absorption by soot collected on filters did not. Similarly, those who use thermal optical analysis (TOA) to analyze the organic and elemental carbon components of soot were not satisfied with current SRMs. The workshop, and subsequent, interactive discussions, produced a number of recommendations for the development of new SRMs, and their implementation, that would be suitable for the different soot measurement methods.
1 Introduction
Soot, a product of incomplete combustion of any carbon containing fuels under hot and air-starved conditions, is a constituent of atmospheric aerosol particles that has re-ceived the attention of the climate and health research com-munities because of the impact of soot-containing aerosol on modifying radiative fluxes and increasing the suscepti-bility to diseases that affect the respiratory, cardiovascular and nervous systems of humans. The term soot is used by the Intergovernmental Panel on Climate Change to denote any light-absorbing, combustion-generated aerosols (IPCC, 1996) whereas black carbon (BC) refers to the optical prop-erties of soot (e.g. Bond and Bergstrom, 2006, and refer-ences therein). We will use soot from here onward to in-dicate that we are interested in all of the properties of this type of aerosol particle, not just those related to light absorp-tion. The general term “soot” refers to combustion-generated aerosol mixtures of two components: first, the most thermally refractory and light absorbing byproduct of incomplete com-bustion, which is commonly referred to as elemental carbon (EC; thermal/optical analysis) or black carbon (BC; light ab-sorption methods); and second, organic carbon (OC) that can have a wide range of thermal and light-absorbing properties. Here we use “soot” to indicate the whole range of particles produced under the conditions described above, not merely EC or OC within such particles.
Although most countries that routinely measure air quality have established standards related to the mass of particulate matter below a diameter of 10 µm (PM10)or 2.5 µm (PM2.5),
very few have regulations related to acceptable levels of EC. It is interesting to note that the European Union (EU) has had a requirement to monitor elemental carbon (EC) in PM2.5at selected rural background sites since mid-2010
(Eu-ropean Council Directive 2008/50/EC). There is a techni-cal report (CEN/TR 16243, 2011) on thermal optitechni-cal trans-mittance/reflectance methods for measuring EC and OC, wherein thermal protocols (i.e. NIOSH-like, NIOSH5040, IMPROVE, and EUSAAR 2) are recommended.
The properties of atmospheric soot, i.e. its sizes, shapes, concentrations, absorption and scattering coefficients and chemical composition, are complex and can vary greatly, de-pending on many environmental factors. Many instruments have been developed for measuring some of these proper-ties, e.g. the light scattering and absorption at different wave-lengths and the concentration of organic and elemental car-bon (OC and EC). Significant progress has been made in the development of these sensors but obstacles common to al-most every technique remain. One obstacle is the lack of soot standard reference materials (SRMs) with properties specific to those that the instruments are designed to measure, and, optimally, are representative of soot found in the natural en-vironment. The lack of SRMs limits comparisons between different instruments and methods.
In 1999, a steering committee was formed to make rec-ommendations for representative and acceptable BC refer-ence materials for the environmental scirefer-ences community. This committee was made up of experts from the soil sci-ences community and hence their focus was primarily on the characterization of BC in soil, rivers, lakes and ma-rine environments. Their recommendations are reported by Schmidt et al. (2003) where they also underscore the grav-ity of methodological problems, using as an example a study on a set of soils which showed a factor of 500 dif-ference between BC concentrations measured with a range of techniques (Schmidt et al., 2001). The recommendations included (i) five matrices containing BC (soot, charcoal, aerosol, soil, and sediment), and (ii) five materials potentially creating BC during analysis for use in detecting methodolog-ical artifacts (the complete list of recommendations can be found at http://www.geo.unizh.ch/phys/bc). None of the ma-terials that were recommended, however, meet the require-ments that have been established by international standard-ization agencies (see below). The actions taken by the Steer-ing Committee for BC reference materials, while a positive step, have not produced a noticeable movement in the atmo-spheric sciences community, i.e. those doing air quality, cli-mate and health research, towards establishing a consensus with respect to soot SRMs.
instruments that measure soot properties. The one-day work-shop focused on: (1) reviewing the current state of technol-ogy for measuring some of the properties of soot, (2) iden-tifying potential candidates for SRMs and (3) formulating a viable plan for moving the state of soot measurement science forward through the development of SRMs that will be used by the environmental sciences community.
The workshop consisted of two sessions: (1) keynote pre-sentations that reviewed the technology and defined the is-sues related to the measurement of soot properties, and (2) working group discussions of solutions to the measure-ments problems and recommendations to implement them. The remainder of this paper summarizes the keynote pre-sentations and the findings and recommendations of the 50 participants that attended the meeting. The discussions from the workshop have been supplemented by the co-authors of this paper in order to clarify and provide sufficient detail to understand the issues. The following section summarizes the current state of the instrumentation for measuring soot properties, the techniques for calibrating and validating the technology and the major challenges that must be addressed. The third section reviews the currently available materials that could serve as SRMs for the different measurement tech-niques, and the final section is the summary and recommen-dations.
Note: a number of issues related to measurement tech-niques, interpretation of the results, calibration methodology, etc. are under continuing discussion. So that there is no pre-sumption that all of the material presented here meets with the complete acceptance of those who are co-authoring this article, sections that are written in quotations indicate ma-terial that might not reflect 100 % agreement of the partici-pants.
2 Calibration and validation of soot measurement techniques
Soot has many physical (size, shape, concentration, thermal behavior, mixing state, and solubility), optical (light scatter-ing and absorption) and chemical (OC, EC, inorganics, met-als and mineral impurities) properties that should be mea-sured for complete characterization. During the workshop, the focus was on filter-based and photoacoustic techniques for measuring the light absorption coefficient, on a laser-induced incandescence technique that measures the mass concentrations of refractory black carbon (rBC) and on ther-mal optical analysis techniques to derive OC and EC. In the following sections these measurement techniques are briefly described, including their uncertainties and limitations.
2.1 Challenges to light absorption measurements
The most common methods for determining the light absorb-ing properties of soot use measurements of light transmitted
through an aerosol-loaded filter or the sound waves created as soot particles increase the temperature in a sample cham-ber as they absorb light from an oscillating-intensity laser (photoacoustic techniques). Emerging technologies, such as cavity ring-down (e.g. Thompson et al., 2008), were not dis-cussed at the workshop because no representative from that community of users attended the meeting.
The issue of converting light absorption to a mass con-centration of BC was not discussed because of the many problems that are associated with arriving at an appropriate specific absorption cross-section with which to do this con-version. This problem has been discussed at length in many publications, i.e. Fuller (1994, 1995), Fuller et al. (1999) and Bond and Bergstrom (2006).
2.1.1 Light transmission methods
In general, instruments that use light transmission are: (1) rel-atively inexpensive to purchase and maintain; (2) small, lightweight and portable; (3) easy to operate; and (4) suit-able for long-term unattended operation (some models). In theory, the design is based on the assumption that the in-strument’s response to light absorbing aerosols is well un-derstood and relatable to “reference” absorption methods. In practice, particles are continuously deposited on a white filter, while the reduction in light transmittance (caused by the growing deposit of particles) through the filter is contin-uously monitored and related to the transmittance through a clean portion of the filter. The component of the attenua-tion caused by the light absorpattenua-tion by particles on the filter is determined by applying empirical calibration schemes or radiative transfer models of the combined filter and aerosol system. All of the filter-based methods rely on some sort of radiative transfer model to invert their data, although this is hidden from the user in consumer-grade instruments. The commercial instruments provide a value for the absorption coefficient, attenuation or black carbon mass concentration. It is generally accepted that additional correction factors are needed to take into account particle loading, light scattering, etc. There are numerous publications on the measurement and analysis techniques, e.g. Bond et al. (1999), Weingartner et al. (2003), Virkkula et al. (2005, 2007), Virkkula (2010), Arnott et al. (2005), Petzold et al. (2005) and Ogren (2010).
The major issues and questions, not necessarily indepen-dent, associated with the light transmission measurement technique that potentially could be addressed with SRMs are as follows:
– The absorption coefficient is the desired property but attenuation is what is actually measured; hence, does light absorption of aerosols on a filter truly represent aerosol light absorption in the atmosphere (i.e. sus-pended state)?
function of particle size, shape, refractive index, single scattering albedo (SSA), concentration, and history of the filter loading?
– Given that most instruments that measure light trans-mission require multiple correction schemes, which cor-rection is best suited for a range of different types of aerosols?
– How can results be scaled to different wavelengths?
– How will the choice of SRM influence the results?
– Does a particle’s size-dependent sensitivity (e.g. Lack et al., 2009; Nakayama et al., 2010; Moteki et al., 2010) influence the calibration?
– How do we account for changes in light absorption with changing relative humidity? Is this an issue that could be addressed with an SRM?
– What is the potential bias due to inorganic and organic aerosol (Lack et al., 2008) and liquid droplets contribu-tions to the attenuation (e.g. yellow beads observed by Subramanian et al., 2007)?
– What is the magnitude of correction needed for the effects of filter flexing/settling (from internal pres-sure/flow variations)?
The various correction schemes that are currently being ap-plied can partially account for some problems and issues listed above; however, the magnitude of each effect is diffi-cult to determine since many of the effects occur at the same time and superimpose themselves on one another. It is antici-pated that with the proper choice of SRMs, the magnitude of the various artefacts can be evaluated as well as the efficiency of the schemes to correct for them.
As previously noted, numerous methods have been devel-oped to correct for biases introduced by the artifacts and to decrease the measurement uncertainties. The goal of a cor-rection method is to find a unique relation between the instru-mental measurement signal(s) and the absorption coefficient of airborne particles. This approach requires an understand-ing of the variables that influence the signals, not only the optical, mechanical and electrical limitations of the sensor, but also parameters that are related to the particle proper-ties, e.g. ambient conditions and other atmospheric compo-nents such as relative humidity and condensing/evaporating gases. A detailed analysis is required to estimate the sensi-tivity of the measurement system to these parameters. Cor-rections for particle loading and light scattering were intro-duced by Bond et al. (1999) followed by additional refine-ments proposed by Weingartner et al. (2003), Virkkula et al. (2005, 2010) and Ogren (2010). A more sophisticated cor-rection was submitted by Petzold and Sch¨onlinner (2004), who used a four-stream radiative transfer model to take into account the contributions to the attenuation and reflectance
47 Figure 1: Data measured during two absorption photometer workshops (EUSAAR 2009, and RAOS) for different types of Aerosols. Correction schemes developed by Bond et al. (1999) and Virkkula et al. (2005, 2010) are shown as solid lines.
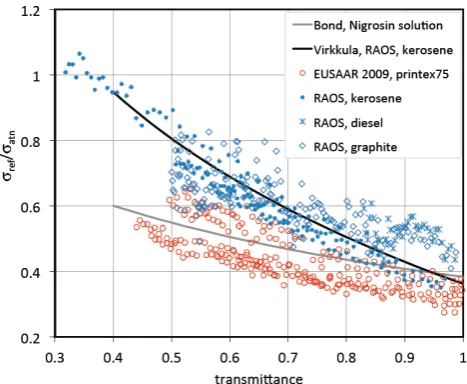
Fig. 1. Data measured during two absorption photometer workshops
(EUSAAR 2009, and RAOS) for different types of Aerosols. Cor-rection schemes developed by Bond et al. (1999) and Virkkula et al. (2005, 2010) are shown as solid lines.
by the light scattering from the particles on the filter. This requires multiple iterations that yield a unique solution for the particle absorption coefficient. Moteki et al. (2010) de-veloped radiative transfer equations describing the filter-based measurements, taking into account the filter absorp-tion and scattering optical depths, the asymmetry parameter, the filter geometry and material, and the particle penetration depth. In all cases, the models must be “adjusted” to fit to experimental observations.
An evaluation of many of the different correction algo-rithms has been carried out by comparing the model filter transmission functions with the transmittance measured from many experiments with different types of aerosols and parti-cle sizes. The transmission function is the ratio of a reference absorption coefficient,σref, to the attenuation,σatn, measured
by a commonly implemented filter-based instrument, the Par-ticle Soot Absorption Photometer (PSAP). In these experi-ments, the reference absorption coefficient was the collec-tion of measurements with a photoacoustic spectrometer (de-scribed in Sect. 2.1.2), and the transmittance was the ratio of the light through the aerosol-laden filter to the light through the aerosol-free reference filter.
As seen in Fig. 1, the filter transmission function for the PSAP varies widely, depending on the type of aerosol and the transmission functions predicted by the various correc-tion algorithms. The differences at this time have not been explained and from this figure we conclude that results from different calibration experiments can differ by up to 20 % be-cause of many partly resolved or unresolved problems that were listed above.
instruments of the same or different type (cf. M¨uller et al., 2011). These studies, using various types of light absorbing materials, showed that the differences were often related to the type of material used; however, given that none of them met the criteria as SRM (see Sect. 3.1), it was difficult to interpret the results, i.e. to relate them to a specific character-istic of the materials that were used in the comparisons.
2.1.2 Photoacoustic methods
The photoacoustic measurement technique is based on the principle that particles that contain material whose inter-nal energy is increased as they absorb photons will trans-fer that heat to the surrounding environment and raise the temperature (Petzold and Niessner, 1992; Arnott et al., 1999, 2000, 2003a, b, 2005; Arnott and Moosm¨uller, 2005; Lack et al., 2006). This principle is implemented by bringing the aerosols into a chamber and illuminating them with a oscil-lating laser. An acoustic wave, measured with a microphone, is generated by the increased temperature as the light absorb-ing particles heat the air. The amplitude of this wave is pro-portional to the absorption coefficient. As there are no inter-mediate filters involved with this technique, no corrections are needed for the artefacts introduced by the use of filters.
Unlike the filter-based technique for which no direct cal-ibration method currently exists, the photoacoustic sensors can be directly calibrated with reference gases of known absorption cross sections. For example, photoacoustic pho-tometers operating at 532 nm, the wavelength at the ground where the solar radiance is approximately at a maximum, can be calibrated with either NO2or O3. For longer wavelengths
where reference gases are not available, a less accurate cal-ibration method is used that measures the total extinction of the instrument’s laser through the absorbing aerosol and sub-tracts from it the scattering coefficient measured separately with a nephelometer (Lewis et al., 2008).
Using the ozone calibration method, Lack et al. (2006) independently validated the photoacoustic technique for aerosol using size-selected spherical Nigrosin dye. This study showed that this technique can measure aerosol ab-sorption to an accuracy of<=5 %. This compares to vary-ing estimates for filter-based absorption of 20–30% accuracy. Lack et al. (2009) went on to validate the photoacoustic tech-nique for measurement of the effects of internal mixing of an absorbing aerosol core. They showed that a photoacous-tic spectrometer (PAS) can measure the enhanced absorption due to internal mixing to an accuracy of ca. 5 %, in addi-tion to showing that the PSAP was not capable of measur-ing the same values. This study utilised calibrated (size and optical) absorbing PSL spheres. In addition to these valida-tions, the PAS technique has been compared to the “differ-ence method” for measuring absorption (extinction – scatter-ing) and shows robust correlations (Virkkula et al., 2005).
“Given this validation of the PAS on constrained systems such as size-selected Nigrosin and mono-disperse
absorb-ing polystyrene latex spheres (PSLs), in addition to the PAS performance against other methods of measuring absorption, the PAS can be rightfully set as a benchmark for measuring aerosol absorption.” With this in mind, it has been suggested that further uncertainties in the filter-based absorption meth-ods may exist, which are caused by organic aerosol coating the filter matrix, leading to absorption biases that are not ac-counted for in the standard filter-based absorption photome-ter corrections (Lack et al., 2008; Cappa et al., 2008).
2.2 Challenges to rBC, EC and OC measurements
Although there are a number of different techniques for mea-suring rBC, EC, OC and mixtures of these (soot), only the thermal optical analysis (TOA) and single particle incandes-cence techniques were discussed in depth. The TOA method evaluates mixtures of OC and EC and the incandescence technique looks at refractory black carbon (rBC), a form of carbon directly related to EC.
2.2.1 Measurements of refractory black carbon
The technique of continuous laser-induced incandescence has been implemented in the single particle soot photometer (SP2, Stephens et al., 2003; Schwarz et al., 2006) developed by Droplet Measurement Technologies (DMT). This tech-nique retrieves the refractive black carbon (rBC) mass con-tained in a particle from the amount of visible light emitted when the particle is heated to∼4200 K (Moteki and Kondo, 2010). Particles in the aerosol sample are aerodynamically directed into the center of a highly focused Nd:YAG laser beam (λ=1064 nm) with 100 % collection efficiency. Par-ticles containing at least ∼0.5 fg of rBC will heat as they absorb the incident photons and vaporize, emitting thermal radiation in the visible. The light emitted by individual par-ticles is collected by an incandescence detector, and its peak intensity is linearly proportional to the original rBC mass content of the particle over most of the mass range observed in the ambient. This relationship is largely independent of the morphology and independent of the mixing state of the rBC with other components (Moteki and Kondo, 2007; Slowik et al., 2007). In addition, light scattered by an individual parti-cle, as it interacts with the laser, is collected and can provide information about the mixing state of the particle (Gao et al., 2007; Moteki and Kondo, 2007). The incandescence in-tensity to rBC mass relationship is established using various materials whose rBC mass is known (Schwarz et al., 2006).
There are several calibration issues that the application of SRMs could address:
– The SP2 has a limited detection range in terms of rBC mass per particle, which has different implications than having limited sensitivity in terms of mass concentra-tion.
– The calibration curve is dependent on the chemical structure of the calibration material (Kondo et al., 2009). The SP2, for example, is ∼23–29 % less sensitive to fullerene soot than to Aquadag, which are two types of common calibration materials.
– There are uncertainties due to how the rBC mass of the calibration particle is selected, although the use of an aerosol particle mass analyzer (APM) will greatly re-duce this uncertainty.
– Calibration using pure rBC obtained by thermo-denuding ambient aerosol, coupled with an APM, pends on the removal of non-rBC coatings for mass de-termination, and thus raises questions about the effec-tiveness of such removal.
– There is an uncertainty in choosing the right calibration material for the sample studied, i.e. the calibration ma-terial should be representative of the environmental rBC being measured.
The SP2 measures rBC over a mass equivalent size range from approximately 80 nm to 900 nm (depending on the ver-sion of the SP2 used). In order to estimate the rBC mass outside the range of detection, the mass size distribution is fit with a log normal distribution. Since the majority of rBC mass in the environment is found in particles>80 nm, there is limited uncertainty in the estimate of mass below this size. However, if the ambient size distribution of rBC is non-lognormal, the uncertainty can be quite large when estimat-ing the rBC mass in sizes larger than the detection limit.
2.2.2 Measurements of EC and OC
When measuring the separate OC and EC components of soot, we are faced with the fundamental problem that the distinction between OC and non-organic carbon is somewhat arbitrary (e.g. Seinfeld and Pandis, 1998). There seems to be no measurement technique that is able to rigorously deter-mine the absolute amounts of EC and OC in a mixture of the two.
By definition, an atom should be regarded as EC only if imbedded in a large enough structure consisting EC only, in-dependent of its allotropic form (diamond, graphite, amor-phous). A few techniques can identify the nature of the atoms bonded to C in a material:13C-Nuclear Magnetic Resonance (Casabianca et al., 2010), including Distortionless Enhance-ment by Polarization Transfer Spectra (Schmidt-Rohr and
Mao, 2002), and Near-Edge X-ray Absorption Fine Struc-ture spectroscopy (Braun, 2005). However, C atoms can be well bonded to C atoms even in quite banal organic molecules like coronene or neopentane, for instance. Ex-tended X-ray Absorption and ExEx-tended Energy Loss Fine Structure Spectroscopy are sensitive to the neighbors of the target atom up to 0.6 to 0.8 nm (e.g. Castrucci et al., 2009), which is still small for a nano-particle, and even for a PAH molecule (about 3 cycles’ width). Calculated absorp-tion spectra for large PAHs show that the strength of the C–C bond still changes when shifting from C112H26 to C130H28
(Bauschlicher et al., 2008). In practice, although some of these techniques have been used for environmental analy-ses (e.g. apportioning the contribution of diesel exhaust and wood smoke in urban ambient PM, see Braun et al., 2008), they still are unable to distinguish amorphous or nanocrys-talline EC from large PAHs.
While EC allotropes do not present any common spectro-scopic peculiarity, all of the diamond, graphite, and amor-phous carbons have a very low vapor pressure (actually one of the lowest among all elements on the Earth). Indeed, the enthalpy of sublimation is >700 kJ mol−1 for graphite, as compared to 120 and 135 kJ mol−1for levoglucosan and cel-lulose tar, respectively (CRC, 2011). The very low volatility of EC is actually the basis for most current analytical tech-niques which try to separate OC and EC.
48 Figure 2 Thermograms from the analysis of a typical ambient sample with the (a) He4-870 and (b) He4-700 protocols. The thermograms are for parallel punches of the same filter. Dashed line indicates laser attenuation. There is clear loss of light-absorbing carbon in the mode of the He4-870 protocol but not in the He-mode of the He4-700 protocol. (Aerosol Science and Technology: Effect of Peak Inert-Mode Temperature on Elemental Carbon Measured using Thermal-optical Analysis, (40):763-780 Copyright 2006, Mt. Laurel, NJ. Reprinted with permission).
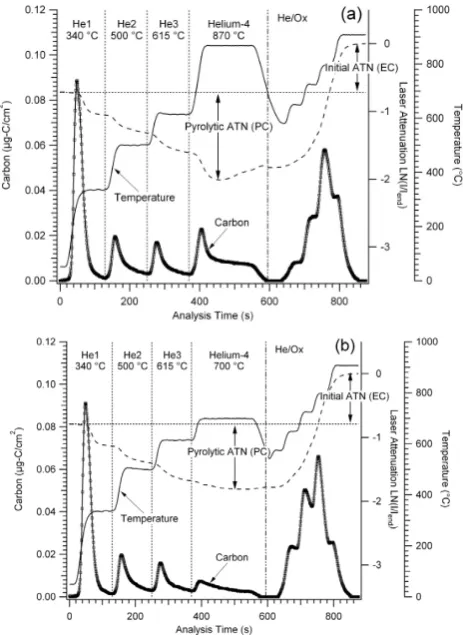
Fig. 2. Thermograms from the analysis of a typical ambient sample
with the (a) He4-870 and (b) He4-700 protocols. The thermograms are for parallel punches of the same filter. Dashed line indicates laser attenuation. There is clear loss of light-absorbing carbon in the He-mode of the He4-870 protocol but not in the He-mode of the He4-700 protocol (Subramanian et al., 2006).
a minimum value partway through the 870◦C temperature step of the He-mode (top panel) and then begins increasing, indicating premature evolution of EC. The bottom panel of Fig. 2 shows a thermogram from the He4-700 analysis of a second punch from the same filter shown in the upper panel of Fig. 2. The laser signal reaches its minimum value in the He4 step (700◦C) and does not increase until the He/Ox-mode suggesting no loss of EC in the He-He/Ox-mode. This does not guarantee that EC is not lost in the He-mode because the loss of EC could be offset by continued pyrolysis.
The relationship between the derived EC and the temper-ature protocol has been studied by a number of investigators (e.g. Chow et al., 2001, 2004; Yang and Yu, 2002; Conny et al., 2003; Schauer et al., 2003). Decreasing the temper-atures of the stages in the He-mode can increase the mea-sured EC due to OC not completely evolving or not pyrolyz-ing into light-absorbpyrolyz-ing carbon (Conny et al., 2003; Schauer et al., 2003). When the peak inert-mode temperature is set too high, this can also bias the OC/EC split due to premature EC evolution (Chow et al., 2001). The effect on the derived
OC/EC as a result of different temperature protocols is one of several factors that contribute to the uncertainty in measure-ments using these TOA techniques (other uncertainty factors are discussed further on in this section). The standard pro-cedure, recommended by the manufacturers of commercial TOA systems, for calibrating the TOA is to prepare precondi-tioned filters with organic material, like sucrose or potassium hydrogen phthalate (KHP), whose number of carbon atoms is precisely known.
These are then analyzed, providing an accurate procedure for relating the output of the analyzer of carbon dioxide or methane (depending on the TOA technique used) with the number of carbon atoms on the filter. This does not, however, test the fidelity of the technique for separating the EC from the OC since the carbon from these calibration materials con-tains no EC. Calibration may also be carried out by injection of CO2 directly into the combustion oven. the Sunset Lab.
instruments always inject a calibration amount of CH4 at the end of each analysis cycle. This is a standard procedure for certain semi-continuous analyzers, which may also be imple-mented for offline TOA instruments (Cavalli et al., 2010).
Intercomparisons between the TOA methods have shown that the temperature protocol and the optical detection tech-nique (transmission versus reflection) can make a significant difference in the measured EC content (Chow et al., 2001; Schmid et al., 2001; Schauer et al., 2003; Subramanian et al., 2006; Cavalli et al., 2010; Piazzalunga et al., 2011). Deter-mining the temperature at which all OC and no EC evolves in He, air or O2is challenging. It may be possible to determine
the temperature below which no known form of pure EC from any source evolves at a significant rate (still to be deter-mined). But this does not guarantee that organic molecules will evolve only below this temperature and, indeed, not all organic matter chars or evolves at a lower temperature than pure EC (Schauer et al., 2003).
“Low temperature protocols have been shown to overesti-mate EC in the presence of resilient organics, such as those recently detected by Piazzalunga et al. (2011) in aerosol sam-ples collected at a heavily polluted site. On the other hand, as previously noted, high temperature protocols can lead to the premature evolution of EC.” Inorganic matter such as mineral oxides and salts, found in biomass smoke or sea spray (such as KCl or NaCl), can also alter the temperature at which com-plex/large organic compounds and EC evolve off the filter (Novakov and Corrigan, 1995; Boparai et al., 2008; Wang et al., 2010). Hence, the temperature split point between OC and EC remains arbitrary.
leading to a significant reduction in PC formation both in washed and untreated samples (Chow et al., 1993; Piazza-lunga et al., 2011).
Another potentially important interference during TOA determination of soot is the presence of carbonate carbon (CC). This form of inorganic, refractory carbon produces an additional CO2signal and hence inferred carbon mass in
at-mospheric aerosol samples. Pure EC-OC RM may not pro-vide adequate simulation of atmospheric samples with sig-nificant CC content. CC is present in natural ground and building/demolition dust and is mostly related with coarse aerosol. Its contribution to total particulate carbon concentra-tion is generally considered negligible but this may not be the case in certain areas, such as Southern Europe and across the Mediterranean basin, where soil dust outbreaks are frequent and greatly increase the ambient PM air levels (Karanasiou et al., 2011; Robles et al., 2011). If CC is not taken into ac-count, concentrations of OC or EC may be overestimated, depending on the thermal protocol and position of the split point. The problem of a potential interference of CC with the signal of EC or OC has been mentioned, but not assessed, in several EC/OC inter-comparison studies (Jankowski et al., 2008). Recent research has also demonstrated that the pres-ence of metal oxides/carbonate mixture may lower the de-composition temperature in thermal/optical carbon analysis (Robles et al., 2011).
Determining the accuracy of different TOA techniques with ambient or atmospherically-relevant samples is difficult, however, since no technique can unambiguously determine the true value for the actual chemical composition – the frac-tion of OC/EC – of the sample. Hence, to assess the accu-racy of TOA techniques, reference materials for EC are nec-essary. Any material consisting of 100 % EC according to an elemental analysis (i.e. no H, no O, no N) could a pri-ori be regarded as a suitable reference material; however, the best standard for atmospheric EC determination would be the most reactive (i.e. least refractory) material among all kinds of soot produced by various techniques as long as it is pure EC. Ideally, a standard reference material should also be produced as a mixture of this EC with non-volatile organics prone to charring in thermal analysis, like e.g. ful-vic acids. For estimating soot reactivity in thermal oxidation processes, Schmid et al. (2011) established a relative reac-tivity index, based on one hand on calibration with an in-ert graphite, and on the other hand by a completely distorted (and hence enormously reactive) spark-discharge soot. This represents the range of achievable soot reactivity, and has be-come a valuable tool for the engine developers, who are eager to get highest soot reactivity for effective after-treatment.
3 Soot reference materials
The common theme, highlighted when summarizing the pri-mary obstacles for improving the accuracy and reducing the
uncertainties measurements of soot properties, was the need for SRMs for calibrating, validating and comparing instru-ments. The following sections present the various dimen-sions of this issue.
3.1 Defining the meaning of a reference material
According to the ISO Guide (2008), provided by the Interna-tional Organization for Standardization, reference materials (RM) are defined as:
Material, sufficiently homogeneous and stable with respect to one or more specified properties, which has been estab-lished to be fit for its intended use in a measurement process. The uses of RM may include the calibration of a mea-surement system, assessment of a meamea-surement procedure, assigning values to other materials, and quality control; how-ever, a single RM should not be used for both calibration and validation of results in the same measurement proce-dure. Calibration RMs, for example, are typically used to es-tablish scaling constants and determine the linearity of the various components of a measurement system, whereas val-idation RMs are needed to test the complete measurement system, preferably with material that represents the natural environment. The RM is characterized by a metrologically valid procedure for one or more specified properties, accom-panied by a certificate that provides the value of the specified property, its associated uncertainty, and a statement of metro-logical traceability. Uncertainties for such attributes may be expressed as probabilities. Metrologically valid procedures for the production and certification of reference materials are given in, among others, ISO Guide (2006, 2009).
The ISO Guide defines “certified” reference materials (CRM) as
Reference material characterized by a metrologically valid procedure for one or more specified properties, accompanied by a certificate that provides the value of the specified prop-erty, its associated uncertainty, and a statement of metrolog-ical traceability.
In the United States, the National Institute of Standards and Technology (NIST), previously the National Bureau of Standards, maintains many RMs and CRMs. There are a number of modes for assigning values to RMs for chemical composition. These take the form of certified value (C), ref-erence value only (R) or information only (I). These modes are:
– Certification at NIST using a primary method with con-firmation by other method(s) (C)
– Certification at NIST using two independent critically-evaluated methods (C, R)
– Value-assignment based on measurements by two or more laboratories using different methods in collabora-tion with NIST (R, I)
– Value-assignment based on a method-specific protocol (R, I)
– Value-assignment based on NIST measurements using a single method or measurements by an outside collab-orating laboratory using a single method (R, I)
– Value-assignment based on selected data from inter-laboratory studies (R, I)
The concept of the “Independent Methods” has been devel-oped at NIST using the following guidelines:
– One criterion for a standard sample is “Its composition should have been determined by independent and reli-able methods affording agreeing results” (Hillebrand, 1916)
– Modes of establishing the accuracy of National Bureau of Standards (NBS) RMs defined as “reference method, two independent methods, or interlaboratory compari-son” (Yolken, 1973)
– Three modes of measurement are used to assure that the values of the RM property(ies) are accurate. These are (a) definitive methods, (b) reference methods, and (c) two or more independent and reliable methods. (Cali and Reed, 1976). Adapted from Epstein (1991).
3.2 Potential soot reference materials
3.2.1 Currently implemented material
At present there are no materials that have been shown to meet either the ISO or NIST definitions for RM or CRM for soot properties. There are, however, numerous techniques for producing soot particles that might meet the requirements for an SRM. Some of these use methods to continuously produce soot particles while others are fabricated, put in a liquid sus-pension and bottled for application on filters or nebulization. Of the continuous type, those frequently used are:
– Laser breakdown of acetylene (Spanner et al., 1994)
– Soot recondensation from carbon filament (Niessner and Helsper, 1985)
– Laser ablation from solid graphite
– Aerosolization of pyrolyzable material
– Flame-derived soot production (Kirchstetter and No-vakov, 2007).
– Combusted kerosene soot (Popovicheva et al., 2003).
– Spark discharge soot (Helsper et al., 1993)
The fabricated particles, for example, are:
– Industrial carbon blacks (used in printing, plastics, coat-ings, e.g. Monarch 71, Printex #, Tokai Aqua Black 162)
– Absorbing polystyrene latex (PSL) spheres
– Absorbing glassy carbon spheres
– Nigrosin (synthetic dye)
– Aquadag (aqueous-based colloidal dispersion of ultra-fine graphite)
– Fullerene soot
– Tailored graphitized thermal soot (Popovicheva et al., 2011)
Note that many of these types of particles are not soot, per se, because they are not produced from combustion; however, they have some characteristics of soot that can be used to exercise a sensor in an instrument.
Within the context of how RM is defined in the ISO guide, we are looking for soot-like materials sufficiently homoge-neous and stable with respect to one or more specified prop-erties, which have been established to be fit for their intended use in a measurement process. This requires first defining the property of soot that we wish to measure, then assessing if a candidate RM is fit for its intended use. At the moment, the most frequently desired properties of airborne soot are (1) optical (scattering and absorption coefficients and asym-metry parameter), (2) physical (size distribution of number and mass concentrations), (3) chemical (mass of OC and EC, and (4) cloud forming potential, i.e. cloud condensation and ice nuclei (CCN and IN) fraction.
None of the potential RM listed above have been estab-lished to be fit for its intended use in a measurement process, i.e. each of the materials has been used in one or more appli-cations to test the operation of a measurement system and, in some cases, to even calibrate instruments; however, the com-munity of instrument users have not reached a consensus re-garding either the soot material (or proxy) or the method to apply them.
49
Figure 3 The angstrom exponents calculated from a multi-wavelength PSAP
and Aethalometer measurements of different types of light absorbing particles
are compared in this figure.
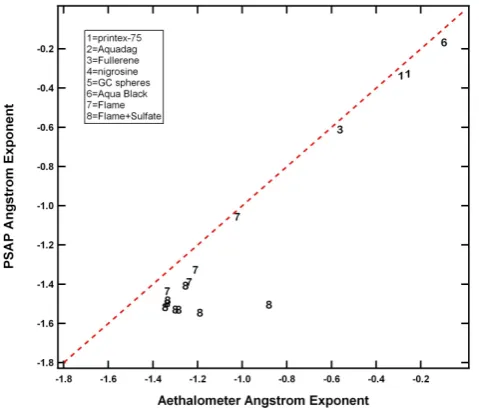
Fig. 3. The angstrom coefficients calculated from a
multi-wavelength PSAP and Aethalometer measurements of different types of light absorbing particles are compared in this figure.
and OC/EC concentrations could be used in both types of in-struments. Similarly, the SP2 and photoacoustic instruments measure the aerosols suspended in air passing through their sample chambers. If an SRM can be generated with known light absorption cross section and mass concentration of rBC, then it would be a useful RM for comparing the two types of instruments, as well as calibrating and evaluating them under different conditions.
In the following four sections the individual SRM needs of the different measurement techniques are dis-cussed, with mention of potential overlapping requirements, as appropriate.
3.2.2 SRM for filter-based light transmission techniques
At the moment, none of the filter-based techniques are cur-rently being calibrated or compared using SRMs whose char-acteristics are well defined with respect to their optical prop-erties. During the EUSAAR2009 experiments (M¨uller et al., 2011), the responses of several Aethalometers and PSAPs were evaluated against test aerosol including absorbing PSL spheres. Absorbing PSL has many features of an attractive RM that has discrete sizes and whose optical properties are known. In these experiments, it was observed that the PSL type used, although non-absorbing at 781 nm, could be used for other regions of the spectral range. The correction algo-rithms applied for the conversion of the attenuation signal to absorption coefficient gave consistent results but with signif-icant variability, up to 30 %, compared to the photoacoustic reference instruments. These types of particles, however, do not represent atmospheric soot. They may be convenient for some types of comparisons or calibrations but they do not
ad-50
Figure 4 The absorption coefficients measured with a PSAP and Aethalometer
are compared for different types of light absorbing particles in the top panel. In
the bottom panel two photoacoustic absorption spectrometers are compared with
the same set of materials.
Fig. 4. The absorption coefficients measured with a PSAP and
Aethalometer are compared for different types of light absorbing particles in the top panel. In the bottom panel, two photoacoustic absorption spectrometers are compared with the same set of mate-rials.
dress the problems that arise due to the more complex mix-tures of EC, OC, dust and inorganics found in the natural environment.
As seen in this figure, there is relatively good agreement between the derived exponents for Printex-75, Fullerene, Aqua Black and flame soot (Kirchstetter and Novakov, 2007). When the flame soot is mixed with various fractions of ammonium sulfate, however, a large amount of varia-tion is seen, with the PSAP remaining constant while the Aethalometer varies by more than 50 %. Although correc-tions had been applied to the PSAP and Aethalometer mea-surements, no efforts have been made at this time to evaluate these discrepancies by applying the various models that are currently being debated in this community of users.
Figure 4 (bottom panel) shows comparisons of the absorp-tion coefficient measured by two PAS units, one built at the Desert Research Institute (DRI) and the other, using a simi-lar design, built by Droplet Measurement Technologies. This comparison shows that the agreement is quite good over the entire range of light absorbing materials. In the top panel of Fig. 4 is a similar comparison, using the same range of particle types, between an Aethalometer and PSAP at the same wavelength. The agreement between the two filter-based techniques is reasonably good, but as with the compar-ison of the Angstr¨om exponents, introducing the ammonium sulfate mixed with flame soot increases the variability.
At this time, it is not clear if any of the aforementioned materials listed in Sect. 3.2.1, or the light absorbing particles used in the comparisons shown in Figs. 3 and 4, can serve as SRM for filter-based light absorption measurement tech-niques since not all of them have had their optical properties sufficiently characterized. Compounding the problem is that, to date, no methods have been developed that can be used to apply a known, repeatable amount of SRM to the filters used in these techniques. One of the challenges for implement-ing a soot SRM, once appropriate materials are selected, is the application of the material to the instrument since instru-ments like the Aethalometer measure changes in the attenu-ation as the aerosol particles accumulate on the filter. Hence, the SRM cannot just be weighed and deposited on the fil-ter, but will possibly need some type of delivery system that provides the SRM at a known concentration rate.
3.2.3 RM for photoacoustic light absorption techniques
The users of the PAS technique can use the same SRMs that are developed for evaluating filter-based techniques, as was illustrated above in the examples shown in Figs. 3 and 4. Al-though those particular examples suggest that the PAS tech-nique does not appear to be sensitive to the composition of the particles, this specific test was carried out at only a single wavelength of 870 nm. A much broader evaluation is needed at shorter wavelengths to assess the sensitivity of the PAS technique to materials like dust and some types of OC pro-duced by wood burning that are known to absorb in the ultra-violet wavelengths.
3.2.4 RM for laser-induced incandescence techniques
The majority of SP2 users belong to an active working group that discusses issues related to SRMs for calibration and comparison and methodologies for administering the SRMs. At present there are four materials commonly used to abso-lutely calibrate SP2: glassy carbon spheres, fullerene soot, Aquadag and thermally denuded ambient rBC.
3.2.5 RM for TOA techniques
A number of potential SRM candidates for TOA have been introduced in recent years (Yang and Yu, 2002; Chen et al., 2004; Klouda et al., 2005); however, none have been universally accepted as a standard by those who measure the OC/EC component of soot. For example, a filter-based NIST standard, reference material 8785, was specifically de-veloped with the intent of calibrating TOA methods. This RM is produced by resuspending urban dust (NIST stan-dard 1649a) and filtering it with quartz fiber filters (Klouda et al., 2005). These filters were evaluated with a number of standard methodologies – the Interagency Monitoring of Protected Visual Environments (IMPROVE) and Speciation Trends Network–National Institute of Occupational Safety and Health (STN–NIOSH) protocols (Chow et al., 1993; Birch and Cary, 1996; NIOSH, 1999) – with mixed results. The total carbon, i.e. the sum of the EC and OC, agreed quite well; however, the measured fraction of OC differed by more than 60 % (Klouda et al., 2005). The source of the differ-ences between the two techniques was not resolved other than concluding that the separation of EC and OC is method-dependent with no way to assess which of the two protocols was providing the “correct” value.
There are a number of materials, listed in Sect. 3.2.1, that are currently being used by various researchers. One of these that has been well documented (Stipte et al., 2005; Kirch-stetter and Novakov, 2007) is diffusion flame soot, produced by burning methane in an inverted flow reactor. It has two reported advantages that make it a potential SRM: (1) the particle generation is stable and repeatable in size and con-centration, and (2) the stability of the flame facilitates col-lection of the particles on a filter. The CAST soot generator (http://www.sootgenerator.com/) also uses a well defined dif-fusion flame from either gaseous or liquid fuel and has the same advantages. Although these characteristics have been reported in the open literature, there remains the need for much more extensive studies that substantiate the proper-ties that would confirm that the diffusion flame soot could be used as an SRM.
studies of soot microstructure, composition, reactivity and oxidation. It is not, however, a combustion aerosol. It is used, in context with the comparison to an inert graphitic soot, to represent the full range of oxidative reactivity (Schmid et al., 2011).
A recent development (Popovicheva et al., 2011) is the creation of tailored soot whereby graphitized thermal soot is precisely coated with a known amount of organic carbon. With this approach, the EC/OC ratio is precisely controlled such that TOA techniques can be evaluated with respect to temperature protocols, repeatability, etc. Given that previ-ous round-robin tests and intercomparisons of different tech-niques using urban dust or ambient samples experience the largest discrepancies when evaluating the EC/OC split, a tai-lored reference material where this ratio is well-known has a distinct advantage. It should be noted, however, that one requirement from the aerosol community that was openly stated is that the EC and the OC/EC ratio of such a mate-rial should resemble the EC and the OC/EC ratio of ambient aerosol, as should its refractivity. The tailored materials do not as yet meet this requirement because the EC in these ma-terials evolves at a much higher temperature (>800 °C) than ambient EC. Work is currently underway to produce a tai-lored RM with EC that evolves at a lower temperature.
Any of the above sources of soot have the potential for serving as SRM for use with TOA; however, they must be homogeneously deposited on clean filters with a well-known mass within the appropriate concentration range for each instrument to avoid saturation. The tailored soot, i.e. OC-coated graphitized thermal soot, can be placed directly in the oven of the TOA instrument, on a clean quartz substrate, thereby avoiding issues associated with contaminated filters. It is important that the method of application, i.e. how the RM is introduced to the measurement system, does not affect the response of the TOA to the SRM and that the method of application is a part of the SRM protocol. In addition, if the EC/OC fraction is to be determined, then this parameter must be fully characterized for the selected SRM and remain constant with time.
4 Recommendations
During the course of the working group discussions, numer-ous suggestions were put forward by the participants related to how the problems associated with the lack of SRMs might be resolved. In general, irrespective of the measurement tech-nique, SRMs are needed for addressing several pervasive problems:
– Calibrating sensors with environmentally relevant parti-cles.
– Understanding measurement artifacts.
– Comparing data sets taken with similar or different tech-niques.
The recommendations that evolved from the discussions were related to resolving these problems and fall into two general categories: (1) SRM materials and application methodologies, and (2) user and manufacturer responsibili-ties. We have tried to consolidate the many suggestions and ideas that evolved during the meeting into a concise few that can most easily be implemented with application of realistic resources.
4.1 SRM materials and application methodologies
4.1.1 Light absorption techniques
Recommendation for calibrating filter-based light absorp-tion instruments: a reference material with a well defined light absorption cross section and a methodology for using it should be developed.
At the moment there are no procedures to calibrate filter-based instruments that use the measurement of light atten-uation to derive the absorption coefficient. Ideally, the ap-proach would generate the calibration particles with known size and concentration to be sampled by the instruments with their normal inlet system. Given the many issues related to artifacts due to light scattering, humidity, loading, etc., the generated particles or the reference filter with the deposited particles will need to be carefully characterized with respect to the optical properties and the repeatability. The primary purpose is to provide a way to verify that the instrument is operating within the expected uncertainties.
Recommendation for understanding measurement arti-facts in filter-based light absorption instruments: a set of ref-erence materials with well known properties, and a method-ology for using them, should be developed.
The light absorption coefficient is derived from the mea-surement of light attenuation through the use of various op-tical models that take into account the various interferences that produce artifacts and bias the results. Given that these artifacts are sensitive to the properties of the soot aerosols, i.e. size distribution, scattering coefficient and chemical com-position, models need to be evaluated with a wide variety of reference materials that have had these properties completely characterized. The particles should be representative of rel-evant aerosol types, e.g. ambient aerosols and combustion particles. A broad range of relevant aerosol optical proper-ties, e.g. single scattering albedo, scattering and absorption, Angstr¨om exponents and extinction, should be covered by the aerosols used in the model evaluations.
Recommendation for evaluating and comparing instru-ments: Design and conduct an international experiment to compare and evaluate techniques for measuring light ab-sorption.
52
Figure 5 This figure, taken from Laborde et al. (2012a) illustrates the response
of an SP2 to a range of reference materials and ambient particles.
Fig. 5. This figure, taken from Laborde et al. (2012a) illustrates the response of an SP2 to a range of reference materials and ambient particles.
discussed, a number of valuable laboratory studies have been conducted that evaluated instrument performance of selected types of instruments; however, none of these studies were done using reference materials with well characterized prop-erties. The recommended study would include as many of the different techniques as possible, i.e. filter-based, photoa-coustic, cavity ring-down, etc., with more than one instru-ment representing each technique. This type of study, using SRMs with known properties, would provide a balanced, un-biased evaluation that would assess the respective strengths and weaknesses of the different techniques and help estimate the uncertainties as a function of the SRM properties. In ad-dition, it would help to identify the best optical model for correcting the artifacts in filter-based methods.
4.1.2 Refractory black carbon measurements
Recommendation for calibrating and comparing single par-ticle laser incandescence techniques: a centralized source of well characterized fullerene soot is needed.
The community of SP2 users, in concurrence with recent publications (Moteki and Kondo, 2010; Gysel et al., 2011; Laborde, et al., 2012a), have identified fullerene soot as the best SRM for calibrating and comparing the SP2s because of its similarity to ambient refractory black carbon (Fig. 5). Calibration particles are ideally selected by mass using an APM or a centrifugal particle mass analyzer (CPMA). How-ever, these instruments are not widely available to most SP2 users. Hence, the established calibration method is to use a
differential mobility analyzer (DMA) to select the particles by their mobility diameter. This requires knowledge of the calibration materials effective density (mass – mobility re-lationship), which may vary from batch to batch (Laborde et al., 2012a). Therefore a central source of well character-ized fullerene soot is needed to assure reproducibility and accuracy of SP2 measurements by different research groups. The developer and vendor of the SP2, Droplet Measurement Technologies, is in the best position to act as this source.
An alternative option is needed for SP2 calibrations per-formed in the interim until the central source of fullerene soot is available, as well as to allow previous SP2 measurements to be related. Aquadag based SP2 broadband incandescence calibration curves can be recalculated to fullerene soot equiv-alent SP2 calibration, assuming a linear calibration with axis intercept at zero, using the following approach:
sFSeq(mBC)=
sAQ(mAQ)
m AQ
rFS2AQmBC. (1)
sFSeq is the fullerene soot equivalent SP2 signal amplitude
as a function of BC mass (mBC), i.e. the fullerene soot
equivalent calibration curve, sAQ is the measured SP2
in-candescence signal amplitude for Aquadag as a function of Aquadag mass (mAQ), i.e. the Aquadag calibration curve,
andrFS2AQis the ratio between the SP2’s signal amplitudes
53
Figure 6: Calibration curves of an SP2 for fullerene soot (blue line), diesel car BC
(black line) and Aquadag (solid red line) from Laborde et al. (2012a). The red line
shows a fullerene soot equivalent calibration obtained by recalculating the
Aquadag calibration using eq. 1 and a correction factor of ~rFS2AQ=0.75, as
determined at a BC mass of 8.9 fg in an intercomparison of 9 SP2 instruments
(Laborde et al., 2012b).
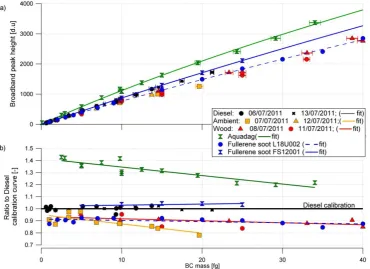
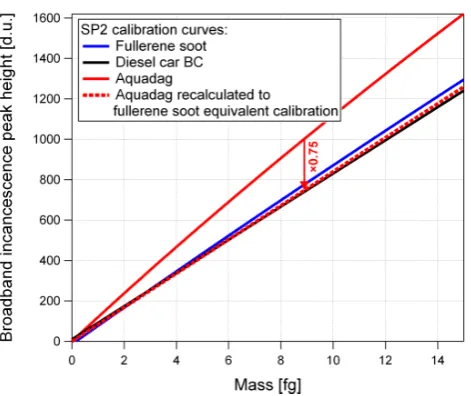
Fig. 6. Calibration curves of an SP2 for fullerene soot (blue line),
diesel car BC (black line) and Aquadag (solid red line) from Laborde et al. (2012a). The red line shows a fullerene soot equiv-alent calibration obtained by recalculating the Aquadag calibration using Eq. (1) and a correction factor of∼rFS2AQ=0.75, as
de-termined at a BC mass of 8.9 fg in an intercomparison of 9 SP2 instruments (Laborde et al., 2012b).
instruments, with an average value ofrFS2AQ=0.75 at a BC
mass of 8.9 fg (Laborde et al., 2012b). Consequently, the fullerene soot equivalent SP2 calibration should be derived from the Aquadag calibration curvesAQat an Aquadag mass
nearmAQ=8.9 fg, as done in Fig. 6. This particular mass
was chosen in the range where ambient BC mass size distri-butions typically peak. This is valid for SP2s of the current generation, which use a H6779 photomultiplier tube (Hama-matsu Inc., Japan) behind a Schott KG-5 filter to measure broadband incandescence signals. Hence, in general practice until more complete calibrations can be carried out, a sin-gle aquadag calibration at mobility diameter 300 nm (8.9 fg aquadag mass) is sufficient to determine the broadband SP2 sensitivity to ambient rBC after application of the 0.75 factor to the modal peak height.
4.1.3 Organic and elemental carbon measurements
Recommendation for calibrating TOA instruments: the com-munity of TOA users must agree on the best reference ma-terials for calibrating the system response to OC, EC and mixtures of OC and EC.
The largest uncertainties and limitations when measuring OC and EC with the TOA technique are due to artifacts in-troduced by the pyrolysis (charring) of OC into EC. Various protocols have been implemented to minimize these artifacts but to date none have been universally accepted, largely be-cause of the complexities related to the determination of the “true” OC and EC values and the validation of the optimum protocol.
The corrections that are applied in TOA to account for these artifacts rely upon measurements of the transmission through or reflectance of light from the aerosol loaded fil-ter as it is heated to defil-termine when charring occurs. There can be significant uncertainties associated with this correc-tion due to differences in the specific mass absorpcorrec-tion of na-tive EC and the formed char, as well as the temperature pro-tocol that is used, as was demonstrated in the example shown in Fig. 2 (Subramanian et al., 2006). These uncertainties must be accurately identified and quantified with SRMs with well known properties.
Given that the calibration procedure of TOA systems, at this time, is only for OC, a reference material is needed for calibrating these systems over the entire temperature range so that EC is included. A number of candidates for this mate-rial have been identified, in particular flame generated soot or tailored graphitic thermal soot; however, the workshop ended with no consensus with respect to selecting an SRM. Once the EC material is agreed upon, the response of the TOA to mixtures containing refractory and charring OC can be eval-uated. Additional, intensive campaigns are needed to demon-strate the advantages and disadvantages of any SRM.
Recommendation for understanding measurement arti-facts in TOA systems: a set of reference materials with well known properties, and a methodology for using them, should be developed.
SRMs that contain chemical compounds other than OC and EC are needed to evaluate the artifacts that are introduced by the presence of these compounds. In addition to uncertain-ties related to charring during the derivation of OC and EC in soot, when various salts or metal oxides are present, there can be a catalytic degradation of the EC during the tempera-ture stage when OC evolves. This is an additional artifact that produces a positive bias in the derived OC (i.e. Novakov and Corrigan, 1995; Yu et al., 2002; Subramanian et al., 2006; Cavalli et al., 2010; Hitzenberger and Rosati, 2010; Bladt et al., 2012). Once the SRM has been selected for the cali-bration of OC and EC response and evaluation of protocols to reduce charring, known quantities of various salts, metal oxides, refractive organic compounds and fulvic acids can be introduced to better quantify the relationship between EC degradation and the presence of non-OC/EC material con-centrations.
As with the use of SRM mixtures to quantify the interfer-ence of salts and metal oxides, mixtures of SRM with known fractions of CC would help evaluate the relative impact of this source of measurement artifact.
4.2 Manufacturer and user responsibilities
Instrument manufacturers have a major responsibility to serve their customers and the broader scientific community to help improve the quality of the measurements. These compa-nies should be active participants in the process of develop-ing SRMs appropriate for their measurement systems, then provide access to these reference materials so that instru-ment performance can be measured in a consistent way. In addition, they could provide an invaluable service by main-taining a database of results from instrument intercomparison studies. This would provide a historical range of comparison values among instruments and instrument types as well as information on the magnitude of the discrepancies related to the choice of reference materials and comparison method.
Recommendation for user involvement: users of soot mea-surement systems are responsible for (1) implementing the calibration and correction procedures accepted by the gen-eral community of those who use the instruments, (2) under-standing their instruments and the reasons for performance variability, (3) keeping records of past instrument compar-isons and performance checks and (4) participating in activ-ities that improve the quality of the measurements.
The reference material workshop was a very positive step towards bringing together interested and concerned scien-tists whose desire was to move forward the efforts to find or develop SRMs that will improve the quality of data that we obtain from the present suite of instruments. The com-munity of SP2 users (http://www.dropletmeasurement.com/ user-community.html) has set an example of the progress that can be made when users focus on a problem and reach agreement on how to solve it. There is a similar group of those who use filter-based instruments (see list of co-authors of M¨uller et al., 2011) to measure light absorption and who are presently interacting in an open forum to try and reach an agreement on how to correct for artifacts. This group needs to expand their efforts to find SRMs appropriate for their needs. A large fraction of the workshop attendees are those who use TOA in their research and have published many articles describing the uncertainties and limitations that remain to be resolved. There is a strong need for a working group to be formed, similar to the group within CEN (Comit´e Europ´een de Normalisation), that will bring these researchers together to select or develop the SRMs that will help resolve these problems.
5 Conclusions
The large attendance at the soot workshop underscored the interest in the scientific community in the improvement of measurements of soot properties and highlighted the serious issues that are still impeding progress towards a better un-derstanding of the formation and evolution of this type of particle that has such a large impact on climate and health.
The calibration, validation and intercomparison of tech-niques that measure soot properties require standard
refer-ence materials (SRM) whose properties are related to the characteristic being measured. At this time there are no SRMs that meet all criteria established by internationally rec-ognized organizations that set reference standards (with the exception of the German Standardization Organization for VDI/DIN that has accepted the spark-discharge carbon par-ticle aerosol generator as a standard). The participants of the soot reference material workshop unanimously agreed that SRMs are needed for every measurement approach for eval-uating soot properties. Although certified reference materi-als (CRM) are needed for some applications, only SRMs are seen as feasible at present.
A number of potential candidates for SRMs have been pro-posed for the three categories of instrumentation: light ab-sorption, laser-induced incandescence and TOA. The user’s group for SP2s is converging on accepted SRMs for their ap-plications. Development of SRMs for light absorption and TOA will require a similar level of dedication and collabo-ration by users of the instruments that make these measure-ments.
A number of recommendations have evolved from the workshop that can help propel the selection or development of SRM. These recommendations do not require an inordi-nate amount of economic or human resources and can serve as legitimate motivation and justification for approaching funding agencies with requests to support these efforts to im-prove soot measurements.
Acknowledgements. The workshop on soot reference materials
was sponsored by the Gesellschaft f¨ur Aerosolforschung (GAeF), Droplet Measurement Technologies, Sunset Laboratory and Magee Scientific. We would like to thank these organizations and businesses for their financial and moral support. We would also like to thank all of the participants for their valuable feedback during the meeting and afterwards during the preparation of this review manuscript. O. Popovicheva and M. Viana thank the Russian-Spain CSIC-RFBR 11-08-93989 project for SRM testing and travel support.
Edited by: W. Maenhaut
References
Arnott, W. P. and Moosm¨uller, H.: Method and apparatus for photoacoustic measurements, edited, Desert Research Institute, Reno, NV, USA, 2005.
Arnott, W. P., Moosm¨uller, H., Rogers, C. F., Jin, T., and Bruch, R.: Photoacoustic spectrometer for measuring light absorption by aerosols: Instrument description, Atmos. Environ., 33, 2845– 2852, 1999.