ANALYSING THE PERFORMANCES OF 4TH YEAR PRIMARY SCHOOL STUDENTS IN EDIRNE IN SCIENCE AND TECHNOLOGY COURSE, “LET’S SOLVE THE RIDDLE: OUR
BODY” CHAPTER THROUGH DATA MINING Tolga Demirhan, Özlem Uçar
Trakya University, Balkans Campus, 22030 Edirne, Turkey
Abstract
Data mining serves an important function in providing meaningful, understandable and guiding information to various units or institutions, using data sets with a large number of instances, which are formed by numerous features that may be meaningless when dealt with separately. In this study, a questionnaire and a test were applied to 4th year primary school students on a voluntary basis and the results of the questionnaire and test were analyzed using the algorithms of Weka software, which is a data mining application tool. The study aimed to determine the factors that have an effect on student performance through the detection of the best classification algorithm for the data sets of different sizes. Following the application, the algorithms were compared according to the rate of correct estimates, Kappa statistics, F-measure and Root-Mean-Square Error. As a result, Random Forest algorithm was found out to be the most accurate classification algorithm. Moreover, the education level of the participants’ fathers and level of income were discovered to be the two factors that have the strongest effect on student performance.
Keywords: data mining, weka, success analysis, primary education
1. INTRODUCTION
The application of machine learning algorithms in order to obtain information from data sets that have a large amount of instances that are formed by various features which do not have a meaning when dealt with separately is called data mining. (Alpaydın, 2004; Güner N., Çomak E., 2011)
In order to form data set records in studies with students, questionnaires or tests prepared by the researcher or student information systems that are used in schools are utilized. Data mining studies in education are summarized below:
In a study by S. Özarslan and N. Barışcı (2014), a course performance analysis was conducted with Weka using the course grades, departments, genders etc. as variables. The study compared the course performances of two groups of students taking ENF-101 face-to-face and in the form of distance education. (Özarslan, S., Barışçı, N., 2014)
In the study conducted in 2012 by M.A. Alan, an application was performed using the data set that was collected from the students of Cumhuriyet University Institute of Social Sciences. Graduate student data was used in order to discover the most accurate classification algorithm and to find out if the students’ program, gender, place of birth, being employed as a research assistant and the semester of the course had an effect on course grades. (Alan, M. A., 2012)
In the study conducted by G. Ekren in 2012, a data mining application was performed on the registry data of the students admitted in 2010-2011 academic year to Sinop University using WEKA, which is an open-source data mining software. (Ekren, G., 2012)
According to the results of a research, which had a data set of the university entrance scores of 434 students admitted to Pamukkale University Faculty of Engineering, made by N. Güner and E. Çomak in 2011, it was found out that the maths, science and Turkish language test scores of the students along with their graduation grades could predict the performances of the students in Mathematics I course. The machine was trained with the data from 289 students and the data from 145 students were used for the test. Through this method, 86% of student performances in Mathematics I were predicted accurately. (Güner, N., Çomak, E., 2011)
A study conducted by Y. Z. Aylık, A. Özdemir and U. Yavuz in 2007 investigated the relationship of the faculties that the students of Atatürk University were admitted to and the type of high school they graduated from along with their high school graduation grades. (Aylık Y. Z., Özdemir A., Yavuz U., 2007)
2. METHODOLOGY
The most common process in data mining is the CRISP-DM (Cross Industry Standard Process for Data Mining), which was developed by a consortium, formed by a few companies selling DM tools and the first institutions which adapted DM applications to business activities. CRISP-DM (Cross Industry Standard Process for Data Mining) was developed by Daimler-Chrysler (later known as DaimlerBenz AG, Germany), NCR Systems Engineering, Copenhagen (Denmark), SPSS (England) and Ohra Verzegireingen en Bang Groep B.V (The Netherlands). CRIST-DM is an incremental process identifying the fundamental steps in data mining for knowledge discovery. The steps in the process are as follows: (Fernandez I. B. et al., 2002; Küçüksille, E. 2009)
1. Identifying the problem 2. Creating the database 3. Preparing data
4. Preparing data for modelling 5. Forming the model
6. Evaluating the model.
7. Applying the model and monitoring the results. (S. Özarslan, N. Barışçı, 2014)
Models in data mining can be studied under two headings, predictive and descriptive (Zhong, N. et al., 1999; Özarslan S, Barışçı N. 2014). In predictive models, the aim is to develop a model using specific instances and to predict the final values related to clusters of data using that model. (Seidman, C. 2001; Özarslan, S, Barışçı, N. 2014). Classification and regression are predictive models.
The present study aims to discover the most accurate classification algorithm and the variables that have an effect on students’ performances in the chapter “Let’s Solve the Riddle: Our Body” in Science and Technology course, using questionnaire and achievement test results of 4th grade primary school students in Edirne.
2.1. Problem Statement
In the present study, questionnaire data and achievement test results in the chapter “Let’s Solve the Riddle: Our Body” in Science and Technology course of 4th grade primary school students in Edirne were used.
The study aims to discover the most accurate classification algorithm for the data set and the variables that have and do not have an effect on students’ performances. Weka 3.7 was used for data analysis. 2.2. Creating the Database
Volunteer 4th year students studying in the primary schools of Edirne participated in the study in accordance with the permission granted by the Governorship of Edirne. A 20-item achievement test was given to the volunteer participants at the end of the chapter “Let’s Solve the Riddle: Our Body”. Moreover, a 32-item questionnaire was given to the volunteers while the chapter was ongoing.
The records in the data set consist of the questionnaire and achievement test data. Optical forms were used to collect the questionnaire and achievement test data. The data were transferred to an Access database after being scanned by means of a piece of software written in C#.
2.3. Investigation of the Data
In this step, problematic records were taken out of the data set. In that respect:
- The observations who participated in the achievement test but did not respond to the questionnaire were taken out of the data set.
- The observations who responded to the questionnaire but did not participate in the test were taken out of the data set.
After the investigation, 650 records were left in the data set. 2.4. Transformation of the Data
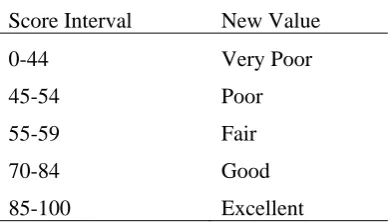
Following the cleaning of the data, numerical grades were transformed into qualitative classes in anticipation of the transformation’s positive contribution to student performance. The transformation is tabulated below.
Table1. Transformation of Performance Grades
Score Interval New Value
0-44 Very Poor
45-54 Poor
55-59 Fair
70-84 Good
85-100 Excellent
2.5. Modelling
The records that were included in the study were taken without replacement using the software written in C# and data sets in different sizes (100, 150...600, 650) were formed. After that, the data sets were converted into .arff format which WEKA could process.
Figure 1. Types and Features of the Data
Numerous algorithms were tested in the study and Naive Bayes, SMO, Multilayer Perceptron, Ibk, Kstar, j48, LMT and Random Forest algorithms were used since these were the ones with the most accurate results.
For the analysis of the .arff files which had varying numbers of observations, Naive Bayes algorithm, SMO, which is an artificial neural networks algorithm, Multilayer Perceptron algorithm, LMT algorithm, K-nearest Neighbor (IBK) algorithm, Kstar algorithm, j48 Decision Tree algorithm and Random Forest algorithm were used. The default values of the algorithms were used so that model performance would not be affected. Moreover, Cross-Validation 10 was preferred as a test method. In this method, the source of data is divided into 10 equal segments and every single segment is used as the test group once and the remaining 9 segments are used as the learning group.
There are numerous tools used in data mining and using Weka, which is one of the most popular data mining tools, it is possible to run a lot of algorithms on the selected data set. The algorithms that were used in this study are briefly presented below:
Naive Bayes Algorithm: Naïve Bayes algorithm is based on Bayesian Probability. It runs according to the probability of hypotheses being true. Depending on the data set, the hypothesis with the maximum level of probability is selected. The qualities are independent and equally important. (Kaya, Y., Pehlivan, H., 2014)
Naive Bayes classifiers are divided into two according to the method of calculating probability levels of terms related to a known class. In the multiple-term method, transition count is also taken account. In the multiple-variable method, however, whether the terms exist in the data set or not is inspected only. (Gürcan, F., 2009; Kaya, Y., Pehlivan, H., 2014)
SMO Algorithm: SMO Sequential Minimal Optimization is a widely preferred algorithm for solving optimization problems in training since it is easy to use. SMO is an algorithm which uses SVM (Support Vector Machine). In every step, SMO makes choices as to the solution of the simplest optimization problems and produces results (J.Plat, 1998).
Multilayer Perceptron Algorithm: WEKA (2007) contains a classifier that uses back propagation to classify instances. This network can be configured manually, created through an algorithm or both methods can be utilized. The network can also be monitored and modified through the course of training. The nodes in the network are sigmoid. (Ardıl E., 2009)
IBK Algorithm: Also known as kNN algorithm, IBK initially treats all observations as clusters and forms new clusters combining these clusters incrementally. In this method, the distances among observations are determined firstly. (Oscan Y., 2008; Zhan E., 2014)
Kstar Algorithm: Kstar is an instance-based algorithm. Also determined by several similar functions, it is a class of the test instance related to the class that is the same as the training instances. Kstar differs from other instance-based algorithms in that it uses an entropy-based distance function (Cleary, J.G. et al. (1995); Ardıl E. (2009).
J48 Algorithm: This algorithm uses decision tree techniques. It creates a top-down divide and conquer tree structure. The attributes in this algorithm are located in a way that they can form nodal points and the leaves are formed in accordance with the training data. Leaves also signify the class label. (Kargupta H, 2008 et al. Özhan E. 2014)
LMT Algorithm: Combining Logistic Regression and Decision Tree Learning algorithms, LMT is a controlled classification model and a classification tree which has logistic decrease functions on its leaves. LMT uses cross-validation to find out the repeat count. (Daş, B., Türkoğlu, İ., 2014)
Random Forest Algorithm: In Random Forest algorithm, the aim is to combine multi-variate decision trees that are trained in different clusters. CART algorithm is used in the formation of multi-variate decision trees. Computations are made on all trees to determine the attribute first and all the attributes are then combined to select the most commonly used attribute. The selected attribute is included in the tree and the process is repeated for other levels, too. (http://bolubeyi.net/karar-agaclari-ve-algoritma-turleri.html, May 2015)
Various criteria can be used to see how accurate a classification algorithm is. The criteria used in this study are the rate of correct estimates, Kappa statistics, F-measure and root-mean-square error.
The Rate of Correct Estimates is the most popular and simple method of measuring model success. The rate of correct estimates is the value that uses the instances as both training and test data, producing the rate of accurate classifications as a result. (Özhan E.2014)
Kappa Statistics (KS) is a criterion that is used to express the agreement between predicted and observed classes in a data cluster. (Witten et al., 2005; Aydın, F. 2011). KS is a value between -1 and 1. -1 signifies a total disagreement or a negative relationship. 1, on the other hand, shows that there is a perfect agreement (Kılıçaslan, Y. et al., 2009). If KS value is 0.4 or above, it is possible to conclude that there is an acceptable level of agreement beyond chance factor. (Landis et al., 1977; Aydın, F. 2011).
F-Measure is the harmonic mean of precision and recall values. F-measure is a significant criterion in the increasing of the performance of the classifier during the process of the preparation of the training data. In the performance analysis of classifiers, the relationship between F-measure and data size is explained (Kılıçaslan, Y. et al., 2009) and a happiness diagram (Russell et al., 2003; Aydın, F.2011) was produced through the learning curve between the measure and data size. The acceptable F-measure value is generally a minimum of 0.5, which is also used in the present study (Aydın, F. 2011). Root-mean-square Error (RMSE), is calculated by taking the square root of Mean-square Error (MSE) since it is among the most easily processed measure like numerous mathematical techniques (such as linear regression). It measures the performance of classifiers in machine learning. (Witten et al., 2005; Aydın, F. 2011).
3. FINDINGS
The classification algorithms used in this study were run on data sets of different sizes and the results are presented below.
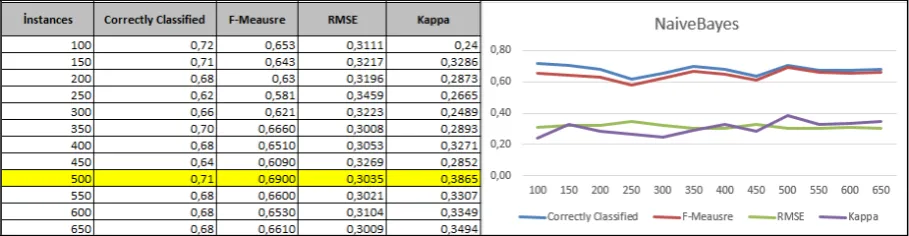
Figure 2. Naive Bayes Algorithm
When the rate of correct classifications, F-measure, Kappa Statistics and RMSE values that were acquired through data sets of different sizes, on which Naive Bayes algorithm was applied, are inspected, it can be said that the most accurate classification value belongs to the data set that consists of 500 instances.
Figure 3. SMO Algorithm
When the rate of correct classifications and F-measure values in the data sets on which SMO algorithm was applied are observed, it can be said that the most accurate classification value is in the data set that consists of 550 instances.
Figure 4. Multilayer Perceptron Algorithm
In Figure 4, it can be seen that two most accurate values were obtained as a result of the investigation of data sets on which Multilayer Perceptron was applied. The F-measure and Kappa Statistics values that were obtained through the 600-intance data set was found to be more accurate than the data set with 650 instances. For that reasons, it can be stated that the 600-instance data set is the one on which Multilayer Perceptron algorithm is the most successful.
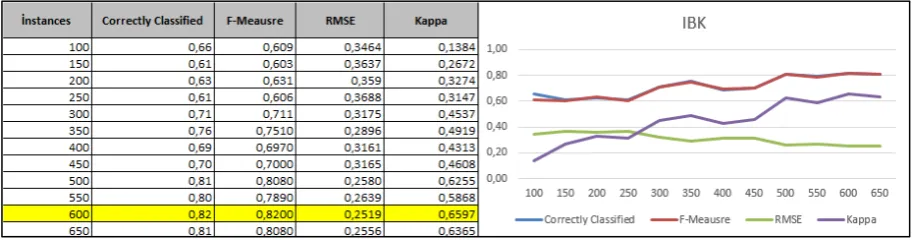
Figure 5. IBK Algorithm
The rate of correct classifications, F-measure, Kappa Statistics and RMSE values which were obtained through the application of IBK algorithm to data sets of different sizes indicate in Figure 5 that the most accurate classification value belongs to the data set with 600 instances.
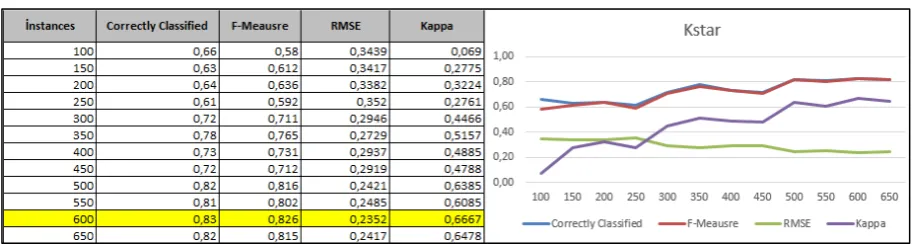
Figure 6. Kstar Algorithm
Figure 6 illustrate the rate of correct classifications, F-measure, Kappa Statistics and RMSE values related to the data sets on which Kstar algorithm was applied. The results show that the most accurate classification value belongs to the data set with 600 instances.
Figure 7. J48 Algorithm
Figure 6 illustrate the rate of correct classifications, F-measure, Kappa Statistics and RMSE values related to the data sets on which J48 was applied. The results show that the most accurate classification value belongs to the data set with 500 instances.
Figure 8. LMT Algorithm
When the rate of correct classifications, F-measure, Kappa Statistics and RMSE values that were acquired through data sets of different sizes on which LMT algorithm was applied are inspected, it can be said that the most accurate classification value belongs to the data set that consists of 600 instances.
Figure 9. Random Forest Algorithm
Figure 9 illustrate the rate of correct classifications, F-measure, Kappa Statistics and RMSE values related to the data sets on which Random Forest algorithm was applied. The results show that the most accurate classification value belongs to the data set with 600 instances.
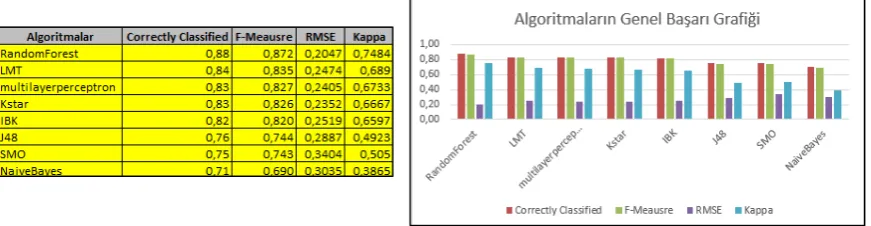
Figure 10. Comparison of Algorithms According to their Rates of Correct Classification and F-Measure Values
Figure 10 reveals that Random Forest Algorithm is the most accurate one in terms of the rate of correct classifications, F-measure, Kappa statistics and RMSE values.
InfoGainAttributeEval algorithm in the Select Attributes tab was used in order to reveal how much information each variable used in the present study provide in terms of reaching the classifier value,
that is, the final (son_test) value. (http://wiki.pentaho.com/display/DATAMINING/InfoGainAttributeEval)
Figure 11. The Variables that have an Effect on Student Grades (Descending Order)
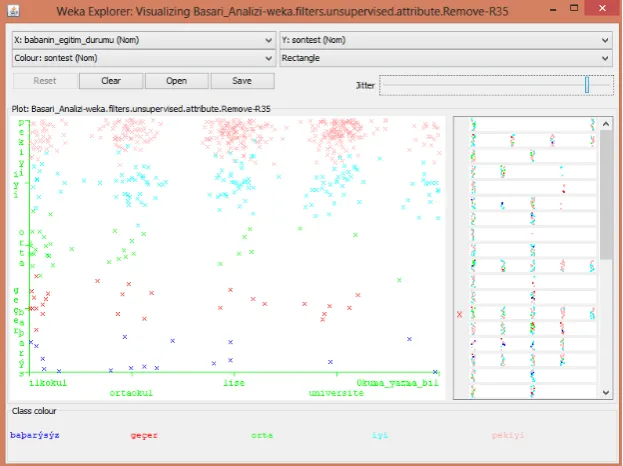
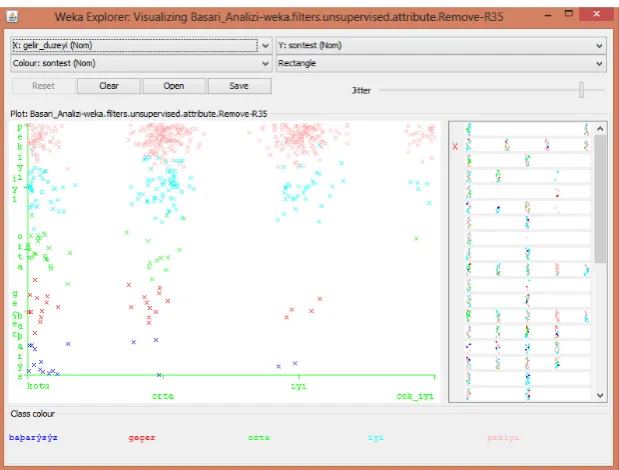
The education level of the participant’s father and the level of income, which were found out to be the factors that have the strongest effect on Son_Test results, were displayed using the Visualizing screen of Weka.
Figure 12. Visual Illustration of the Effect of Father’s Level of Education on Performance
Figure 13. Visual Illustration of the Effect of Level of Income on Performance
4. CONCLUSION
The data obtained by giving questionnaires and tests to 4th year primary school students in Edirne were analyzed through dividing the data into different sizes and using the algorithms available in WEKA. As a result of the analyses, it was concluded that Random Forest algorithm, with a rate of correct classification of 88%, F-measure value of 0.872, Kappa Statistics value of 0.7484 and RMSE value of 0.2047 for the data set with 600 instances, was more accurate than the other algorithms. When the accuracy of the other algorithms are ranked, Random Forest is followed by LMT, Multilayer Perceptron, Kstar, IBK, J48, SMO and Naive Bayes.
Furthermore, when each of the variables were analyzed in order to find out how much information they could provide in terms of reaching the classifier value, that is, the final (son_test) value, the education level of the participant’s father and the level of income were discovered to be the strongest factors that have an effect on the performance of the participants.
In the light of the acquired results, it is believed that similar applications with different data sets and chapters can aid in discovering and clarifying the other factors that have an effect on students’ performance.
REFERENCES
Ardıl E.. Esnek Hesaplama Yaklaşımı İle Yazılım Hata Kestirimi, Yüksek Lisans Tezi, Sayfa 18, 2009.
Alan M. A. . Veri Madenciliği Ve Lisansüstü Öğrenci Verileri Üzerine Bir Uygulama, Dumlupınar Üniversitesi Sosyal Bilimler Dergisi, Sayı 33, Sayfa.165-174, 2012.
Aydın F., Kalp Ritim Bozukluğu Olan Hastaların Tedavi Süreçlerini Desteklemek Amaçlı Makine Öğrenmesine Dayalı Bir Sistemin Geliştirilmesi, Yüksek Lisans Tezi, 2011.
Aylık Y. Z., Özdemir A., Yavuz U. . Lise Türü Ve Lise Mezuniyet Başarısının, Kazanılan Fakülte İle İlişkisinin Veri Madenciliği Tekniği İle Analizi, Sosyal Bilimler Enstitüsü Dergisi, Cilt 10, No.2, Sayfa.441-454, 2007.
Daş B., Türkoğlu İ.,.DNA Dizilimlerinin Sınıflandırılmasında Karar Ağacı Algoritmalarının Karşılaştırılması, Eleco 2014 Elektrik – Elektronik – Bilgisayar ve Biyomedikal Mühendisliği Sempozyumu, 2014.
Ekren G., Bir Veri Madenciliği Tekniği İle Öğrenci Segmentasyonu, 21. Ulusal Eğitim Bilimleri Kongresi. (Http://Www.Pegem.Net/Akademi/Kongrebildiri_Detay.Aspx?İd=136140), 2012.
Güner N., Çomak E. , Mühendislik Öğrencilerinin Matematik I Derslerindeki Başarısının Destek Vektör Makineleri Kullanılarak Tahmin Edilmesi, Pamukkale Üniversitesi Mühendislik Bilimleri Dergisi Cilt 17, Sayı 2, Sayfa 87-96, 2011.
J. Platt., Fast training of support vector machines using sequential minimal optimization. Advances in kernel methods: Support vector learning. Cambridge, MA: MIT Press, 1998.
Kaya Y., Pehlivan H., Knn, Nn, Bayes, Dt Ve Svm Kullanılarak Ekg Vurularının Sınıflandırılması, Isıtes2014 Karabük - Türkiye , Sayfa 1418, 2014.
Kılıçaslan Y., Güner E. S., Yıldırım S., Learning-based pronoun resolution for Turkish with a comparative evaluation; Computer Speech & Language Volume 23, Issue 3, July 2009, Pages 311-331, 2009.
Küçüksille E., Veri Madenciliği Süreci Kullanılarak Portföy Performansının Değerlendirilmesi Ve İMKB Hisse Senetleri Piyasasında Bir Uygulama, Doktora Tezi, 2009.
Özarslan S., Barışçı N., Öğrenci Performansının Veri Madenciliği İle Belirlenmesi, Isıtes2014 Karabük – Türkiye Sayfa 1958-1965, 2014.
Özhan E., Yapay Zeka Yöntemleri İle Dünya Depremlerinin Modellene bilirliği, Isıtes2014 Karabük – Turkey Sayfa 1188, 2014.
http://bolubeyi.net/karar-agaclari-ve-algoritma-turleri.html,Mayıs 2015
http://wiki.pentaho.com/display/DATAMINING/InfoGainAttributeEval Mayıs 2015