www.atmos-meas-tech.net/8/2333/2015/ doi:10.5194/amt-8-2333-2015
© Author(s) 2015. CC Attribution 3.0 License.
Statistical precision of the intensities retrieved from constrained
fitting of overlapping peaks in high-resolution mass spectra
M. J. Cubison1,2and J. L. Jimenez1
1CIRES and Dept. of Chemistry and Biochemistry, University of Colorado, Boulder, CO, USA 2TOFWERK AG, Thun, Switzerland
Correspondence to: M. J. Cubison (cubison@tofwerk.com)
Received: 24 October 2014 – Published in Atmos. Meas. Tech. Discuss.: 17 December 2014 Revised: 20 April 2015 – Accepted: 10 May 2015 – Published: 5 June 2015
Abstract. Least-squares fitting of overlapping peaks is often needed to separately quantify ions in high-resolution mass spectrometer data. A statistical simulation approach is used to assess the statistical precision of the retrieved peak inten-sities. The sensitivity of the fitted peak intensities to statis-tical noise due to ion counting is probed for synthetic data systems consisting of two overlapping ion peaks whose po-sitions are pre-defined and fixed in the fitting procedure. The fitted intensities are sensitive to imperfections in the m/Q calibration. These propagate as a limiting precision in the fitted intensities that may greatly exceed the precision aris-ing from countaris-ing statistics. The precision on the fitted peak intensity falls into one of three regimes. In the “counting-limited regime” (regime I), above a peak separationχ∼2 to 3 half-widths at half-maximum (HWHM), the intensity pre-cision is similar to that due to counting error for an isolated ion. For smallerχand higher ion counts (∼1000 and higher), the intensity precision rapidly degrades as the peak sepa-ration is reduced (“calibsepa-ration-limited regime”, regime II). Alternatively forχ< 1.6 but lower ion counts (e.g. 10–100) the intensity precision is dominated by the additional ion count noise from the overlapping ion and is not affected by the imprecision in them/Qcalibration (“overlapping-limited regime”, regime III). The transition between the counting andm/Qcalibration-limited regimes is shown to be weakly dependent on resolving power and data spacing and can thus be approximated by a simple parameterisation based only on peak intensity ratios and separation. A simple equa-tion can be used to find potentially problematic ion pairs when evaluating results from fitted spectra containing many ions. Longer integration times can improve the precision in regimes I and III, but a given ion pair can only be moved
out of regime II through increased spectrometer resolving power. Studies presenting data obtained from least-squares fitting procedures applied to mass spectral peaks should ex-plicitly consider these limits on statistical precision.
1 Introduction
The primary goal of many mass spectrometry applications is the correct identification and quantification of ions present in the mass spectrum. Several studies probe the sensitivity of deconvolution algorithms to perturbations in the measure-ment parameters by applying them to synthetic data (Laeven and Smit, 1985; Blom, 1998; Lee and Marshall, 2000; Sun et al., 2010; Hilmer and Bothner, 2011; Müller et al., 2011). Some studies are also concerned with quantifying the over-lapping ion signals, in fields such as proteomics (Link et al., 1999; Mirgorodskaya et al., 2000; Bantscheff et al., 2007, 2012) and atmospheric science (DeCarlo et al., 2006; Titz-mann et al., 2010; Müller et al., 2011; Jokinen et al., 2012; Yatavelli et al., 2012). Quantification of such ion signals is difficult and may be confounded by unconstrained peak po-sition parameters, or through the use of falsely constrained peak centroids arising from an automated peak-finding algo-rithm. The peak intensity and position parameters and their precisions are clearly not independent. The quantification process is thus complex, and assessing the precision of the retrieved intensities is difficult.
Correct identification of unknowns below the limit where two overlapping but non-coincident peaks no longer maintain an inflection point in the derivatives of the measurement pro-file is difficult. However, effects such as peak width broad-ening may point to the presence of unknown ions. For exam-ple, Meija and Caruso (2004) use peak width measurements from a calibration standard to compare with that of a spec-trum containing two overlapping peaks, showing that Gaus-sian deconvolution as well as shifts in the peak centroid po-sition can be used to predict the ratio of the intensities of the ions. Blom (1998) considers the impact of a weak overlap-ping interference on two quantities describing peak shape, variance and skew. That study shows that deviations in the peak shape can point to the presence of an unknown interfer-ing peak at separations well below those which would be re-quired to separate it visually. However, Blom also concluded that an interfering peak with relative abundances of only a few percent could cause significant shifts (of a few ppm) in the centroidm/Qposition, even though analysis of the peak shape would not point to the presence of the unknown peak in the spectrum.
Given the challenges encountered by such studies to cor-rectly identify unknown peaks in the MS, it is unsurprising that the uncertainties arising during peak identification are often expressed simply by confidence metrics, such as mass accuracy/error and relative ion abundance as compared to theoretical isotope patterns (e.g. Kilgour et al., 2012) rather than, as would generally be preferred, reporting the estimated precision of the fitted intensities.
Similar confidence metrics are also reported for studies attempting to quantify the intensity of known overlapping peaks. Haimi et al. (2006) qualitatively split fits into reliable and unreliable categories by comparing peak ratios for suc-cessive measurements at different concentrations. Fits were considered reliable for a standard deviation in the peak
ra-tio < 25% for eight successive measurements, an arbitrary but consistent metric. This is a useful guide when interpret-ing experimental results but does not address the intensity precision in a quantitative manner, limiting the scope of ap-plicability. Müller et al. (2011) reported on a more system-atic approach to quantify the expected attainable precision of the peak intensity for an example synthesised system subject to counting and estimated calibration errors. Their approach was however not extended from a single example to the gen-eral case. A gengen-eralised metric to describe the performance of such deconvolution procedures is desired.
This study aims to present a quantitative, systematic anal-ysis of the statistical precisions arising during the deconvo-lution of overlapping peaks for the special case where the peak positions are known a priori and held fixed in the fit-ting procedure. This technique is widely employed by the atmospheric-science community during analysis of data from field and also laboratory instrumentation (e.g. Farmer and Jimenez, 2010), for example the high-resolution time-of-flight aerosol mass spectrometer (HR-ToF-AMS; DeCarlo et al., 2006), the proton transfer reaction time-of-flight mass spectrometer (Cappellin et al., 2009, 2011; Müller et al., 2011), the atmospheric pressure interface time-of-flight mass spectrometer (APi-TOF; Junninen et al., 2010) and the high-resolution time-of-flight chemical-ionisation mass spectrom-eter (HRToF-CIMS; Jokinen et al., 2012; Yatavelli et al., 2012). The ionisation techniques used in the instruments ionise and fragment the molecules in a very consistent man-ner. Thus, one degree of freedom can often be removed from the ion fitting procedure, which is then based upon a compre-hensive list of ions and their exactm/Q that define the fit-ted centroid values. Although analysis of the measurements from the above instrumentation motivated this study, the techniques and conclusions are directly applicable to other mass spectrometry or even optical photon-counting systems, as they are based on the spectra only and make no further assumptions about the instrumental details.
Müller et al. (2011) conducted an error analysis on such a constrained hypothetical system using a peak model and specifications for a typical lower-resolution TOF spectrome-ter used (amongst other fields) in atmospheric science, and they demonstrated that the precision in the fitted peak in-tensities is sensitive to the ratio of the peak inin-tensities. The precision with which the less-intense peak intensity can be retrieved becomes extremely poor for peak separations less than the full-width at half-maximum (FWHM). Müller et al. (2011) also concluded that a precise analysis could only be performed for well-separated peaks. We extend this analy-sis from a single example to the general case for a wide range of measured intensities, separations and resolving powers (peak widths). We investigate the relationship between peak separation and achievable peak intensity precision, and de-velop a parameterisation to quantify the latter.
2 Methods
A synthetic measurement distribution was constructed con-sisting of one or two Gaussian peaks of known width and centroid position. Unless stated otherwise, the synthetic peaks were generated for a fixed ion time-of-flight (iToF) re-solving powert /1t=2000 and a sample interval that gives approximately 10 discrete measurement points within 2 full-widths at half-maximum of the peak centre. This could be obtained for example with 0.2 ns data-acquisition point spac-ing at 2000 ns (as in this study), or 1 ns spacspac-ing at 10 000 ns. These metrics were chosen to correspond to realistic hard-ware specifications for current mass spectrometer and data-acquisition systems. Figure S1 in the Supplement shows an example of a peak using these specifications with a centroid flight time of 2000 ns and hence peak width 1 ns. The peak position and width parameters are given as function of iToF rather thanm/Q, for the mass axis goes as the square root of iToF and a perfect Gaussian shape observed in iToF does not maintain its symmetry inm/Q. The fits are thus conducted in iToF, the axis in which the measurement is taken. Translation to the normally specified spectrometer mass resolving power inm/Qspace is given simply bym/1m=t /21t, and thus the mass resolving power in our default case is 1000. From here on we refer to the mass resolving power unless other-wise stated.
To address counting error (item i above), the synthetic measurement distribution was degraded, point by point, with Poisson-distributed error of magnitude sqrt(N )(whereN is the number of ions counted during the spectrum acquisi-tion). In time-of-flight mass spectrometry, iToF is converted tom/Q space by fitting a function, usually proportional to the square root of iToF, which is determined by fitting iso-lated ions of known m/Q. In this work we use the equa-tion iToF=A+B·sqrt(m/Q), whereAandBare constants. To simulate the propagation of uncertainty of this calibration into the fitting procedure (item ii above), the constrained
cen-troid values in the fits were also additionally perturbed during each fit by a randomly assigned value from a Gaussian distri-bution of appropriate standard deviation, as discussed below. For each iteration of the fitting procedure, this perturbation was applied consistently to both fitted peaks (i.e. the cali-bration parameters remain equal for all peaks). However, the perturbation applied varied from one iteration to the next.
The peak shape model (item iv) was removed as a degree of freedom by utilising Gaussian shapes to represent the in-strumental peak shape; the influence of the peak shape on fit-ted parameters is difficult to assess (Yu and Peng, 2010, and references therein) and is thus not considered here, although its relative impact should be the focus of future studies. The separation of the discrete data points (item iii) is held fixed unless otherwise noted. Further sources of uncertainty in the measurement distribution such as electronic baseline noise are not considered. In modern data-acquisition systems they are typically small compared to ion counting noise which leads to signal degradation and a non-zero mass-spectrum baseline.
After application of the Poisson-distributed noise and of them/Qcalibration errors, least-squares Gaussian peak fits were applied to the measurement distribution, where only the peak intensity parameters were determined. This procedure was repeated for 10 000 randomly generated cases, resulting in a histogram of the fitted peak intensities. The width of the histogram, reported as the standard deviation of a Gaussian curve fitted to the histogram distribution, thus expresses the precision with which the peak intensities can be fit.
For the case of a system with two overlapping peaks, we define a normalised separation parameterχ=dt /HWHM, where dt is the separation of the known peak positions in iToF space and HWHM is the half-width-half-maximum of the peak (i.e.χ=2 is the case where the peaks are separated by 1 FWHM).
3 Results and discussion
3.1 Precision of retrieved signal intensities due to ion counting error for an isolated ion with perfect
m/Qcalibration
Precision theory offers a calculable method to describe the best precision with which the peak intensity of an isolated ion can be retrieved from a discrete spectrum with Poisson-distributed noise (Lee and Marshall, 2000). Lee and Marshall ran simulations of least-squares fits to Gaussian peak shapes and were able to demonstrate the application of precision the-ory to mass spectra, giving the relationships for the standard deviations in fitted peak amplitude,SA, and centroid iToF
SA=cA r
Aδt
W , (1)
St=ct r
W δt
A , (2)
whereAis the peak amplitude in counts,W the FWHM of the peak, δt the separation of the discrete data points and
cA andct are constants. It is noted thatδt is not varied in
our study. This result is used as the starting point for the analyses in this work, and a simulation of this simple sys-tem is demonstrated in Fig. 1. Histograms are shown for the distribution of the normalised deviation in the retrieved in-tensity,1=(Ifitted−Itrue) / Itrue, over 10 000 fits of an
iso-lated ion for logarithmic steps in the peak intensityItrue. The
peak position and shape are known a priori, and the observed width of the histogram,σN, thus represents the precision in
1arising purely from counting error on an isolated ion.σN
is inversely proportional to the square root of the number of ions detected (1/
√
N), as predicted by the Lee and Mar-shall equation and shown in the inset. The minimum attain-able precision is that arising from counting error, σN (i.e.
σI ≥σN,whereσIis the width owing to all sources of error).
Figure 1 thus represents the best-case scenario for the system, in the absence of other contributing sources of uncertainty. For the example system ofItrue=1000 counts, centroid iToF
t0=2000 ns,δt=0.2 ns andW=1 ns (i.e. resolving power
of 1000, as shown in Fig. S1), the precision on the retrieved intensity owing purely to Poisson-distributed counting error is thusσN=3.2 %. Regardless of data-point spacing or
re-solving power, this value ofσN remains fixed for this peak
intensity, since the dependencies of A, W andδt upon one
another cancel out. For example, doubling data-acquisition rate halves the peak amplitude for the same total number of ions (ignoring non-linear effects from the detector which are outside the scope of this paper). ThusσNis in this case given
simply by
√
1000/1000=3.2 %, matching the value result-ing from the simulations.
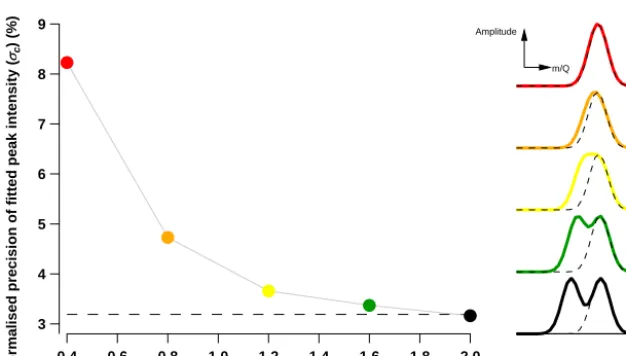
3.2 Precision of retrieved signal intensities for two overlapping ions with perfectm/Qcalibration Repeating the process for a system with two overlapping but non-coincident Gaussian peaks leads to histograms that must be at least as broad as those shown in Fig. 1. Although the centroid positions of the two Gaussians are still fixed dur-ing both generation of the synthetic distribution and the fit-ting procedure, the combined Poisson-distributed uncertain-ties from the two peaks and the mix of information in the area of peak overlap leads to increased imprecision in the re-trieved peak intensities. Figure 2 demonstrates this tendency for a pair of equally intense peaks with various different peak separations (χ, in units of HWHM). Asχincreases, the pre-dicted histogram width, σC, tends towards the limiting
un-certainty for an isolated ion σN, as reported by Müller et
al. (2011) for a similarly posed set of simulations. For ions of equal intensity, forχ< 1.6 the presence of the neighbour-ing peak results in an appreciable increase of the normalised deviation in fitted peak intensity, consistent with the results of Müller et al. (2011).
A further example where one peak is 1 / 10 as intense as the other is shown in Fig. S2. In this case the results are starkly different for the parent (more intense) vs. child (less intense) ions.σCof the parent ion is reduced (more precise)
relative to the equal-intensity case, as the influence of the less-intense neighbouring ion is weaker, and the influence of the neighbouring peak is only appreciable forχ< 1.2. In con-trast,σCof the child ion tends towards a value ofσNthat is √
10 higher than the equal-intensity case and is appreciably higher than this limit as soon asχ< 1.6.
These results are generally observed for other examples: the precision due to ion counting on an isolated ionσN for
a given system will vary as per Eq. (1), but the total preci-sion owing to counting error,σC, can be much larger thanσN
when the peak separationχis of the order of 1, with higher separation needed for the child and less separation needed for the parent.
3.3 Estimation of the precision of them/Qcalibration For the constrained fitting procedures investigated in this study, which constrain a priori the positions of the fitted ions, correct determination of them/Qcalibration is a prerequisite for retrieval of the ion intensities, and for them/Qit must be translated to the constrained iToF values to be used in the fits. The determination of them/Qcalibration is, however, inher-ently subject to imprecision due to statistical effects; i.e. the fitting of the peak position of each ion (which is then used as the input of them/Qcalibration) will be subject to impreci-sion arising from statistical effects, as per preciimpreci-sion theory. We will estimate this imprecision in this section. Additional sources of error can be present but are not considered here. These include possible contributions from surrounding ions to the shape of the calibration ions, and incomplete knowl-edge of the peak shape. Additionally, them/Q calibration curve is likely to have worse precision in regions of m/Q space distant from the calibration ions.
30 20
10 0
-10 -20
D = ( Ifitted - Itrue ) / Itrue (%)
Normalised probability density
30
25 20
15 10
5 0
sC
(%)
0.30 0.20 0.10 0.00
1/sqrt(Counts) y = 100 x Peak intensity (counts):
107 106 105 104 103 102 101
Figure 1. Histograms of the normalised deviation in fitted peak intensity,1, for 10 000 simulations of peak fitting to an isolated Gaussian ion peak degraded with counting error and centred at 2000 ns, data-point spacing 0.2 ns and peak width 1 ns. Shown inset, the linear relationship between the histogram widthσC, given as the standard deviation in1and the fitted peak intensity.
9
8
7
6
5
4
3
Normalised precision of fitted peak intensity (
sc
) (%)
2.0 1.8 1.6 1.4 1.2 1.0 0.8 0.6 0.4
Norm. peak separation c (dt/HWHM)
8x10⁶ 6 4 2 0 8x10⁶ 6 4 2 0 8x10⁶ 6 4 2 0 8x10⁶ 6 4 2 0
Amplitude
m/Q
Isolated ion
Figure 2. Relative precision in fitted peak intensity,σC, for 10 000 simulations of peak fitting to a pair of overlapping Gaussian peaks
degraded with counting error. Peak intensity=1000 counts; peak width=1 ns; peak centre=2000 ns; and point spacing=0.2 ns. Schemat-ics demonstrating the appearance of the measurement distributions are shown on the right, with dashed lines showing the measurement distribution of an isolated ion for comparison.
defines the theoretical upper limit to which the centroid posi-tion of the calibrant peaks in iToF space can be defined, since other possible sources of error are not accounted for. The im-perfections in the fitted positions of the calibrant peaks prop-agate into the m/Q calibration equation (a squaroot re-lationship between iToF andm/Q). In our numerical experi-ment the perturbedm/Qcalibration was used to calculate the corresponding deviation in iToF for a set of 10 iToF positions across the calibrated range, from 2 to 20 µs in 2 µs steps. It is noted that the peaks used to assess the calibration are thus not always identical to those used to define it. This was done to reflect real MS analysis, where peak fits are more often than not applied to MS regions away from the calibration points.
This procedure was repeated 10 000 times to build up a set of histograms of the deviation between the known and calcu-lated iToF values, and again repeated for resolving powers of 500, 2000 and 4000 using a constant acquisition time inter-val. As a longer flight path is generally required to achieve greater resolving power, the flight times of the calibrant and test peaks were also adjusted to be correspondingly shorter or longer (i.e. for resolving power 500, using calibrants at 2, 4, 6 and 8 µs).
cali-brant peaks and the relative positions in m/Q space of the calibrants and the test peaks. Iterating the calibration proce-dure many times thus builds up a distribution of this error for each calibrant peak, whose standard deviation we take as the precision in the calibrated peak position. The mean nor-malised precision in the peak position for all the test peaks is then taken as the best estimate of the calibration precision as a whole (i.e. quantitative description of the imprecision in the calibration over allm/Q). The resulting relationships are demonstrated in Fig. 3, which shows this estimate of cali-bration precision for four different resolving powers and for calibrant peaks of equally intenseItruefrom 10 to 107counts,
as given on thexaxis.
The limiting calibration precision, where all peaks exhibit identical signal-to-noise ratios, can be less than 0.1 ppm for high signal-to-noise situations. This unrealistic scenario ex-ceeds the performance attainable using current mass spec-trometry systems of similar resolving power, indicating that other sources of error than purely counting statistics may play a significant role in determining calibration precision. Lee and Marshall (2000) note that the relative error inm/Q calibration could potentially improve by up to an order of magnitude if such sources could be eliminated. The simula-tions where one of the calibrant peaks suffers from poorer counting statistics (only 20 counts) also exhibit much greater calibration imprecision. Although an exhaustive investiga-tion would be outside of the scope of this study, Fig. 3 high-lights an important feature when using four ions for m/Q calibration as is often typical of actual applications. If only one calibrant peak suffers from poor ion counting statistics, then even if all the others exhibit strong signal-to-noise ra-tios, them/Qcalibration precision will be substantially de-graded, by factors of 1 or 2 orders of magnitude. It is there-fore important when determining them/Qcalibration using some lower-intensity ions to integrate measurements for as long as possible, as long as the calibration does not drift over the averaging periods due to temperature variations or other effects.
In Sect. 3.4 we incorporate the impact of the limited pre-cision of them/Qcalibration in the overlapping peak-fitting simulations discussed in Sect. 3.2. A quantitative estimate of the precision of them/Qcalibration is required. Assum-ing a typical case in which all calibration ions have at least 1000 counts while one ion has 20 counts, in Fig. 3, preci-sions of 9, 5, 3 and 1.8 ppm for the m/Q calibration were used for resolving powers of 500, 1000, 2000 and 4000 re-spectively. Whilst larger than the limiting precisions for cal-ibration mass spectra with high count rates, these are actu-ally of the same order or better than values reported for real instruments of these resolving powers, both in atmospheric science (DeCarlo et al., 2006; Junninen et al., 2010; Jokinen et al., 2012) and other fields (e.g. Strittmacher et al., 2003).
16
14
12
10
8
6
4
2
0
Precision of m/Q calibration (ppm)
Intensity log(I/counts)
101 102 103 104 105 106
All peaks equal intensity One weak peak of 20 counts Mass resolving power:
500 1000 2000 4000
Figure 3. Mean precision in peak position arising fromm/Q cali-bration as a function of the intensity of the calibrant ions. Dashed lines: all calibrant ions of equal intensity and as given on thexaxis. Solid lines: as dashed, except one calibrant has peak intensity of only 20 counts.
3.4 Precision of retrieved signal intensities in an overlapping two-ion system with realisticm/Q
calibration error
We now estimate the achievable precision for the peak inten-sities resulting from the constrained fitting procedure, com-bining the precisions from counting and calibration errors in an overlapping two-ion system. As the peak positions are held fixed, uncertainties in the calibration propagate to uncer-tainties in the fitted intensities. Both these effects contribute to the precisions summarised in Fig. 4. These simulations use synthetic data consisting of two overlapping peaks as was demonstrated in Fig. 2 for peaks of equal intensity. However, in Fig. 4 the peak intensities are different, with a dominant “parent” peak of intensityIpand a smaller “child” peak of
intensityIc, withRI=Ip/Ic=2. The precisions in the
nor-malised deviation in retrieved peak intensity of the parent and child peaks,σpandσcrespectively, are shown. The
val-ues ofσN (the counting-error limit) for an isolated ion are
also shown for comparison.
Three regimes are apparent in this plot:
1. For largeχ(well-separated peaks), the precision in the normalised deviation in retrieved peak intensity,σI, for
both peaks is limited by counting error and tends to-wards theσN values for isolated ions; i.e. as the ion
separation increases both ions are retrieved with simi-lar precision to individual isolated ions. This region we term the “counting-error regime”. Note that for well-separated peaks the imprecision in them/Qcalibration at the realistic levels used here is small relative to the counting error and does not result in an increase in the precision above that imposed by counting statistics. 2. For smaller values ofχ(<∼3, overlapping peaks) and
0.1 1 10 100
Normalised precision of fitted peak intensity (
sI
) (%)
4.0 3.0
2.0 1.0
Norm. peak separation c (dt/HWHM) 0.1
1 10 100
4.0 3.0
2.0 1.0
Norm. peak separation c (dt/HWHM) log(Peak intensity) of
dominant peak (counts):
1 2 3
4 5 6
Counting + calibr. errors Just counting error
Counting error limit for isolated ion
Counting error regime
Counting-error regime
Mass-calibration limited regime
Mass-calibration limited regime Overlapping
counting error regime counting error regimeOverlapping
Figure 4. Precision on fitted peak intensity,σI, as a function of peak separation for an overlapping ion pair. Colours: peak intensity of the
dominant ion (left); the weaker ion (right) is half as intense. The dominant peak is centred at 2000 ns; both have a width of 1 ns, and the data-point spacing is 0.2 ns.
above the counting-error limitσN. This region we term
the “m/Qcalibration-limited regime”.
3. For the special case of a low signal-to-noise ratio and small χ (<∼2, strongly overlapping peaks), the over-lapping nature of the peak distribution increases σI
aboveσNin a manner which is dominated by the
over-lapping peak effect (as in Sect. 3.2) and not affected by them/Q calibration error. As discussed above, the ef-fect is stronger for the weaker child peak than it is for the stronger parent peak. This region we term the “over-lapping counting-error regime”, andσI∼σC.
In summary, for low signal-to-noise ion pairs (in our partic-ular examples for peak intensities of order 100 counts), the influence of them/Qcalibration imprecision onσIis
negli-gible, and the counting and overlapping effects discussed in Sects. 3.1 and 3.2 dominate. Indeed, in the absence ofm/Q calibration imprecision,σC(σarising only from counting
er-ror) for a given separationχincreases for both ions simply as the square root of the respective peak’s intensity. The same relationship is, as expected, also true forσIin the
counting-error-dominated regime. However, the introduction of m/Q calibration imprecision in the simulations leads to a higher σI for small values ofχthat sometimes greatly exceeds (e.g.
> 10–100 times larger) the precision introduced by counting error for overlapping ions alone.
The different regimes introduced in Fig. 4 can be visu-alised for a range ofIpand fixedRI=8 by representingσI
in an image plot as shown in Fig. 5 (top). The transition
be-tween the two regimes atχ=χdis shown superimposed as
the black line over the image. To enable quantitative determi-nation of this parameter, we defineχd as the point at which
σI=1.05·σ atχ=4∼σC. Forχ<χd, the areas of similar
σI appear predominantly as vertically orientated rectangles.
This shows how integrating to higher ion counts does not changeσI in the calibration-limited regime. The only case
forχ<χdwhere integrating improvesσI is for the
overlap-ping counting-error regime (small signal-to-noise ratio and smallχ ), seen by the small change inσI just above and left
of theχ=χdline forχ<∼1. In contrast, forχ>χd, the
ar-eas of similarσIappear as horizontally orientated rectangles.
This is the counting-error regime, and integrating to higher ion counts will improveσI. So long asχ>χd, peak
sepa-ration is unimportant for determination ofσI for both the
parent and child peaks.
3.5 Parameterisation of the intensity precision for overlapping ions withm/Qcalibration error: independent parameters
Since our simulations are complex and time consuming, a pa-rameterisation of the value ofσB, the limiting precision due
tom/Qcalibration imprecision, is desirable in assessing fit-ting precision. We note that, in the case of high ion counts, σB∼σI, for uncertainty arising from counting error is
103 104 105 106 107 108 109
Intensity of parent (counts)
4 3 2 1
CHILD 4
3 2 1
PARENT Norm. peak separation c (dt/HWHM)
0.01 0.1 1 10 100 1000
Rel. st. dev. of retrieved
I (
s
I) (%)
Calibration-limited regime
Counting-error regime
Overlapping, counting-error regime
Figure 5. Actual precision in the normalised fitted peak intensitiesσI for an overlapping ion pair. The stronger (parent) peak is 8 times as
intense as the weaker (child) peak. The precision is represented by the colour scale and shown for a range of peak intensities and separations. The black lines denote the peak separation at or below which an ion would be considered to be in the calibration-limited regime.
along the same line (with the exception of the overlapping counting-error regime). This implies thatσBis insensitive to
peak intensity. Further simulations were thus conducted to assess the sensitivity ofσB to various parameters in the fit,
altering one parameter at a time and holding the peak inten-sity ratio RI fixed at 2. These results are reduced to scalar
values in Table 1 by reporting the value of σI for the child
peak atχ=1.0 for the default, and altered inputs. By con-sidering only results at high ion counts, we assumeσB∼σI
and thus effectively reportσBatχ=1.0.
Table 1 demonstrates that σB is insensitive to changes
in the spectrometer resolving power, data-acquisition rate (point spacing) and peak intensity. Only increasing the es-timate of imprecision in them/Qcalibration had an appre-ciable impact on the simulations. Tripling the calibration im-precision roughly doubledσB. A conservative estimate ofσB
could therefore be up to twice the values reported in this study (which we consider the best-case scenario) but is al-most certainly not going to be larger than that for a well-calibrated system.
Considered together, these observations imply that the pre-cision owing to calibration imprepre-cision, σB,can be
consid-ered a function of onlyχandRI and is independent ofW,δt
andIp.
3.6 Parameterisation of the intensity precision for overlapping ions withm/Qcalibration error: parameterisation
Given the weak dependence ofσBuponIp,Wandδtshown
in the previous section, we thus propose thatσBfor the child
peak in the resolving power range considered in this study (< 4000) can be empirically parameterised by fitting a poly-nomial in logσ-space to them/Qcalibration-limited regime section of the results for high signal-to-noise ratios (Fig. S3). In this regionσI ∼σB, i.e. the imprecision arising from
cali-bration effects, dominates and counting error can be
consid-ered negligible. This leads to the relationships
σB(child)=
RI
0.6
h
100.6−0.41(χ−0.4)−0.2(χ−0.4)2
i
, (3) σB(parent)=10(0.6−0.41(χ−0.4)−0.2(χ−0.4)
2)
. (4)
These equations are derived from simulations using the es-timated best-achievable calibration precision. Following Ta-ble 1, a more conservative approach might choose values up to double those calculated using these formulae, according to the expected imprecision in them/Qcalibration. We note that, although the relationships are independent of resolving power, intensity and sample interval as shown in Table 1, for application to the child peak it does it does depend linearly on the intensity ratioRI.
Given thatσN is independent ofχ and easily calculated
fromW, δt,IpandRIusing Eq. (1), it is possible to describe
the minimum estimated precision onIc as the larger of the
calculatedσN and parameterisedσB. The two lines cross at
χd, the value ofχ at whichσI is observed to diverge from
the counting-error limit of an isolated peak. Forχ<χd,σI
can be estimated from the parameterisation ofσB, whereas
forχ>χd,σI can be calculated directly and is equal toσN.
This estimate of precision, whilst predominantly gener-ally applicable for the resolving power range considered in this study, does break down in the overlapping counting-error regime (low signal-to-noise ratio and small peak separation). This is apparent when studying Fig. 4, which demonstrates that a maximum underestimate (at very lowχ )inσIof 2 and
5 would be expected forIp=10 and 100 counts respectively.
The parameterisation described here thus describes the best-case scenario and should be regarded as an estimate of the lower limit ofσI expected for a given system.
An example of the application of these results is given in Fig. 6. Lines of constantσBare estimated for a range of peak
intensity ratiosRI and separationχ using the
parameterisa-tion described above. These are plotted together with markers representingRIandχfor the less-intense (child) peak of all
Table 1. Changes in precision in fitted intensity of the child peak when altering properties of the fitting procedure and its input distributions,
whilst holding the peak intensity ratio constant at 2.
Parameter adjusted σIatχ=1.0 σIatχ=1.0
for default value for adjusted value
Calibration 35 % at 5 ppm 64 % at 10 ppm 82 % at 15 ppm
imprecision
Resolving power 35% at 1000 32 % at 500 41 % at 2000
Intensity 35 % at 104counts 35 % at 105counts 35 % at 107counts
Sample interval 35 % at 1 ns 34 % at 0.5 ns 35 % at 2 ns
real experimental data for the CalNex data set (Hayes et al., 2013).χcan be calculated directly from the list;RI is
how-ever calculated from the fit results for a representative aver-age spectrum taken from the campaign data set and is there-fore subject to the same sources of imprecision discussed in this study. The influence of additional overlapping peaks is also ignored. Nonetheless, representation of the fitted peak pairs in this space provides a useful overview of the reliabil-ity of the fitted intensities.σNis represented by colouring the
data points similarly to the predicted lines of precision from the parameterisation of σB. The estimated precision is thus
the larger of the two. In this example, the peaks fitted mostly exhibit good separation, and counting error is the limiting factor. It is noted that the region forχ< 0.4 was not explicitly studied as part of this work, and the lines of estimated pre-cision would have no meaning as χ approached zero. This region is thus not shown on the plot.
The optimal experimental setup for a given ion pair is where χ=χd, for then intensity imprecision due to m/Q
calibration is negligible, but the number of points measured across the peak is maximised.
To demonstrate the application of the parameterisation to a problem relevant to the atmospheric-science community that provided motivation for this study, we take three com-monly observed ions in HR-ToF-AMS spectra as an example: C2H3O+(m/Q=43.015 Th), C3H+7 (43.054) and C2H5N+
(43.043). Müller et al. (2011) concluded that C2H3O+and
C2H5N+ were distinguishable applying fits to a spectrum
with mass resolving power 1000 (i.e. χ=1.3); from our parameterisation, a constrained fit to these peak positions would retrieve the peak intensity to within a precision of 5% only forRI< 6 (assuming sufficient counting statistics), even
though the presence of both the peaks may be evident in the spectrum for higherRI (the overlapping peaks for this
sce-nario are exemplified in Fig. S4). For the closely separated C3H+7 and C2H5N+ ions, Farmer et al. (2010) concluded
that a mass resolving power of 5000 would be desirable; this would result inχ=2.5 and thus a 25 % precision onIcfor
RI as high as 400. Up to 1 % precision would be achievable
forRI ∼15 (the overlapping peaks for this scenario are
ex-emplified in Fig. S5). With half this resolving power the same precision can only be expected forRIless than∼20.
Figure 6. Ratio of fitted peak intensities to true peak separation
for the smaller ion from all pairs of ions used in analysis of the CalNex field campaign data from a high-resolution aerosol mass spectrometer (Hayes et al., 2013). Superimposed are lines of con-stant estimated precision on fitted peak intensity. The data points are coloured according to the precision in fitted peak intensity expected from counting statistics. The data-point spacing is 0.2 ns, and peak width is 1 ns.
4 Conclusions
no additional impact. The transition between the counting error and calibration-limited regime depends on the inten-sity of the peaks but is only weakly sensitive to their abso-lute width. Thus a general parameterisation can be developed which describes the lower limits in peak separation and inten-sity that are required for a given precision in the fits. Except for cases of a poor signal-to-noise ratio (<∼100 counts), in-tegration to longer measurement timescales for an ion in the calibration-limited regime cannot improve the precision with which its peak intensity can be retrieved; in order to move the ion into the counting-error regime, higher resolving power would be required.
Appendix A: Glossary
χ Peak separation normalised to half-width at
half-maximum (HWHM)
χd Peak separation below which ion would be considered
to be in them/Qcalibration-limited regime
I Peak intensity (in number of ion counts)
Itrue True peak intensity
Ifitted Fitted peak intensity
1 Normalised deviation in fitted peak intensity
(Ifitted−Itrue)/Itrue
Ip Peak intensity of parent (dominant) peak in an
overlapping pair
Ic Peak intensity of child (non-dominant) peak in an
overlapping pair
RI Ratio of parent-to-child intensities for an overlapping
ion pair (Ip/Ic)
σI Normalized precision of the fitted peak intensity owing
to all sources of error (%)
σC Normalized precision of the fitted peak intensity owing
to counting error only (%)
σN Minimum achievableσI owing to counting error for
an isolated ion (%)
σB Minimum achievableσI owing tom/Qcalibration
imprecision (%)
SA Standard deviation in fitted peak amplitude
St Standard deviation in fitted centroid iToF position
W Peak width (ns)
δt Data-point spacing (ns)
dt Separation of the known peak positions in
time-of-flight space
iToF Ion time of flight
“Imprecision” is qualitatively used to describe the repeatability of results
The Supplement related to this article is available online at doi:10.5194/amt-8-2333-2015-supplement.
Acknowledgements. This work was partially supported by NSF
AGS-1243354 and AGS-1360834, NOAA NA13OAR4310063, NASA NNX12AC03G, and DOE (BER, ASR) DE-SC0011105. We thank Marc Gonin for useful discussions on this topic. We thank D. Sueper for providing the CalNex data.
Edited by: F. Stroh
References
Bantscheff, M., Schirle, M., Sweetman, G., Rick, J., and Kuster, B.: Quantitative mass spectrometry in proteomics: a critical review, Anal. Bioanal. Chem., 389, 1017–1031, doi:10.1007/s00216-007-1486-6, 2007.
Bantscheff, M., Lemeer, S., Savitski, M. M., and Kuster, B.: Quan-titative mass spectrometry in proteomics: critical review update from 2007 to the present. Anal. Bioanal. Biochem., 404, 939– 965, doi:10.1007/s00216-012-6203-4, 2012.
Blom, K. F.: Utility of Peak Shape Analyses in Determining Unre-solved Interferences in Exact Mass Measurements at Low Reso-lution, J. Am. Soc. Mass Spectrom., 9, 789–798, 1998.
Cappellin, L., Biasioli, F., Fabris, A., Schuhfried, E., Soukoulis, C., Märk, T. D., and Gasperi, F.: Improved mass accuracy in PTR-TOF-MS: Another step towards better compound iden-tification in PTR-MS, Int. J. Mass Spectrom., 290, 60–63, doi:10.1016/j.ijms.2009.11.007, 2009.
Cappellin, L., Biasioli, F., Granittoc, P. M., Schuhfried, E., Souk-oulis, C., Costa, F., Märk, D. T., and Gasperi, F.: On data analy-sis in PTR-TOF-MS: From raw spectra to data mining. Sensors and Actuators B, 155, 183–190, doi:10.1016/j.snb.2010.11.044, 2011.
DeCarlo, P. F., Kimmel, J. R., Trimborn, A., Northway, M. J., Jayne, J. T., Aiken, A. C., Gonin, M., Fuhrer, K., Horvath, T., Docherty, K., Worsnop, D. R., and Jimenez, J. L.: field-deployable, high-resolution, Time-of-Flight Aerosol Mass Spectrometer, Anal. Chem., 78, 8281–8289, 2006.
Farmer, D. K. and Jimenez, J. L.: Real-time atmospheric chemistry field instrumentation, Anal. Chem., 82, 7879–7884, 2010. Farmer, D. K., Matsunaga, A., Docherty, K. S., Surratt, J. D.,
Se-infeld, J. H., Ziemann, P. J., and Jimenez, J. L.: Response of an aerosol mass spectrometer to organonitrates and organosulfates and implications for atmospheric chemistry, PNAS, 107, 6670– 6675, 2010.
Fraga, C. G. and Corley, C. A.: The chemometric resolution and quantification of overlapped peaks form comprehensive two-dimensional liquid chromatography, J. Chromatography A, 1096, 40–49, 2005.
Gardner, R. P., Ai, X., Peeples, C. R., Wang, J., Lee, K., Peeples, J. L., and Calderon, A.: Use of an iterative convolution approach for qualitative and quantitative peak analysis in low 15 resolution gamma-ray spectra, Symposium on Radiation Measurements and Applications (SORMA) XII 2010, Nucl. Instrum. Meth. A, 652, 544–549, 2011.
Haimi, P., Uphoff, A., Hermansson, M., and Somerharju, P.: Soft-ware Tools for Analysis of Mass Spectrometric Lipidome Data, Anal. Chem., 78, 8324–8331, doi:10.1021/ac061390w, 2006. Hammed, M. A., Gray, P. W., Naboulsi, A. H., and MacMahon,
T. H.: Analytical peak fitting for gamma-ray spectrum analysis with Ge detectors. Nuclear Instruments and Methods in Physics Research Section A: Accelerators, Spectrometers, Detectors and Associated Equipment, 334, 543–550, 1993.
Hayes, P. L., Ortega, A. M., Cubison, M. J., Froyd, K. D., Zhao, Y., Cliff, S. S., Hu, W. W., Toohey, D. W., Flynn, J. H., Lefer, B. L., Grossberg, N., Alvarez, S., Rappenglück, B., Taylor, J. W., Allan, J. D., Holloway, J. S., Gilman, J. B., Kuster, W. C., de Gouw, J. A., Massoli, P., Zhang, X., Liu, J., Weber, R. J., Corrigan, A. L., Russell, L. M., Isaacman, G., Worton, D. W., Kreisberg, N. M., Goldstein, A. H., Thalman, R., Waxman, E. M., Volkamer, R., Lin, Y. H., Surratt, J. D., Kleindienst, T. E., Offenberg, J. H., Dusanter, S., Griffith, S., Stevens, P. S., Brioude, J., Angevine, W. M., and Jimenez, J. L.: Organic aerosol composition and sources in Pasadena, California, during the 2010 CalNex campaign, J. Geophys. Res.-Atmos., 118, 9233–9257, 2013.
Hilmer, J. K. and Bothner, B.: Physical signal modulation of time-of-flight mass analyzers increases precision and decreases noise, Rapid Commun. Mass Spectrom., 25, 795–805, 2001.
Horn, D. M., Zubarev, R. A., and McLafferty, F. W.: Automated reduction and interpretation of high resolution electrospray mass spectra of large molecules, J. Am. Soc. Mass Spectrom., 11, 320– 332, doi:10.1016/S1044-0305(99)00157-9, 2000.
House, L. L., Clyde, M. A., and Wolpert, R. L.: Baysian non-parametric models for peak identification in MALDI-TOF mass spectroscopy, Ann. Appl. Stat., 5, 1488–1511, doi:10.1214/10-AOAS450, 2011.
Jaitly, N., Mayampurath, A., Littlefield, K., Adkins, J. N., Ander-son, G. A., and Smith, R. D.: Decon2LS: An open-source soft-ware package for automated processing and visualization of high resolution mass spectrometry data, BMC Bioinformatics, 10, 87, doi:10.1186/1471-2105-10-87, 2009.
Jokinen, T., Sipilä, M., Junninen, H., Ehn, M., Lönn, G., Hakala, J., Petäjä, T., Mauldin III, R. L., Kulmala, M., and Worsnop, D. R.: Atmospheric sulphuric acid and neutral cluster measure-ments using CI-APi-TOF, Atmos. Chem. Phys., 12, 4117–4125, doi:10.5194/acp-12-4117-2012, 2012.
Junninen, H., Ehn, M., Petäjä, T., Luosujärvi, L., Kotiaho, T., Kos-tiainen, R., Rohner, U., Gonin, M., Fuhrer, K., Kulmala, M., and Worsnop, D. R.: A high-resolution mass spectrometer to mea-sure atmospheric ion composition, Atmos. Meas. Tech., 3, 1039– 1053, doi:10.5194/amt-3-1039-2010, 2010.
Kilgour, D. P. A., Mackay, C. L., Langridge-Smith, P. R. R., and O’Connor, P. B.:Appropriate Degree of Trust: Deriv-ing Confidence Metrics for Automatic Peak Assignment in High-Resolution Mass Spectrometry, Anal. Chem., 7431–7435, doi:10.1021/ac301339d, 2012.
Krupcik, J., Mydlova, J., Spanik, I., Tienpont, B., and San-dra, P.: Computerized separation of chromatographically
unresolved peaks. J. Chromotography A, 1084, 80–89,
doi:10.1016/j.chroma.2004.09.073, 2005.
Laeven, J. M. and Smit, H. C.: Optimal peak area determination in the presence of noise, Anal. Chim. Acta, 176, 77–104, 1985. Link, A. J., Eng, J., Schieltz, D. M., Carmack, E., Mize, G. J.,
protein complexes using mass spectrometry, Nature Biotechnol., 17, 676–682, 1999.
Lee, H.-N. and Marshall, A. G.: Theoretical Maximal Precision for Mass-to-Charge Ratio, Amplitude, and Width Measurements in Ion-Counting Mass Analyzers, Anal. Chem., 72, 2256–2260, 2000.
Meija, J. and Caruso, J. A.: Deconvolution of Isobaric Interferences in Mass Spectra, J. Am. Soc. Mass Spectrom., 15, 654–658, 2004.
Mirgorodskaya, O. A., Kozmin, Y. P., Titov, M. I., Körner, R., Sönksen, C. P., and Roepstorff P.: Quantitation of peptides and proteins by matrix-assisted laser desorption/ionization mass spectrometry using18O-labeled internal standards, Rapid Com-mun. Mass Spectrom., 14, 1226–1232, 2000.
Müller, M., George, C., and D’Anna, B.: Enhanced Spectral Analy-sis of C-TOF Aerosol Mass Spectrometer Data: Iterative Resid-ual Analysis and Cumulative Peak Fitting. Int. J. Mass Spec-trom., 306, 1–8, doi:10.1016/j.ijms.2011.04.007, 2011. Strittmatter, E. F., Rodriguez, N., and Smith, R. D.: High Mass
Mea-surement Accuracy Determination for Proteomics Using Multi-variate Regression Fitting: Application to Electrospray Ioniza-tion Time-Of-Flight Mass Spectrometry, Anal. Chem., 75, 460– 468, 2003.
Sun, Y. T., Zhang, J. Q., Braga-Neto, U., and Dougherty, E. R.: BPDA – A Bayesian peptide detection algorithm for mass spectrometry, BMC Bioinformatics, 11, 490, doi:10.1186/1471-2105-11-490, 2010.
Titzmann, T., Grausb, M., Müller, M., Hansel, A., and Oster-mann, A.: Improved peak analysis of signals based on count-ing systems: Illustrated for proton-transfer-reaction time-of-flight mass spectrometry, Int. J. Mass Spectrom., 295, 72–77, doi:10.1016/j.ijms.2010.07.009, 2010.
Uher, J., Roach, G., and Tickner, J.: Peak fitting and identification software library for high resolution gamma-ray spectra, Nucl. In-strum. Meth. A, 619, 457–459, doi:10.1016/j.nima.2009.12.086, 2010.
Yatavelli, R. L. N., Lopez-Hilfiker, F., Wargo, J. D., Kimmel, J. R., Cubison, M. J., Bertram, T. H., Jimenez, J. L., Gonin, M., Worsnop, D. R., and Thornton, J. A.: A Chemical Ionization High-Resolution Time-of-Flight Mass Spectrometer Coupled to a Micro Orifice Volatilization Impactor (MOVI-HR-ToF-CIMS) for Analysis of Gas and Particle-Phase Organic Species, Aerosol Sci. Technol., 46, 1313–1327, 2012.