Jorge Eiras-Barca , Francina Dominguez , Huancui Hu , Daniel Garaboa-Paz , and Gonzalo Miguez-Macho1
1Non-Linear Physics Group, Universidade de Santiago de Compostela, Galicia, Spain
2Department of Atmospheric Sciences, University of Illinois at Urbana–Champaign, Urbana–Champaign, IL,
USA
Correspondence:Jorge Eiras-Barca ([email protected], [email protected])
Received: 16 June 2017 – Discussion started: 27 June 2017
Revised: 23 October 2017 – Accepted: 31 October 2017 – Published: 22 December 2017
Abstract. A new 3-D tracer tool is coupled to the WRF model to analyze the origin of the moisture in two extreme atmospheric river (AR) events: the so-called “Great Coastal Gale of 2007” in the Pacific Ocean and the “Great Storm of 1987” in the North Atlantic. Results show that between 80 and 90 % of moisture advected by the ARs, and a high percentage of the total precipitation produced by the systems have a tropical origin. The tropical contribution to precipitation is in general above 50 % and largely exceeds this value in the most affected areas. Local convergence transport is responsible for the remaining moisture and precipitation. The ratio of tropical moisture to total moisture is maximized as the cold front arrives on land. Vertical cross sections of the moisture content suggest that the maximum in tropical humidity does not necessarily coincide with the low-level jet (LLJ) of the extratropical cyclone. Instead, the amount of tropical humidity is maximized in the lowest atmospheric level in southern latitudes and can be located above, below or ahead of the LLJ in northern latitudes in both analyzed cases.
1 Introduction
Atmospheric rivers (hereafter, ARs) are long and narrow structures in the lower troposphere that carry large amounts of water vapor (Zhu and Newell, 1998). Guan and Waliser (2015) have estimated that ARs have a median length of about 3600 km, a median length/width ratio of about 7 and a mean integrated vapor transport (IVT) of 370 kg m−1s−1. ARs are associated with the pre-cold frontal region and the warm conveyor belt (WCB) of extratropical cyclones (Gi-meno et al., 2016). The maximum moisture flux often occurs within the low-level jet (LLJ) located at around 1 km height along the cold frontal boundary, and for this reason ARs and the LLJ are sometimes identified with each other (Dettinger et al., 2015). However, to account for most of the high IVT and moisture content defining an AR, usually a wider region encompassing the layers below 2.5 km ahead of the cold front
must be considered (Ralph et al., 2004, 2005). On occasion, the relationship between ARs and cyclones has been shown to be complex, with documented cases in which multiple cy-clones are associated with a single AR (Sodemann and Stohl, 2013).
world-1248 J. Eiras-Barca et al.: Moisture sources in ARs using WRF tracers
wide (e.g., Mahoney et al., 2016; Mundhenk et al., 2016). It is important to better understand the physical mechanisms leading to extreme flooding associated with ARs, considering their impacts on human and natural systems and the mount-ing evidence that ARs are projected to become more frequent and intense in the future (e.g., Dettinger, 2011; Lavers et al., 2013; Payne and Magnusdottir, 2015).
Between three and five ARs can be found per hemisphere at any given time (Zhu and Newell, 1998), accounting for approximately 84 % of the meridional IVT for the North-ern Hemisphere and about 88 % in the SouthNorth-ern Hemisphere (Guan and Waliser, 2015). Since these structures can trans-port an amount of precipitable water equivalent to several times the discharge of the Mississippi River (Ralph and Det-tinger, 2011), ARs have been identified as a primary feature of the global water cycle.
There are several proposed methods of AR detection, most of which are based on thresholds of integrated water va-por (IWV) and/or IVT, shape criteria, and from satellite or reanalysis data (e.g., Ralph et al., 2004; Bao et al., 2006; Lavers et al., 2011, 2012; Dettinger, 2011; Nayak et al., 2014; Ramos et al., 2015; Eiras-Barca et al., 2016; Brands et al., 2016). Guan and Waliser (2015) developed a global de-tection method using filters of intensity, direction, geometry and coherence of the structures. More recently, Eiras-Barca et al. (2016) proposed a combined IVT and IWV variable-threshold detection algorithm, which operates both in sum-mer and winter months. These objective detection criteria have shown that AR structures of IWV and IVT can extend from the tropics into midlatitudes; however, they do not pro-vide information about the source and sink regions of AR water vapor.
Tropical moisture exports have been identified as a pri-mary source of moisture for ARs in Europe and the US West Coast (Dettinger et al., 2015). AR structures link re-mote sources of moisture from the tropics to midlatitudes through long corridors of advection (e.g., Knippertz and Wernli, 2010; Sodemann and Stohl, 2013; Knippertz et al., 2013; Ryoo et al., 2015; Ramos et al., 2015). These stud-ies have primarily used backward Lagrangian tools to evalu-ate the source–sink regions. However, moisture from midlat-itudes (local sources) has also been identified as an important source of water vapor convergence in AR events (Dettinger et al., 2015). Ramos et al. (2016) used the FLEXible PARTi-cle dispersion model (FLEXPART) to show that both tropi-cal and lotropi-cal sources of moisture are present in AR landfall events for different European latitudes.
Some authors argue that local sources are primarily re-sponsible for the high water vapor content within the AR core (Bao et al., 2006; Cordeira et al., 2013; Dacre et al., 2014). By calculating the water vapor budget of 200 extratropical cyclones, Dacre et al. (2014) conclude that tropical mois-ture reaching the extratropics only contributes to mid-level moisture, above the boundary layer. Following this perspec-tive, ARs can be thought of as the footprints left behind the
cyclone pathway, and not as a conduit for meridional trans-port of water vapor and latent heat. One possible explana-tion for the lack of agreement may be the sensitivity to the physics and parametrization schemes used in the latter anal-ysis (Brands et al., 2016). The current understanding is that tropical moisture exports can provide a significant amount of moisture to ARs. Most of them also incorporate midlatitude sources of vapor along their path (Dettinger et al., 2015).
Considering that there is still an important discussion re-lated to the origin of moisture in ARs, in this paper, we use a new forward moisture tracer tool coupled to the Weather Research and Forecast (WRF) model (Miguez-Macho et al., 2013; Dominguez et al., 2016; Insua-Costa and Miguez-Macho, 2017) to evaluate the moisture sources of two par-ticularly extreme AR case studies, as well as the transport mechanism of this humidity. The selected cases were associ-ated with extreme precipitation and flooding that led to sig-nificant socioeconomic impacts. The first selected AR devel-oped over the Pacific Ocean and affected the western coast of North America, whereas the second AR developed over the Atlantic Ocean and impacted the western coast of the Iberian Peninsula. The tracer tool allows us to track the trop-ical moisture associated with these two events and evalu-ate the relative contribution of this tropical moisture to total moisture and precipitation. In addition, the WRF tracer tool also provides information about the vertical distribution of tropical moisture, as well as the position of the maximum of moisture with regard to the LLJ.
2 Data and methods
2.1 Data
Both events were very intense in terms of IVT and IWV and are well detected by different methods (Guan and Waliser, 2015; Eiras-Barca et al., 2016; Brands et al., 2016). The first AR occurred on December 2007, affecting mostly the Pa-cific Northwest region of the United States (Fig. 1a–d). Lo-cally known as the “Great Coastal Gale of 2007”, this event primarily impacted the western state of Washington, and the associated flooding resulted in approximately USD 680 mil-lion direct losses from three severely impacted counties in the state (Avelino and Dall’erba, 2016; Dominguez et al., 2017) and 11 fatalities (NOAA, 2008). Formed from the remnants of the two typhoons Hagibis and Mitag, the event produced hurricane force winds (Crout et al., 2008). The rapid and ex-plosive development of the cyclone (the central pressure fell more than 24·sinϕ/sin (60◦) hPa in 24 h, whereϕis the given latitude) is shown in Figs. 1a–d and A1 in Appendix A. The selected AR case was the third and most intense of a series of three storms and led to extreme precipitation (NOAA, 2008). The landfalling event and the resulting precipitation is shown in Figs. 1d and 2d, respectively.
Figure 1.Integrated vapor transport (IVT, vectors, kg m−1s−1), sea level pressure (isobars, hPa) and integrated water vapor (IWV, back-ground, kg m−2) fields for both the Great Coastal Gale of 2007(a–d)and the Great Storm of 1987(e–h)events throughout a 4-day time frame. Source: ERA-Interim.
low pressure system catching up from behind. Both systems originated from typhoons and already had a high water va-por content. The interaction between the two resulted in an instant occlusion-like mechanism that led to the rapid deep-ening of the combined cyclone over the Pacific.
Figure 1h shows the explosive cyclogenesis for the Euro-pean event. In this case, there is also a complex development process, with the interaction between the remnants of a trop-ical system with high water vapor content and a wave on the long frontal boundary across the North Atlantic as a precur-sor of the explosive cyclogenesis occurring northwest of the Iberian Peninsula (see Fig. A2 in Appendix A).
The water vapor signature of the second case, which devel-oped during October 1987, extended from the western tropi-cal Atlantic Ocean to the Iberian Peninsula and British Isles. This event is the well-known “Great Storm of 1987”, with re-ported losses of millions of pounds and 18 fatalities over the British Isles (e.g., Burt and Mansfield, 1988). For this case, Shutts (1990) showed that two-thirds of the central pressure falling could be ascribed to latent heat release, which sug-gests that the AR played a key role in the fast deepening of the cyclone (35 hPa of pressure drop in 24 h) (Fig. 1f–h). Fig-ure A1 in Appendix A shows how the cooperative linkage between a trough in the tropopause and low-level baroclin-icity contributed to the rapid growth of the system as well (Hoskins and Berrisford, 1988). The resulting precipitation (Fig. 2b) was reported at above 100 mm throughout the Span-ish region of Galicia, shown in Fig. 2b.
2.2 The Eulerian tracer tool
The Eulerian tracer model is based on coupling a moisture tagging technique with the WRF meteorological model. The strategy consists in replicating the prognostic equations for the different moisture species with equations for moisture tracers. A moisture tracer in this context is defined as mois-ture originating from a predetermined source. The set of equations for tracers is solved coupled to the model’s gov-erning equations, meaning that tracers undergo turbulent dif-fusion with the same eddy diffusivities as their full mois-ture counterparts, and that convection and microphysics pro-cesses for tracers mimic those for full moisture, with the assumption that phase changes among the different tracer species occur in amounts proportional to the tracer fraction in the species undergoing the change. The tracer tool run-ning coupled to the model can separate moisture from differ-ent sources with a very small error (less than 1 % in trace-ability). Thus, the tracer tool is very accurate in the model world, while the uncertainty in the real word is due to the WRF model error. A more in-depth description of the Eule-rian tracer tool and validation results can be found in Insua-Costa and Miguez-Macho (2017).
evap-1250 J. Eiras-Barca et al.: Moisture sources in ARs using WRF tracers
Figure 2.WRF output total precipitation for the Great Coastal Gale of 2007(a)and the Great Storm of 1987(c)against observations from LIVNEH(b)and IBERIA02(d)for the same 24 h period.
orated from a two-dimensional region at the surface (e.g., Dominguez et al., 2016; Arnault et al., 2016), in this study all the moisture in a three-dimensional volume (including the water vapor evaporated and advected into the masked region) is tracked in space and time. For details, see Insua-Costa and Miguez-Macho (2017). Figure 3 shows the masks labeled in red for the Pacific (panel a) and Atlantic (panel b) simula-tions. Once the simulation starts, the model tracks the hu-midity originating from within the mask at any time, and the quantity of this moisture is known in relation to the to-tal moisture content at each point of the domain, throughout the entire simulation. Similar to the rest of the moisture, the “tagged” water vapor can change phase, and the fraction of the condensed phase to the total condensate is also reported in the model output.
2.3 WRF simulations setup
We use WRF 3.4.1 to simulate these two events. For the Pacific case, the WRF horizontal resolution is 15 km and the vertical column is divided into 40 levels. For the
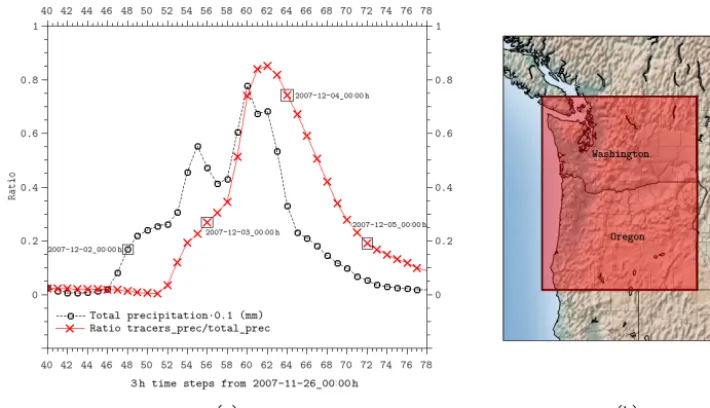
Ska-Figure 3.Domains of the WRF simulation (blue) for the Great Coastal Gale of 2007(a)and the Great Storm of 1987(b). Areas highlighted in red correspond to the masked region where the moisture is initially labeled as tracer.
Figure 4.Absolute value of IVT in kilograms per meter per second for the Pacific event from WRF(a)and MERRA(b)as well as for the Atlantic event from WRF(c)and MERRA(d).
marock et al. (2005) or Michalakes et al. (2005). Finally, con-sidering that the ECMWF reanalysis (ERA-Interim) has been shown to be a reliable tool in the analysis of ARs (Rutz et al., 2014), the dataset provides lateral boundary and initial con-ditions for the runs.
1252 J. Eiras-Barca et al.: Moisture sources in ARs using WRF tracers
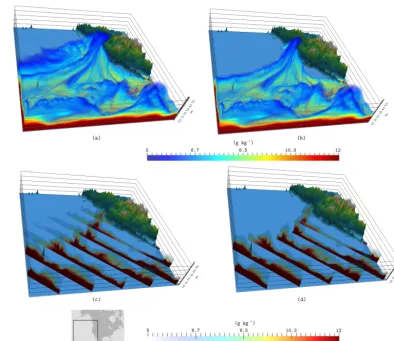
Figure 5.(a)Total water vapor mixing ratio in grams per kilogram at 3 December 2007 12:00 UTC for the Pacific domain.(b)Tracers water vapor mixing ratio in grams per kilogram at the same time and domain.(c)Vertical cross sections of(a).(d)Vertical cross sections of(b).
from different sources. Given that the subject of this study is moisture transport and precipitation, we focus validations on these two variables.
Finally, the integrated column of water vapor, and the in-tegrated column of water vapor tracers (IWVTR) can both be calculated from the WRF simulations using Eqs. (2) and (3), respectively, whereq is the specific humidity,gis gravity,u andv represent the wind fields, sfc is the land surface, and l is the highest model level, well above the tropopause. The conversion between specific humidity (q) and mixing ratio (w) has been performed using Eq. (4).
IVT= 1 g
l
Z
sfc qudp
(1)
IWV=1 g
l
Z
sfc
qdp (2)
IWVTR= 1 g
l
Z
sfc
qTRdp (3)
q= w
w+1, with w1⇒q≈w (4)
u=(u, v) (5)
3 Results and discussion
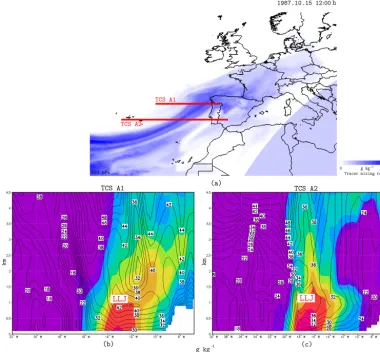
Ap-Figure 6.Same as Fig. 5 but for the European domain in the Great Storm of 1987 (15 October 1987 at 12:00 UTC).
plications (MERRA) (Rienecker et al., 2011) is provided in Fig. 4.
Whereas the simulated IVT field is realistic when com-pared to observations, WRF tends to overestimate precipi-tation. The overestimation is particularly high in the moun-tains of Oregon and Washington for the 2007 event. How-ever, despite the fact that precipitation is arguably the most difficult variable to simulate in a numerical model (e.g., Ma-raun et al., 2010; Buckley and Marshall, 2016), the spatial pattern of precipitation is realistically represented.
Figure 5 shows the three-dimensional distribution of water vapor mixing ratio (panel a), and tracer water vapor mixing ratio (panel b) for the event in the Pacific that made land-fall along the US West Coast. While the former accounts for the total amount of moisture, the latter shows only the mois-ture originating from tropical latitudes, labeled with the 3-D mask depicted in Fig. 3. The simulation was started 8 days before the time shown in Fig. 5. Panels (c) and (d) show a snapshot of the water vapor mixing ratio and the tracer wa-ter vapor mixing ratio in the form of a series of cross-section slices that allow the visualization of the vertical distribution of moisture. The images suggest that the vast majority of the
moisture contained in the pre-frontal region has its origin in the tropical regions. This is especially true at lower latitudes. The maximum content of tropical moisture remains mostly in the lower levels. The high moisture values behind the front and at the leading edge of the AR structure, where the WCB is located, are not related to tropical advection and are thus generated by convergence of moisture from local sources oc-curring along the frontal region. Slightly different conclu-sions are obtained for the Atlantic case study shown in Fig. 6. For the sake of simplicity, only the eastern longitudes of the domain of simulation are shown. Even though the tropical moisture still remains in the lowest levels of the troposphere, its contribution to the total is less significant than for the Pa-cific case study. The reason is shown in Fig. 1e–h, indicating that most of the connection of the WCB with tropical regions is through a much longer path, due to the blocking position of the Azores High.
1254 J. Eiras-Barca et al.: Moisture sources in ARs using WRF tracers
Figure 7.(a)Ratio of tagged water vapor to total water vapor for the Pacific event.(b)Same as(a)but for precipitation. Panels(c, d)are equivalent to(a, b), respectively, but for the Atlantic event.
These high percentages extend inland along the northwest-ern US coastal regions. Likewise, Fig. 7b shows the 24 h accumulated percentage of precipitation that is composed of condensed tropical water vapor (PrecTR/Prec). For clar-ity, we only plot the region where precipitation exceeded 3 mm day−1(Buishand, 1978). Precipitation of tropical ori-gin accounts for 70 to 90 % of total precipitation from north-ern California to southnorth-ern Oregon, and the ratio decreases at higher latitudes. Interestingly, tropical moisture is funneled by local topography, and it contributes to about 70 to 80 % of precipitation west of the Cascade Range. In the Atlantic case, we also see a clear plume where tropical water vapor accounts for more than 80 % of precipitable water; however, the percentage decreases to around 70 % close to the cen-ter of the system and just before arriving on the Iberian coast (Fig. 7c–d). In this case, cyclogenesis occurs just off the coast of Galicia, on the northwestern tip of the Iberian Peninsula, and thus the enhanced convergence of the existent local mois-ture feeds the AR and is involved in the heavy precipitation, which consequently is only between 60 and 80 % of tropical origin. The high ratios observed in mountainous ranges such as the Pyrenees and the Rockies, far ahead of the cold front and the AR associated with the systems, are very likely due
to the slantwise lift of tropical moisture in mid-levels along the warm frontal boundary.
Figure 8.Transversal cross sections along the central axis of the atmospheric river at latitudes 42.0 (transversal cross section P1), 37.4 (transversal cross section P2) and 30.6 (transversal cross section P3). The plots show the tracers’ water vapor mixing ratio in grams per kilogram together with the wind module in meters per second. The estimated position of the LLJ is shown in the figures as well.
well defined case from the perspective of vertically integrated quantities such as IVT and IWV.
An analogous plot for the Atlantic case is presented in Ap-pendix A (Fig. A2). The results are similar to the Pacific case, with no clear one-to-one connection between the LLJ and the maximum in tropical humidity. We note that no general conclusion can be obtained from particular case studies, but these results suggest that the perception that ARs are clearly associated with the LLJ of extratropical cyclones should be reviewed.
Figure 9a shows the area-averaged total precipitation (black circles) and the ratio between tracer precipitation and total precipitation (red crosses) throughout the region high-lighted in Fig. 9b for the Pacific event. As expected, the plot shows that the maximum in tropical precipitation is ob-served during the landfall of the cold front and the AR, which closely coincides with the maximum in total precipitation. The secondary maximum in the total precipitation observed 1 day before the landfall of the AR event is due to the landfall of the warm front associated with the cyclone (see Fig. A3).
The convergence of local moisture would be the dynamical source for precipitation in the warm front.
4 Conclusions
A new 3-D Eulerian forward water vapor tracer tool imple-mented in the WRF model has been used to analyze two important AR events. The first event developed over the Pacific Ocean and corresponds to the Great Coastal Gale of 2007 on the US Pacific West Coast, which resulted in an estimated USD 678 million in direct economic damages (Dominguez et al., 2017). The Atlantic event corresponds to an atmospheric river event in October 1987 that resulted in record winds of 100 km h−1and daily precipitation of over 100 mm day−1 in Galicia (in the northwest of Spain) and Portugal. In an effort to understand the origin of moisture for these two AR events, we use 3-D water vapor tracers to quantify the percentage of total precipitable water and pre-cipitation that originates from the tropics.
trop-1256 J. Eiras-Barca et al.: Moisture sources in ARs using WRF tracers
Figure 9.Evolution over time of the tropical precipitation (red crosses) and total precipitation (black circles) during the Pacific event(a). Data represent the spatial integration of both variables through the region highlighted in red in(b).
ical regions that we labeled with the 3-D tracer mask. Con-sequently, most of the precipitation that fell during these two events was composed of condensed tropical water vapor. The Pacific event shows a more intense connection with tropical regions than the Atlantic case. As a result, the percentage of tropical precipitation for this event over North America is higher and peaks around 85 %. Nevertheless, for the Atlantic event, still more than 60 % of the resulting precipitation is of tropical origin.
The two selected case studies have been chosen due to the associated severity of flooding and socioeconomic dam-ages. Both correspond to a strong AR feeding the system of a very intense extratropical storm. The conclusions drawn from these two AR events are thus not necessarily represen-tative of the bulk of Pacific or Atlantic AR events. However, the results highlight the importance of tropical moisture for the two case studies. We also find evidence that convergence of local moisture also contributes to total precipitable water, especially in the post-frontal region, the leading edge of the AR and in the far northern latitudes where the tropical link has weakened. It is well known that in a mature system, when baroclinic structures are well differentiated, the stored water vapor tends to be constant (e.g., Bullock and Johnson, 1971), and since the fate of tropical moisture is to precipitate, local convergence should keep the balance by lateral inflow.
Based on these results, we hypothesize that the highest amounts of precipitable water can only be attained in a sys-tem in which a clear tropical source of moisture is sustained until landfall. Strong ARs with a direct link to tropical lati-tudes should be expected to result in more precipitation than those with local convergence as a primary feeding mecha-nism. It is our aim for the future to extend this work by in-cluding more cases.
Finally, our findings suggest that the maximum of tropi-cal moisture does not necessarily coincide with the LLJ of either extratropical cyclone analyzed. Instead, this maximum is located near surface levels at lower latitudes to gradually ascend in northern latitudes, but still remaining below 2 km, mostly within the boundary layer, in contrast with findings in other studies (Dacre et al., 2014). The maximum of trop-ical moisture may be situated below and toward the back, or ahead of the LLJ, which is located along the cold front. Both events are clear examples of ARs from the point of view of vertically integrated variables, such as IWV and IVT used in most detection algorithms; however, the vertical distribution of moisture of tropical origin reflects the complex processes leading to precipitation. The new 3-D tracer tool will allow us to delve into these processes and explore the role of trop-ical moisture exports in the initiation and intensification of AR events.
Figure A1.Front maps for the Pacific Great Coastal Gale of 2007 event.
1258 J. Eiras-Barca et al.: Moisture sources in ARs using WRF tracers
Acknowledgements. This work has been founded by the Ministerio de Economía y Competitivad (CGL2013-45932-R) from the Spanish Government and its mobility grants for pre-doc researchers. Jorge Eiras-Barca would like to express his gratitude to the Department of Atmospheric Sciences of the University of Illinois at Urbana–Champaign for the kind support in this project. Funding for Dominguez and Hu comes from NASA grant NNX14AD77G.
Edited by: Diego G. Miralles
Reviewed by: Brianna Pagán, Ruud van der Ent, and Lan Wang-Erlandsson
References
Arnault, J., Knoche, R., Wei, J., and Kunstmann, H.: Evap-oration tagging and atmospheric water budget analy-sis with WRF: A regional precipitation recycling study for West Africa, Water Resour. Res., 52, 1544–1567, https://doi.org/10.1002/2015WR017704, 2016.
Avelino, A. and Dall’erba, S.: Comparing the economic impact of natural disasters generated by different input-output models. An application to the 2007 Chehalis River Flood (WA), North Amer-ican Regional Science Conference, Minneapolis, 2016. Bao, J.-W., Michelson, S. A., Neiman, P. J., Ralph, F. M., and
Wilczak, J. M.: Interpretation of Enhanced Integrated Water Va-por Bands Associated with Extratropical Cyclones: Their Forma-tion and ConnecForma-tion to Tropical Moisture, Mon. Weather Rev., 134, 1063–1080, https://doi.org/10.1175/MWR3123.1, 2006. Belo-Pereira, M., Dutra, E., and Viterbo, P.: Evaluation of global
precipitation data sets over the Iberian Peninsula, J. Geophys. Res., 116, D20101, https://doi.org/10.1029/2010JD015481, 2011.
Brands, S., Gutiérrez, J., and San-Martín, D.: Twentieth-century atmospheric river activity along the west coasts of Europe and North America: algorithm formulation, reanalysis uncertainty and links to atmospheric circulation patterns, Clim. Dynam., 48, 2771–2795, 2016.
Buckley, M. W. and Marshall, J.: Observations, inferences, and mechanisms of the Atlantic Meridional Overturning Circulation: A review, Rev. Geophys., 54, 5–63, 2016.
Buishand, T.: Some remarks on the use of daily rainfall models, J. Hydrol., 36, 295–308, 1978.
Dettinger, M.: Climate Change, Atmospheric Rivers, and Floods in California – A Multimodel Analysis of Storm Frequency and Magnitude Changes, J. Am. Water Resour. As., 47, 514–523, https://doi.org/10.1111/j.1752-1688.2011.00546.x, 2011. Dettinger, M., Ralph, F. M., and Lavers, D.: Setting the
stage for a global science of atmospheric rivers, Eos, 96,https://doi.org/10.1029/2015EO038675, 2015.
Dettinger, M. D., Ralph, F. M., Das, T., Neiman, P. J., and Cayan, D. R.: Atmospheric Rivers, Floods and the Water Resources of California, Water, 3, 445–478, https://doi.org/10.3390/w3020445, 2011.
Dominguez, F., Miguez-Macho, G., and Hu, H.: WRF with Water Vapor Tracers: A Study of Moisture Sources for the North Amer-ican Monsoon, J. Hydrometeorol., 17, 1915–1927, 2016. Dominguez, F., Dall’erba, S., Huang, S., Avelino, A., Mehran, A.,
Hu, H., Schmidt, A., Schick, L., and Lettenmaier, D.: Track-ing an Atmospheric River in a Warmer Climate: from Wa-ter Vapor to Economic Impacts, Earth Syst. Dynam. Discuss., https://doi.org/10.5194/esd-2017-64, in review, 2017.
Dudhia, J.: Numerical study of convection observed during the winter monsoon experiment using a mesoscale two-dimensional model, J. Atmos. Sci., 46, 3077–3107, 1989.
Eiras-Barca, J., Brands, S., and Miguez-Macho, G.: Seasonal vari-ations in North Atlantic atmospheric river activity and associa-tions with anomalous precipitation over the Iberian Atlantic Mar-gin, J. Geophys. Res.-Atmos., 121, 931–948, 2016.
Gimeno, L., Dominguez, F., Nieto, R., Trigo, R., Drumond, A., Reason, C. J., Taschetto, A. S., Ramos, A. M., Kumar, R., and Marengo, J.: Major mechanisms of atmospheric moisture trans-port and their role in extreme precipitation events, Annu. Rev. Env. Resour., 41, 117–141, 2016.
Gómez, B. and Miguez-Macho, G.: The impact of wave number se-lection and spin up time when using spectral nudging for dynam-ical downscaling applications, Geophys. Res. Abstr., EGU2017-18466, EGU General Assembly 2017, Vienna, Austria, 2017. Guan, B. and Waliser, D. E.: Detection of atmospheric rivers:
Eval-uation and application of an algorithm for global studies, J. Geo-phys. Res.-Atmos., 120, 12514–12535, 2015.
1260 J. Eiras-Barca et al.: Moisture sources in ARs using WRF tracers
Higgins, R., Schemm, J., Shi, W., and Leetmaa, A.: Extreme precipitation events in the western United States related to tropical forcing, journal of cli-mate, 13, 793–820, https://doi.org/10.1175/1520-0442(2000)013<0793:EPEITW>2.0.CO;2, 2000.
Hong, S.-Y. and Lim, J.-O. J.: The WRF single-moment 6-class mi-crophysics scheme (WSM6), J. Korean Meteor. Soc., 42, 129– 151, 2006.
Hong, S.-Y., Noh, Y., and Dudhia, J.: A new vertical diffusion pack-age with an explicit treatment of entrainment processes, Mon. Weather Rev., 134, 2318–2341, 2006.
Hoskins, B. and Berrisford, P.: A potential vorticity perspective of the storm of 15–16 October 1987, Weather, 43, 122–129, 1988. Hu, X.-M., Nielsen-Gammon, J. W., and Zhang, F.: Evaluation of
three planetary boundary layer schemes in the WRF model, J. Appl. Meteorol. Clim., 49, 1831–1844, 2010.
Hu, X.-M., Klein, P. M., and Xue, M.: Evaluation of the updated YSU planetary boundary layer scheme within WRF for wind resource and air quality assessments, J. Geophys. Res.-Atmos., 118, 10490–10505 https://doi.org/10.1002/jgrd.50823, 2013. Insua-Costa, D. and Miguez-Macho, G.: A new moisture
tag-ging capability in the Weather Research and Forecasting Model: formulation, validation and application to the 2014 Great Lake-effect snowstorm, Earth Syst. Dynam. Discuss., https://doi.org/10.5194/esd-2017-80, in review, 2017.
Kain, J. S.: The Kain–Fritsch convective parameterization: an up-date, J. Appl. Meteorol., 43, 170–181, 2004.
Kim, J., Waliser, D., Neiman, P., Guan, B., Ryoo, J.-M., and Wick, G.: Effects of atmospheric river landfalls on the cold season precipitation in California, Clim. Dynam., 40, 465–474, https://doi.org/10.1007/s00382-012-1322-3, 2013.
Knippertz, P. and Wernli, H.: A Lagrangian climatology of tropi-cal moisture exports to the Northern Hemispheric extratropics, J. Climate, 23, 987–1003, 2010.
Knippertz, P., Wernli, H., and Gläser, G.: A global climatology of tropical moisture exports, J. Climate, 26, 3031–3045, 2013. Lavers, D. A. and Villarini, G.: The nexus between atmospheric
rivers and extreme precipitation across Europe, Geophys. Res. Lett., 40, 3259–3264, https://doi.org/10.1002/grl.50636, 2013. Lavers, D. A. and Villarini, G.: The relationship between
daily European precipitation and measures of atmospheric water vapour transport, Int. J. Climatol., 35, 2187–2192, https://doi.org/10.1002/joc.4119, 2014.
Lavers, D. A., Allan, R. P., Wood, E. F., Villarini, G., Brayshaw, D. J., and Wade, A. J.: Winter floods in Britain are con-nected to atmospheric rivers, Geophys. Res. Lett., 38, L23803, https://doi.org/10.1029/2011GL049783, 2011.
Lavers, D. A., Villarini, G., Allan, R. P., Wood, E. F., and Wade, A. J.: The detection of atmospheric rivers in atmospheric reanal-yses and their links to British winter floods and the large-scale climatic circulation, J. Geophys. Res.-Atmos., 117, D20106, https://doi.org/10.1029/2012JD018027, 2012.
Lavers, D. A., Allan, R. P., Villarini, G., Lloyd-Hughes, B., Brayshaw, D. J., and Wade, A. J.: Future changes in atmospheric rivers and their implications for winter flooding in Britain, Environ. Res. Lett., 8, 034010, https://doi.org/10.1088/1748-9326/8/3/034010, 2013.
Leung, L. R. and Qian, Y.: Atmospheric rivers induced heavy pre-cipitation and flooding in the western U.S. simulated by the
WRF regional climate model, Geophys. Res. Lett., 36, L03820, https://doi.org/10.1029/2008GL036445, 2009.
Livneh, B., Bohn, T. J., Pierce, D. W., Munoz-Arriola, F., Nijssen, B., Vose, R., Cayan, D. R., and Brekke, L.: A spatially compre-hensive, hydrometeorological data set for Mexico, the US, and Southern Canada 1950–2013, Scientific data, 2, 2015.
Mahoney, K., Jackson, D. L., Neiman, P., Hughes, M., Darby, L., Wick, G., White, A., Sukovich, E., and Cifelli, R.: Understand-ing the role of atmospheric rivers in heavy precipitation in the southeast United States, Mon. Weather Rev., 144, 1617–1632, 2016.
Maraun, D., Wetterhall, F., Ireson, A. M., Chandler, R. E., Kendon, E. J., Widmann, M., Brienen, S., Rust, H. W., Sauter, T., The-meßl, M., Venema, V. K. C., Chun, K. P., Goodess, C. M., Jones, R. G., Onof, C., Vrac, M., and Thiele-Eich, I.: Precipita-tion downscaling under climate change: Recent developments to bridge the gap between dynamical models and the end user, Rev. Geophys., 48, RG3003, https://doi.org/10.1029/2009RG000314, 2010.
Michalakes, J., Dudhia, J., Gill, D., Henderson, T., Klemp, J., Ska-marock, W., and Wang, W.: The weather research and forecast model: software architecture and performance, in: Proceedings of the Eleventh ECMWF Workshop on the Use of High Perfor-mance Computing in Meteorology, 156–168, World Scientific: Singapore, 2005.
Miguez-Macho, G., Stenchikov, G. L., and Robock, A.: Spectral nudging to eliminate the effects of domain position and geometry in regional climate model simulations, J. Geophys. Res.-Atmos., 109, D13104, https://doi.org/10.1029/2003JD004495, 2004. Miguez-Macho, G., Stenchikov, G. L., and Robock, A.: Regional
climate simulations over North America: Interaction of local pro-cesses with improved large-scale flow, J. Climate, 18, 1227– 1246, 2005.
Miguez-Macho, G., Rios-Entenza, A., and Dominguez, F.: Regional climate simulations with moisture tracers to investigate land-atmosphere interactions in the terrestrial water cycle over the Iberian Peninsula, Geophys. Res. Abstr., EGU2013-12677, EGU General Assembly 2013, Vienna, Austria, 2013.
Mlawer, E. J., Taubman, S. J., Brown, P. D., Iacono, M. J., and Clough, S. A.: Radiative transfer for inhomogeneous atmo-spheres: RRTM, a validated correlated-k model for the longwave, J. Geophys. Res.-Atmos., 102, 16663–16682, 1997.
Mundhenk, B. D., Barnes, E. A., Maloney, E. D., and Nardi, K. M.: Modulation of atmospheric rivers near Alaska and the US West Coast by northeast Pacific height anomalies, J. Geophys. Res.-Atmos., 121, 12751–12765, https://doi.org/10.1002/2016JD025350, 2016.
Nayak, M. A., Villarini, G., and Lavers, D. A.: On the skill of nu-merical weather prediction models to forecast atmospheric rivers over the central United States, Geophys. Res. Lett., 41, 4354– 4362, 2014.
Neiman, P. J., Ralph, F. M., Wick, G. A., Kuo, Y.-H., Wee, T.-K., Ma, Z., Taylor, G. H., and Dettinger, M. D.: Diagnosis of an In-tense Atmospheric River Impacting the Pacific Northwest: Storm Summary and Offshore Vertical Structure Observed with COS-MIC Satellite Retrievals, Mon. Weather Rev., 136, 4398–4420, 2008a.
Over-JET Aircraft Observations of Atmospheric Rivers over the East-ern North Pacific Ocean during the Winter of 1997/98, Mon. Weather Rev., 132, 1721–1745, https://doi.org/10.1175/1520-0493(2004)132<1721:SACAOO>2.0.CO;2, 2004.
Ralph, F. M., Neiman, P. J., and Rotunno, R.: Dropsonde Obser-vations in Low-Level Jets over the Northeastern Pacific Ocean from CALJET-1998 and PACJET-2001: Mean Vertical-Profile and Atmospheric-River Characteristics, Mon. Weather Rev., 133, 889–910, https://doi.org/10.1175/MWR2896.1, 2005.
Ralph, F. M., Neiman, P. J., Wick, G. A., Gutman, S. I., Dettinger, M. D., Cayan, D. R., and White, A. B.: Flooding on California’s Russian River: Role of atmospheric rivers, Geophys. Res. Lett., 33, L13801, https://doi.org/10.1029/2006GL026689, 2006. Ralph, F. M., Coleman, T., Neiman, P. J., Zamora, R. J., and
Det-tinger, M. D.: Observed Impacts of Duration and Seasonality of Atmospheric-River Landfalls on Soil Moisture and Runoff in Coastal Northern California, J. Hydrometeorol., 14, 443–459, https://doi.org/10.1175/JHM-D-12-076.1, 2013.
Ramos, A. M., Trigo, R. M., Liberato, M. L. R., and Tomé, R.: Daily precipitation extreme events in the Iberian Peninsula and its association with Atmospheric Rivers, J. Hydrometeorol., 16, 579–597, https://doi.org/10.1175/JHM-D-14-0103.1, 2015. Ramos, A. M., Nieto, R., Tomé, R., Gimeno, L., Trigo, R. M.,
Lib-erato, M. L. R., and Lavers, D. A.: Atmospheric rivers moisture sources from a Lagrangian perspective, Earth Syst. Dynam., 7, 371–384, https://doi.org/10.5194/esd-7-371-2016, 2016. Rienecker, M. M., Suarez, M. J., Gelaro, R., Todling, R.,
Bacmeis-ter, J., Liu, E., Bosilovich, M. G., Schubert, S. D., Takacs, L., Kim, G., Bloom, S., Chen, J., Collins, D., Conaty, A., da Silva, A., Gu, W., Joiner, J., Koster, R. D., Lucchesi, R., Molod, A., Owens, T., Pawson, S., Pegion, P., Redder, C. R., Reichle, R., Robertson, F. R., Ruddick, A. G., Sienkiewicz, M., and Woollen, J.: MERRA: NASA’s modern-era retrospective anal-ysis for research and applications, J. Climate, 24, 3624–3648, https://doi.org/10.1175/JCLI-D-11-00015.1, 2011.
Shutts, G. J.: Dynamical aspects of the October storm, 1987: A study of a successful fine-mesh simulation, Q. J. Roy. Me-teor. Soc, 116, 1315–1347, 1990.
Skamarock, W. C., Klemp, J. B., Dudhia, J., Gill, D. O., Barker, D. M., Wang, W., and Powers, J. G.: A description of the ad-vanced research WRF version 2, Tech. rep., DTIC Document, 2005.
Sodemann, H. and Stohl, A.: Moisture Origin and Meridional Transport in Atmospheric Rivers and Their Association with Multiple Cyclones*, Mon. Weather Rev., 141, 2850–2868, https://doi.org/10.1175/MWR-D-12-00256.1, 2013.
Warner, M. D., Mass, C. F., and Salathé, E. P.: Wintertime Extreme Precipitation Events along the Pacific Northwest Coast: Clima-tology and Synoptic Evolution, Mon. Weather Rev., 140, 2021– 2043, https://doi.org/10.1175/MWR-D-11-00197.1, 2012. Warner, M. D., Mass, C. F., and Salathé, E. P.: Changes in
Win-ter Atmospheric Rivers along the North American West Coast in CMIP5 Climate Models, J. Hydrometeorol., 16, 118–128, https://doi.org/10.1175/JHM-D-14-0080.1, 2014.