AKNOBAS: A Knowledge-based Segmentation
Recommender System based on Intelligent Data
Mining Techniques
Alejandro Rodríguez-González1, Javier Torres-Niño1
, Enrique Jimenez-Domingo1, Juan Miguel Gomez-Berbis1 and
Giner Alor-Hernandez2
1 Computer Science Department, University Carlos III of Madrid,
28911, Leganes, Madrid, Spain
{alejandro.rodriguez, javier.torres, enrique.jimenez, juanmiguel.gomez}@uc3m.es
2 Division of Research and Postgraduate Studies, Instituto Tecnológico de
Orizaba, 94320, Orizaba, Veracruz, México [email protected]
Abstract. Recommender Systems have recently undergone an unwavering improvement in terms of efficiency and pervasiveness. They have become a source of competitive advantage in many companies which thrive on them as the technological core of their business model. In recent years, we have made substantial progress in those Recommender Systems outperforming the accuracy and added-value of their predecessors, by using cutting-edge techniques such as Data Mining and Segmentation.In this paper, we present AKNOBAS, a Knowledge-based Segmentation Recommender System, which follows that trend using Intelligent Clustering Techniques for Information Systems. The contribution of this Recommender System has been validated through a business scenario implementation proof-of-concept and provides a clear breakthrough of marshaling information through AI techniques.
Keywords: Data Mining, Clustering, Information Systems, Artificial Intelligence, Use Case
1.
Introduction
registered users worldwide. BeRuby.com has already paid more than $1,000,000 to its users for their Internet activity. BeRuby.com databases store a huge amount of raw information about these 800K+ users: their navigation habits (sites they visit, or where they register or purchase), user preferences, and profile information. However, the information about users is not capitalized for helping to BeRuby administrators to find groups of users which share things in common. For hence, all the information about the behavior of the users which users the BeRuby platform can be analyzed with the system represented in this paper to find patterns which allows to find groups of users with some interests in common. With these groups we are able to cover the necessity of creating personalized advertisements given the users interests and its relation with other users. Under this scenario, the search of patterns which allows finding groups of users with some interests in common can be considered as a clustering issue. Clustering is one of the most important unsupervised learning problems. A common definition of clustering can be “the process of organizing objects into groups whose members are similar in some way”. Another way to say it is ensuring that a cluster is a group of objects which are “similar” between them and are “dissimilar” to the objects that belong to other clusters [1].
The goal of this work is to show the design and implementation of a platform which aims to help BeRuby administrators find groups of users which share things in common. This paper is mainly focused on the design and implementation of clustering techniques to obtain these groups of users, and the analysis of the results obtained by the clustering method used. We have selected a clustering algorithm because satisfies some properties to ensure its performance: scalability, discovering clusters with an arbitrary shape, capacity to deal with noise and uncertainty, high dimensionality, dealing with different kinds of attributes and some requirements for domain knowledge for the determination of input parameters [2]. The algorithm presented here, which is detailed in following sections, fulfills these features and provides interesting results for recommendation systems.
Intelligent Data Mining Techniques
2.
Related Works
Nowadays, clustering is a well-known technique that it is applied to different fields: marketing [3], graphics [4], insurance [5], health [6], biology [7], and classification [8], to mention a few. In the literature, some efforts have applied the clustering algorithm for developing recommendation systems. For instance, in [9], a hotel recommendation system based on clustering and Rankboost algorithm was proposed. This proposal tries to avoid the cold-start and scalability. An improved grid portal recommendation architecture is presented in [10]. The proposed architecture in combination with a clustering algorithm allows solving problems such as over-scale of the grid portal resources management, heavy-load of handing with large-scale querying and processing, low-satisfaction of the users who need access to get the desired the resources. In addition, the paper implements the architecture efficiently through a prototype portal in which both, action layer and render layer, are designed for collaborative filtering. An exploration of how to utilize tagging information to do personalized recommendations is presented in [11]. Based on the distinctive three dimensional relationships among users, tags and items, a new user profiling and similarity measure method is proposed. The experiments suggest that the proposed approach is better than the traditional collaborative filtering recommendation systems using only rating data. In [12], an approach that combines the advantages of memory-based and model-based collaborative filtering by joining the two methods is presented. Firstly, it employs memory-based collaborative filtering to fill the vacant ratings of the user-item matrix. Then, it uses the item-based collaborative filtering as model-based to form the nearest neighbors of every item. At last, it produces prediction of the target user to the target item at real time. In [13], a recommendation algorithm based on the item classification to pre-produce the ratings is proposed. This approach classifies the items to predict the ratings of the vacant values where necessary, and then uses the item-based collaborative filtering to produce the recommendations. An extension of the collaborative filtering approach to design a more effective recommendation system that overcomes those limitations is proposed in [14].
e-commerce [19] or focuses on the recommendation of web pages based on the interests of the user [20]. In other terms, it is easy to find systems where the main goal is to determine the most suitable advertisement for a concrete user. This is the case of [21], which uses decision-tree induction techniques for offering products in storefronts after a process of marketing rule-extraction, or [22], whose aim is to advise the user in shopping areas based on his profiles and interests by using a neural based planner which identifies the most adequate plan for a given user.
The scope of these kinds of systems has represented important achievements, that even lead to the publication of patents as in [23], where a method for delivering customized electronic advertisements in an interactive communication system is explained, or in [24], a similar system whose aim is also to provide customized advertisings using a repository connected to the World Wide Web and a set of preferences taken from the user. Without a doubt these applications are more and more common every day due to the necessity of adaptation to market pressures and the evolution of society to more customized products in all ambits.
These initiatives suffer from several drawbacks such as: a) require prior knowledge on how to behave under each situation, b) lack of discovering clusters with an arbitrary shape c) lack of different kind of attributes and some requirements for domain knowledge for the determination of input parameters. Our proposal tries improving these aforementioned deficiencies.
3.
AKNOBAS
AKNOBAS (Automated Knowledge-Based Segmentation System for Recommendations), which is the system described in this paper, has been developed to build a recommendation system [25] with an advertising aim based on the information stored in the BeRuby database [26]. The objective of the system is to generate several profiles which allow the users of the company to create personalized advertisements for BeRuby’s users.
The information stored in the BeRuby database is composed of several data about the users’ preferences, visited websites and some other information associated with their profiles. The objective of the system, thus, is to try to process this raw information, and extract groups or users profiles, in such a way that once we have these profiles, we can determine some preferences of a concrete user given that the user belongs to a particular group.
In artificial intelligence there are several tools or techniques that can be used for the aim of the system developed. One technique is data mining [27], the process of extracting patterns from data. Given the nature of the project, the authors consider this process to be the key to achieving the project’s goals.
Intelligent Data Mining Techniques observations in the same cluster are similar in some sense, is probably the best approach that can be used.
The following subsections describe the architecture of the generated system and the internal working of their modules as well as the main problems that authors found during its development, and the design decisions made.
3.1. Solution approach
The solution to the use case or problem that we wish to achieve can be reached through the generation of a system which, using clustering as a data mining technique is able to generate groups of users with common commercial features. Commercial features are understood to be those that are representative in the group of data handled.
3.2. Architecture
The solution has a layered design in order to organize its components. This layered-design allows scalability and easy maintenance because its tasks and responsibilities are distributed.
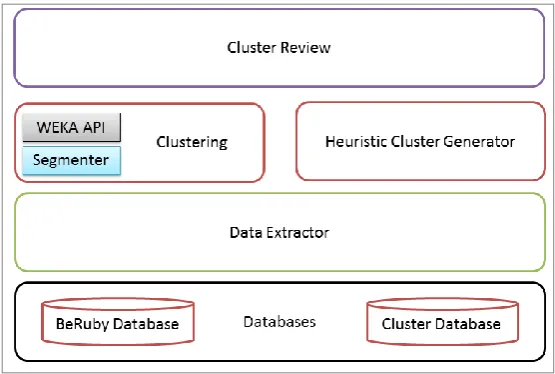
Fig. 1. AKNOBAS architecture
The general architecture is shown in Figure 1. Each component has a function explained as follows:
the AKNOBAS's architecture. It contains all the data of the users that are going to be used by AKNOBAS in order to generate the groups (clusters) of users. It also can store the information of the clusters once they have been generated and validated.
Data Extractor: This component obtains all the data which is stored in the BeRuby database through SQL queries with the objective that the following module can build a segmentation of the data what the Heuristic Cluster Generator module can access the data.
Heuristic Cluster Generator: This module generates clusters in a semi-automatic way. The clusters generated by this module are pre-established, and the objective of this module is to generate the groups that the system users (BeRuby employees) have identified through experience. The generation of these groups is based on the application of some heuristics, and thus, these groups always are the same, with the only difference being that the users contained within will change. In this case, the information generated by this module can be directly stored in the database because it is not necessary to supervise the content of the groups as we already know their structure.
Segmenter: This module makes segmentation of all the information that has been extracted by the module Data Extractor. The segments are generated or defined by the BeRuby workers based on their experience in the internal structure of the data that is stored in their databases. They can generate segments of information because they know the possible relation that exists between the tables as experts in the domain. An example of segment is the creation of a segment which contains private information of a user. This information can be his/her age, sex, or similar, with the objective of generating a segment that contains private information about the users. This process provokes the creation of clusters based on such private information.
Clustering (WEKA): The clustering module generates a cluster using the WEKA framework as clustering API. This module has direct access to the BeRuby database. The reason for this access is because WEKA API implements the possibility of access to a database directly in order to generate the data matrix (individuals) that is used in the clustering process. This module requires extra attention and it is explained with more detail in the following sections.
Cluster Review: The revision module is a item of the architecture, which is composed of two parts:
Intelligent Data Mining Techniques 2) The second part consists of automatic execution of the algorithm that the experts of the domain should design in order to allow the processing of the results given by the clustering algorithm for a certain segment. With the execution of this algorithm, the data is interpreted and it is easier to process the data from the recommender system.
Cluster DB: This module is a database designed to store the information about the clusters that have been generated and processed by the Cluster Review module. The idea is to use this database as a temporary knowledge warehouse.
3.3. Information about BeRuby data
BeRuby stores a lot of data in its databases, around 4GB in binary form for the entire UK version, and 25GB just in the click_account table of the spanish version. The data is distributed in dozens of tables including information for all the widgets (interactive elements), categories, users, clicks of users in the widgets, etc. Only some of this information is relevant to the analysis carried out in this paper.
The data is divided in segments that are a set of fields from one or multiple tables to be taken as a whole for clustering purposes. AKNOBAS automatically creates the required queries to select the data, including joining data from different tables.
The most important segment only has two fields from a single table; the user_id and the widget_id from the click_accounts table. In these fields each row represents a click of one user in a widget.
Some more data is required for the analysis of the output of the clustering system, as a widget id does not give enough information for a meaningful recommendation, the category of each widgets is also needed. This data is located in the categories table, which includes the features of the category, including its parent category in the case of subcategories. Only the name (for displaying purposes) and the parent or children categories are taken from this table.
To relate the widgets with the categories, the table widgets is used, using the fields widget_id and subcategory_id to match widgets from click_accounts with the corresponding category.
3.4. Algorithms: KMeans and XMeans
Once the main parameters of the clustering approach are established, it is necessary to choose the clustering algorithm. There are several options that can be used. However, given that we want to use existing implementations and, if possible, only use a concrete development API, we assume as a restriction the use of the algorithms that WEKA API implements by default.
The main algorithms that WEKA API allows to be used for clustering purposes are EM, KMeans and XMeans.
Given that there are still too many options, we decided to use only two options for implementation based on our own experience with clustering algorithms. The two options selected were KMeans and XMeans; the reason for this selection was based on the fact that KMeans algorithm is widely implemented and used and it has shown itself to be one of the best algorithms for clustering in most scenarios. On the other hand, XMeans is an improvement of KMeans algorithm where the algorithm has a better computational scalability, the number of clusters does not need to be supplied by the user and it offers a partial remedy for the problem of search in KMeans being prone to local minimal [29].
The configuration of the algorithms can be changed by the user of the system depending on the results that the algorithms are returning. KMeans algorithms need the user to provide the number of segments to generate. The actual criterion to determine this number is based on the distribution of the elements in the generated cluster for each segment. The algorithm used to obtain the “optimal” number of clusters to generate is the following:
1. For a concrete segment (which is chosen depending on the type of analysis to be done), KMeans algorithms are executed giving as a parameter the number of clusters to generate that will iterate between 2 (minimal) and a maximum that is established by the expert (normally, the number maximum of clusters is calculated taking into account the number of the attributes of the segment following the formula 1. This heuristic formula tries to increase the number of clusters as the dataset grows more complex. The heuristic tries to provide at least one cluster per attribute given that we found out that many elements of the datasets could be classified by extreme values in a single attributes, suggesting to use at least a cluster per attribute to be able to classify these. We have used this calculation instead of; for example, add one to the number of attributes to leave a threshold.
Intelligent Data Mining Techniques 5 clusters, also 10,000 elements, and the following distribution: c1 =2,000, c2 = 2,000, c3 = 2.500, c4 = 2,000, c5 = 1500. As can be seen, the second result has the most equally distributed elements and therefore, the number of clusters = 5 is a better candidate for the analyzed segment. This is shown in Code Listing 1. There are proven techniques for cluster evaluation such as those in [30,31], however we have selected to use this method for its simplicity, as perfect cluster selection is not strictly necessary.
foreach num_clusters in [2, num_attr * 3 / 2] {
mean_instances = instances.size() / num_clusters
clusters[num_clusters] = kmeans(instances, num_clusters) foreach cluster in clusters[num_clusters] {
diffs[num_clusters] += (cluster.size() - mean_instances)^2 }
}
return clusters[x] where diffs[x] = min(diffs)
Code Listing 1. Cluster selection
Maximum number of clusters formula:
Clusters=SegmentAttributes+ SegmentAttributes
2 (1)
It is necessary to clarify that this criterion can be changed in the future and some other criterions can be chosen.
In the case of XMeans, this algorithm can calculate the number of clusters to generate itself, but it needs to indicate the minimum and maximum thresholds to obtain this number. In this case, the algorithm described before can also be applied to get a concrete and optimal number of clusters. However, we decided to let the algorithm choose the best configuration for each segment in most of the cases. There are some cases that we see (after observing the results that the algorithm returns) that a minimum of clusters needs to be generated in some segments. For this reason, we have the possibility of indicating the system that in a certain segment the thresholds should change to the ones provided instead of using the general configuration of XMeans algorithm.
4.
Analysis of the results provided by clustering
algorithms
should be different in each segment because the information stored on each one of them is different and normally this information has no relation with other data stored in the rest of the segments. For this reason, an exhaustive and different analysis of each segment of the system should be applied. The analysis is generally based on some simple statistical factors because the information contained in the segments can be represented as percentages. For example, given a user, we can obtain, from all the possible categories of the system which one is the preferred by this user in percentage form (analyzing the total of categories clicked by the users and obtaining the most popular). If, for example, the category found is “sports”, we can assume that the user is interested in sports, and we can offer him, for example, tickets or discounts to sports events. However, this is only one example of the possible analysis that can be done in the different segments.
In the following lines we explain, as a use case, the analysis of one of the most important segments in the BeRuby database.
The segment click_accounts, which is represented by the table “click_accounts” and the column of the table “widget_id” contains very valuable information about the interaction of BeRuby users against the system. In this table all the clicks that the user made on all the widgets of the system are stored. Some analyses made by BeRuby experts before the development of this system detect some “patterns” in the content of the database. For example, BeRuby experts detect a user profile whose behavior consists of clicking on all the available widgets one time, in order to get money for clicking, without exceeding the click limit of the widgets.
The following analysis that is shown in the paper is not unique. Other approaches can be used to analyze the data in order to get other types of information or relations. The procedure designed and implemented for the analysis of this segment is the following:
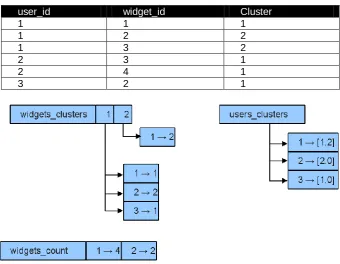
First of all, we get the output of the clustering algorithm (represented in table 1) and this output is stored in a data structure that, as a result, it generates an easier way to manage the data in the analysis process of the segment. Given that now we are interested in the number of appearances of each user and each widget in all of the generated clusters, we need to create the following elements:
For each cluster a map is generated which relates the widget_id to the number of appearances of the aforementioned widget in the cluster. This structure is repeated for each cluster that has been generated by the clustering algorithm and it is stored on a list (widgets_clusters). A list with the number of widgets that each cluster contains:
widgets_count
Intelligent Data Mining Techniques
Figure 2 shows the data structures used in the analysis process.
Table 1. Output of the clustering algorithm
user_id widget_id Cluster
1 1 1
1 2 2
1 3 2
2 3 1
2 4 1
3 2 1
Fig. 2. Data structures used in the analysis process (I)
Hereafter, we proceed to the loading of the categories of the database. Table 2 shows the association between widgets and categories.
Table 2. Association between widgets and categories widget_id category_id
1 1
2 2
3 1
4 2
The categories are stored in two maps with the following associations: widget_id → category_id (widget_category)
category_id → category_name (category_name)
With this data, we have calculated the distribution by categories of each cluster. For doing this, we have inspected all the elements of the list of widgets of each cluster, calculating the percentage that each widget represents of the total (dividing the value of widgets_clusters between the values of the corresponding widgets_count). Once done this, we have added this percentage to the corresponding category-cluster set, which is stored in a map list similar to widgets_clusters: categories_clusters.
The result in our example is shown in Figure 3.
Fig. 3. New data structures generated after applying analysis
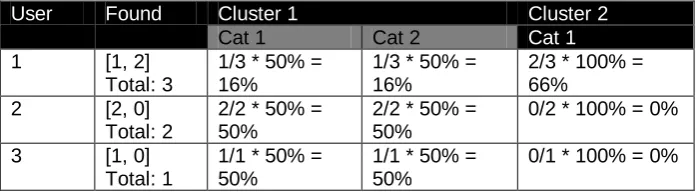
Finally, we have calculated the percentage of appearances of a user on a cluster, in other words, the total number of times that an instance with a certain user_id has been classified in each cluster, divided by the total of instances in which this user appears. The result of multiplying this value by the percentage of each category in a cluster is a representation of the preference of the user to subjects related to the mentioned category, therefore, the value is high, and it is showed. In our example Table 3 shows the results.
Table 3. Results after applying the analysis
User Found Cluster 1 Cluster 2
Cat 1 Cat 2 Cat 1
1 [1, 2] Total: 3
1/3 * 50% = 16%
1/3 * 50% = 16%
2/3 * 100% = 66%
2 [2, 0] Total: 2
2/2 * 50% = 50%
2/2 * 50% = 50%
0/2 * 100% = 0%
3 [1, 0] Total: 1
1/1 * 50% = 50%
1/1 * 50% = 50%
0/1 * 100% = 0%
Intelligent Data Mining Techniques one click (100% in the same cluster) could be possibly classified as fanatic of a category.
The whole process is summarized in Code Listing 2.
foreach inst in clustered_instances {
widget_clusters[inst.cluster][inst.widget]++ widgets_count[inst.cluster]++
users_clusters[inst.user][inst.cluster]++ }
widget_category = sql(“SELECT widget, category FROM categories”) foreach cluster in clusters {
foreach (widget, count) in widgets_clusters[cluster] { widget_ratio = count / widgets_count[cluster] widget_clusters[cluster][widget] = widget_ratio cat = widget_category[widget]
categories_clusters[cluster][cat] += widget_ratio }
}
foreach user in users_clusters.keys { user_categories = {}
foreach (cluster, count) in users_clusters[user] { user_ratio = count / sum(users_clusters[user]) foreach (cat, catperc) in categories_clusters[cluster] {
user_categories[cat] += catperc * user_ratio }
}
foreach (cat, ratio) in user_categories { if ratio > threshold {
user_favorites[user] = (cat, ratio) }
} }
Code Listing 2. Analysis algorithm
5.
Recommender System
creation of groups of users (users profiles) which share some kind of features to be able to, for example, recommend to one user some of the preferences of another user that are in the same profile. However, this is only one of the possible points of view that can be used in the design and development of this system. Another kind of recommendation can be made based on the preferences or interests of a certain user, in order to recommend items to this user. For example, if we know that a user is interested in sports, we can recommend sports products to that user.
The exact recommendation that is made to each user depends on the segment analyzed. If, for example, we analyze the click_accounts segment, we can make recommendations to each user based on their interests, but we also can make recommendations to users based on the interests of other users (not his own). For this reason the analysis process plays a very important role in this system. It is important to carry out an exhaustive analysis of the data returned by the clustering algorithms to be able to, after analyzing the output, make recommendations.
In the previous sections the use case of the click_accounts segment has been studied. In the actual section, a recommendation case based on this segment is presented. However, it is important to note that the following case is only one of the several recommendation cases that could be made with this segment.
The following lines show one of the recommendations that can be made through the clustering and analysis of the click_accounts segment. Note that the following example is a real example that comes from the United Kingdom database of the BeRuby system.
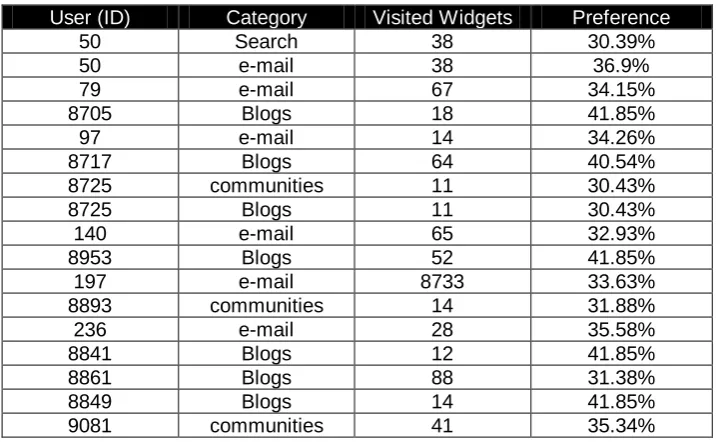
Table 4. Results of analysis process
User (ID) Category Visited Widgets Preference
50 Search 38 30.39%
50 e-mail 38 36.9%
79 e-mail 67 34.15%
8705 Blogs 18 41.85%
97 e-mail 14 34.26%
8717 Blogs 64 40.54%
8725 communities 11 30.43%
8725 Blogs 11 30.43%
140 e-mail 65 32.93%
8953 Blogs 52 41.85%
197 e-mail 8733 33.63%
8893 communities 14 31.88%
236 e-mail 28 35.58%
8841 Blogs 12 41.85%
8861 Blogs 88 31.38%
8849 Blogs 14 41.85%
Intelligent Data Mining Techniques After executing the clustering and analysis process, we obtain the categories recommended for each user as is shown in Table 4.
Making use of all the knowledge collected, which is: Grouping of widgets and users (clustering) Each user’s preferred categories (analysis) Widgets visited by each user (database)
Popularity (number of clicks) of the widgets (database)
We can provide a recommendation of their possible widgets that can interest the user. For doing this, there are multiple ways of combining the data.
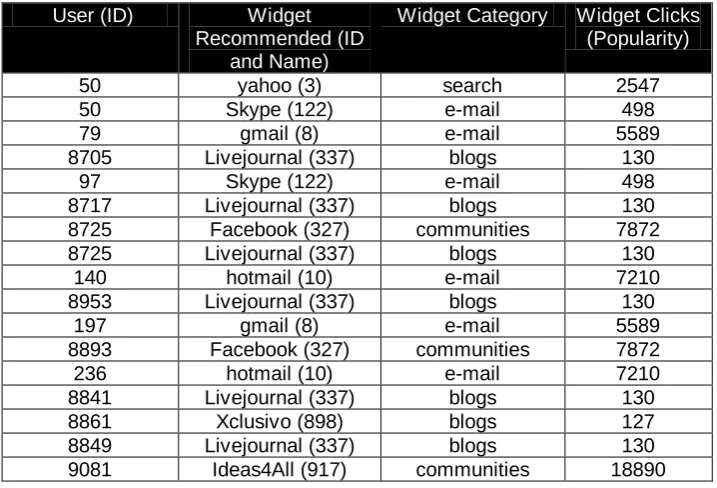
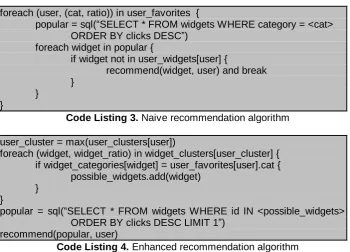
One of the easiest ways is to select the most popular widget of the category that the user prefers but which the user has never visited, as shown in Code Listing 3. So, we can obtain the recommendations as shown in Table 5.
Table 5. Results of recommendation system User (ID) Widget
Recommended (ID and Name)
Widget Category Widget Clicks (Popularity)
50 yahoo (3) search 2547
50 Skype (122) e-mail 498
79 gmail (8) e-mail 5589
8705 Livejournal (337) blogs 130
97 Skype (122) e-mail 498
8717 Livejournal (337) blogs 130
8725 Facebook (327) communities 7872
8725 Livejournal (337) blogs 130
140 hotmail (10) e-mail 7210
8953 Livejournal (337) blogs 130
197 gmail (8) e-mail 5589
8893 Facebook (327) communities 7872
236 hotmail (10) e-mail 7210
8841 Livejournal (337) blogs 130
8861 Xclusivo (898) blogs 127
8849 Livejournal (337) blogs 130
9081 Ideas4All (917) communities 18890
However, in Table 5 we can notice that the results are very similar for the categories, and that there is a tendency to recommend the same widget to all the users that have the same favorite categories.
For each user, we find the cluster in which most of their instances were classified. In this cluster, we select all the widgets that have a representative presence (in this example, the widget should represent at least 2% of the clicks on the cluster). Finally, the widgets that do not pertain to the user’s majority category or that he has already visited is filtered and the most popular of each category is presented. This algorithm is shown in Code Listing 4.
In our example we obtain the results provided in Table 6.
Table 6. Result of recommendation system after cross results with the clusters User (ID) Widget
Recommended (ID and Name)
Widget Category
Widget Clicks (Popularity)
50 yahoo (3) search 2547
79 gmail (8) e-mail 5589
8725 Bebo (969) communities 3054
140 hotmail (10) e-mail 7210
197 gmail (8) e-mail 5589
8893 Twitter (968) communities 2691
236 hotmail (10) e-mail 7210
We can appreciate a slightly lower, but also more varied, number of recommendations for the same set of users which can be interpreted as a sign that they are more pertinent than the previous system.
foreach (user, (cat, ratio)) in user_favorites {
popular = sql(“SELECT * FROM widgets WHERE category = <cat> ORDER BY clicks DESC”)
foreach widget in popular {
if widget not in user_widgets[user] {
recommend(widget, user) and break }
} }
Code Listing 3. Naive recommendation algorithm
user_cluster = max(user_clusters[user])
foreach (widget, widget_ratio) in widget_clusters[user_cluster] { if widget_categories[widget] = user_favorites[user].cat {
possible_widgets.add(widget) }
}
popular = sql(“SELECT * FROM widgets WHERE id IN <possible_widgets> ORDER BY clicks DESC LIMIT 1”)
recommend(popular, user)
Intelligent Data Mining Techniques Both systems modify their recommendations, given that when a user clicks on one of the recommended widgets, this is deleted from the recommender’s list of options, providing more variety.
6.
Evaluation
The evaluation of a recommender system can be divided in several types [32], emphasizing concretely two types of evaluations: 1) measuring the accuracy of the recommender system (how good is recommending) and 2) measuring the efficiency (is the system capable of making recommendations in an acceptable time? Is the system using too many resources?). Nowadays, the measurement of the time and resources only need to be done in some cases like when the amount of data used is too vast, or where the architecture doesn’t have enough scalability.
In this paper, given that we have presented a use-case about application of data mining techniques to make recommendations, the evaluation was focused in know how good the system is performing these recommendations.
In order to compare the results of the accuracy of the recommender system it is necessary to have something to compare with. Nowadays, these kind of comparison are really hard to perform because it is necessary that both recommender systems are applied in the same domain, and using the same data.
Evaluation process:
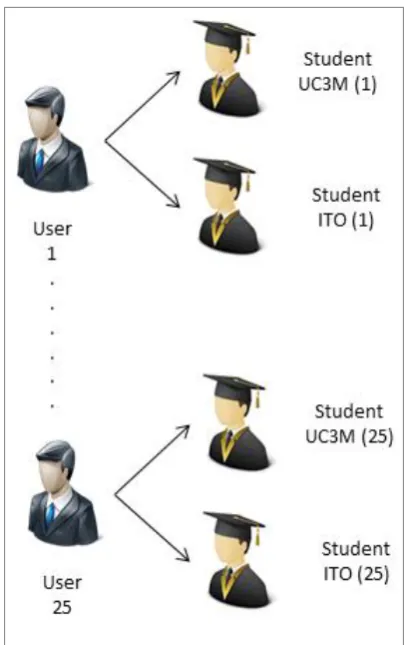
The evaluation of AKNOBAS has been done using students from Computer Science studies of two different universities (Universidad Carlos III de Madrid, Spain and Instituto Tecnológico de Orizaba, Mexico). Given that the evaluated system have been developed to be used on real company, it is difficult to have access to the real users of the system. For this reason, we have selected twenty-five students from each university, which will represent the 25 real users of BeRuby platform.
The idea consists in associating a real user to one student of each university. This has been represented in figure 4. With this schema, we have two sets of potential “users”, with twenty-five users each set.
Fig. 4. Association between BeRuby users and students
Once the student has received this information, each student receives a personalized form which contains information about two kinds of recommendations:
AKNOBAS Recommendation: The student receives three personalized recommendations (related with the category communities) that AKNOBAS system has generated for each user.
Random Recommendation: We have developed an algorithm which chooses three random elements chosen from the most popular widgets in the “communities” category (excluding the elements which we know that have already been visited).
Intelligent Data Mining Techniques Degree: The user should value how good was the recommendation with a value between one and five: 1 – very bad, 2 – bad, 3 – neutral, 4 – good, 5 – very good.
Correct: The student should indicate if consider that each recommendation of the three proposed, are correct (value 1), or not (value 0) given the knowledge that he have about the user preferences (clicks). If the user (student) considers that the degree of the recommendation is three or lower, the user should mark the recommendation as incorrect (0).
With this information, our goal is to determine how good was the system (in a percentage), and how good the users (students) consider the recommendations done by the system.
Note: The results of the evaluation are publicly available in [33]. However, the questioners send to the students and their concrete responses as well as the data obtained from BeRuby database cannot be published due to the agreement between the BeRuby company and the authors.
Evaluation results:
From the evaluation performed, we obtained two sets of results (one for each institution where the evaluation was done). First, we show and analyze the results of each institution to conclude analyzing the results of both. The file which contains the results of this evaluation could be accessed in [33]. The results provided in this document are focused in the final results, not including information about, for example, measuring each recommendation (R1 to R3).
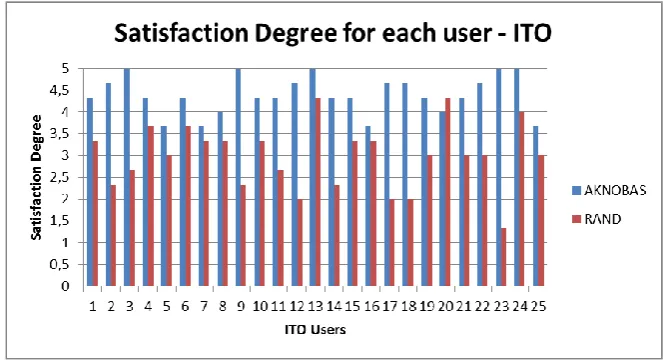
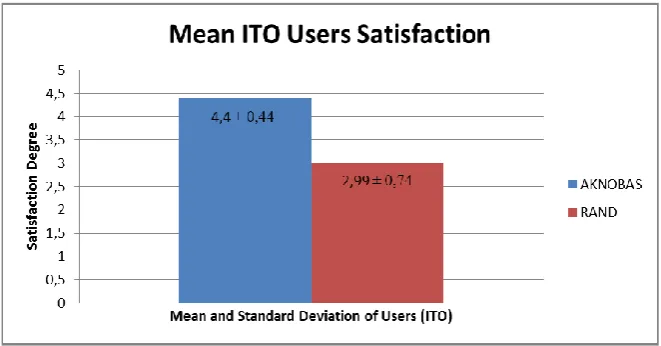
Fig. 6. Mean Satisfaction between ITO users ITO Results:
As can be seen in file [33], in the section where the results of ITO are shown, we can notice that the satisfaction degree of the results obtained from AKNOBAS is higher than the once obtained with the random recommendation. Figure 5 shows this result. Also, in figure 6 we can notice the mean satisfaction, and the standard deviation referred to the satisfaction of the ITO students.
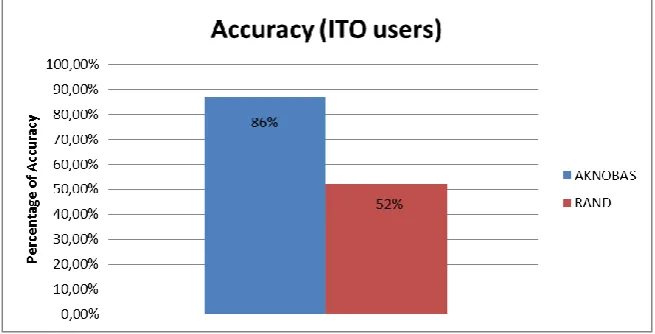
The accuracy of recommendations made by AKNOBAS or the rand algorithm also was measured. This measurement has been done using basic metrics, calculating the percentage of recommendations which were considered correct with the formula 2:
(2)
Intelligent Data Mining Techniques
Fig. 7. Mean accuracy (ITO users)
Given that the accuracy of AKNOBAS (with ITO users) is quite higher (34% higher), and from a statistic point of view we can ensure that there are significant differences between both systems, we can demonstrate the utility of AKNOBAS platform in the recommendation process, with the data obtained from students from ITO.
Fig. 9. Mean Satisfaction between UC3M users UC3M Results:
Again, as can be seen in file [33], in the section where the results of UC3M are shown, we can see that again the satisfaction degree of the results obtained from AKNOBAS is higher than the once obtained with the random recommendation. Figure 8 shows this result for UC3M students. Also, in figure 9 we can notice the mean satisfaction, and the standard deviation referred to the satisfaction of the students from UC3M.
Fig. 10. Mean accuracy (UC3M users)
Intelligent Data Mining Techniques Finally, again, we applied T-Student to know if there are significant differences between AKNOBAS and the rand algorithm, The appliance of T-Student with a significance of 0.05 (5%) returns (t(148) = -4,869; p<0.05), which means that there are significant differences between AKNOBAS and the rand recommendation.
Given that the accuracy of AKNOBAS (with UC3M) is, again, quite higher (34% higher), and from a statistic point of view we can ensure that there are significant differences between both systems, we can demonstrate the utility of AKNOBAS platform in the recommendation process, with the data obtained from UC3M students.
UC3M and ITO:
To summarize the results provided by the independent analysis of the two groups of students, we show some figures which represent the final results from the analysis performed.
In this case, we applied again an analysis of the data using a T-Student. We try to know if there are (or not) significant differences between UC3M and ITO users using AKNOBAS, and random algorithm.
In the first one, we analyzed the data to know if there are significant differences between UC3M users and ITO users using AKNOBAS. Results return (t(148) =,234 ; p<0.05), which means that there are not significant differences between UC3M and ITO opinions about the recommendations of AKNOBAS.
In the case of random algorithm, we obtained (t(148) =,162 ; p<0.05), which, again, means that there are not significant differences between UC3M and ITO opinions about the recommendations of random algorithm.
Fig. 12. Mean accuracy
In this case, it is not necessary to perform the T-Student analysis between the join of UC3M and ITO data to know if there are significant differences between AKNOBAS and random algorithm because as we observed in the previous study, in both groups of users we can notice significant differences. For this reason, in the summary of both groups, we found again these significant differences.
Figure 11 shows the mean accuracy of the system, using as input data the results obtained previously with ITO and UC3M users. Figure 12 shows the mean satisfaction degree of the users, using again the results previously obtained with ITO and UC3M users.
Evaluation conclusions:
As we can see in the evaluation conducted, the AKNOBAS system provides quite good results in the recommendation process. The random algorithm, used to allows us to have results to compare AKNOBAS with, has been designed, as was mentioned before, to obtain recommendations from a concrete set of possibilities (the random algorithm only could get recommendation items from a certain list which their elements pertains to the category used in the evaluation: communities). Given this feature of the random algorithm it is possible to notice that this algorithm have a high probability to return correct results given that the recommendation items are obtained from the same category. Even with that, AKNOBAS is more accurate. The reason is because as was explained in the previous sections, the paper tries to obtain these hide relations which in fact exist between different users, and with these relations, it is capable to recommend new items which are preferred by the users.
Intelligent Data Mining Techniques results provided by AKNOBAS and random algorithm have significant differences.
Also, it is important the measurement about the degree of satisfaction which was done. This degree also allows us to know how good the user considers the recommendation. This is a quite important thing, because this knowledge about “how good” a user finds a certain recommendation, can be reused by the AKNOBAS system in order to perform better recommendations in the future.
7.
Conclusions and Future Work
Using data mining algorithms to provide added value to current information systems has been depicted as a potential next generation for advanced information processing based on AI techniques. However, meeting real-world business scenario requirements has been lately leveraged by a new generation of web-based user information, mostly related with user preferences, profiles and, eventually, behavioral analysis. Fundamentally, most Customer Relationship Management (CRM) systems, a particular type of information systems, have already leveraged a number of operational and functional features of most business information systems which can provide an analytical framework to respond and cope with some customer demands or expectations.
However, these systems have not met the challenge in understanding and partially anticipating the users’ behavioral patterns. In this paper, we have presented an initiative in terms of using intelligent data mining techniques to a real scenario based on well-known AI algorithms which can provide not only an analytical framework but also a powerful software platform for managing critical mass user demands and desires and turning them into corporate knowledge and substantial desires, changes and expectations awareness.
Our future work in AKNOBAS involves a threefold approach. On the one hand, we will continue evaluating performance thanks to the real-world business oriented requirements from BeRuby, as a leading Web-based user-driven business application and model. On the other hand, we will survey a set of new generation algorithms based on behavioral mechanisms, themselves based on meta-heuristics. Finally, we intend to extend our approach to other different business requirements which could require a higher level of real time reaction, such as those including Web 2.0, Social Networks or Real-Time Web applications (such as Twitter) where the main tenets of our approach could be harnessed.
work was supported by the General Council of Superior Technological Education of Mexico (DGEST). Additionally, this work was sponsored by the National Council of Science and Technology (CONACYT) and the Public Education Secretary (SEP) through PROMEP.
References
1. Hartigan, J.A.: Clustering Algorithms. John Wiley & Sons, Inc., 1975
2. Gan, G., Ma, C., Wu, J.: Data Clustering: Theory, Algorithms, and Applications. ASASIAM Series on Statistics and Applied Probability. Vol. 20. (2007)
3. Yuan, S., Cheng, C.: Ontology-based personalized couple clustering for heterogeneous product recommendation in mobile marketing. Expert systems with applications. Vol. 26, No. 4, 461–476. (2004)
4. Han, Y., Shi, P.: An improved ant colony algorithm for fuzzy clustering in image segmentation. Neurocomputing. Vol. 70 No.4-6, 665-671. (2007)
5. Yeo, A.C., Smith, K.A., Willis, R.J., Brooks, M.: Clustering technique for risk classification and prediction of claim costs in the automobile insurance industry. Intelligent Systems in Accounting, Finance & Management. Vol. 10, No. 1, 39– 50. (2001)
6. Pronk, N.P., Anderson, L.H., Crain, A.L., Martinson, B.C., O'Connor, P.J., Sherwood, N.E., Whitebird, R.R.: Meeting recommendations for multiple healthy lifestyle factors: Prevalence, clustering, and predictors among adolescent, adult, and senior health plan members. American Journal of Preventive Medicine. Vol. 27, No. 2, 25-33. (2004)
7. Kedes, L.H., Birnstiel, M.L.: Reiteration and Clustering of DNA Sequences Complementary to Histone Messenger RNA. Nature new biology. Vol. 230, 165-169. (1971)
8. Xing, H.J., Hu, B.G.: An adaptive fuzzy c-means clustering-based mixtures of experts model for unlabeled data classification. Neurocomputing. Vol. 71, No. 4-6, 1008-1021. (2008)
9. G. Huming, and L. Weili,: A Hotel Recommendation System Based on Collaborative Filtering and Rankboost Algorithm. In Proceedings of the Second International Conference on Multi Media and Information Technology, IEEE Computer Society, Washington, DC, USA, 317-320 (2010).
10. F. Juan, L. Wencan.: An Architecture for Collaborative Filtering in Grid Portal Recommendation System. In Proceedings of the Fourth International Conference on Semantics, Knowledge and Grid, IEEE Computer Society, Washington, DC, USA, 359-363. (2008).
11. H. Liang, Y. Xu, Y. Li, R. Nayak.: Collaborative Filtering Recommender Systems Using Tag Information. In Proceedings of the International Conference on Web Intelligence and Intelligent Agent Technology, IEEE Computer Society, Washington, DC, USA, 59-62. (2008).
12. S. Gong, H. Ye, H. Tan.: Combining Memory-Based and Model-Based Collaborative Filtering in Recommender System. In Proceedings of the Conference on Circuits, Communications and System, IEEE Computer Society, Washington, DC, USA, 690-693. (2009).
Intelligent Data Mining Techniques Communications and System, IEEE Computer Society, Washington, DC, USA, 694-697. (2009).
14. A. Turati, D. Cerizza, I. Celino, E. Della V.: Analyzing User Actions within a Web 2.0 Portal to Improve a Collaborative Filtering Recommendation System. In Proceedings of the International Conference on Web Intelligence and Intelligent Agent Technology – Workshops, IEEE Computer Society, Washington, DC, USA, 65-68. (2009).
15. Eom, K.B.: Fuzzy clustering approach in unsupervised sea-ice classification. Neurocomputing. Vol. 25, No. 1-3, 149-166. (1999)
16. Ambroise, C., Sèze, G., Badran, F., Thiria, S.: Hierarchical clustering of self-organizing maps for cloud classification. Neurocomputing. Vol. 30, No. 1-4, 47-52. (2000)
17. Lawrence, R.D., Almasi, G.S., Kotlyar, V., Viveros, M.S., Duri, S.S.: Personalization of Supermarket Product Recommendations. Data mining and knowledge discovery. Vol. 5, No. 1-2, 11-32. (2001)
18. Shepitsen, A., Gemmell, J., Mobasher, B., Burke, R.: Personalized recommendation in social tagging systems using hierarchical clustering. ACM Conference On Recommender Systems, ACM, New York, NY, USA, 259-266. (2008)
19. Sarwar, B.M., Karypis, G., Konstan, J., Riedl, J.: Recommender Systems for Large-scale E-Commerce: Scalable Neighborhood Formation Using Clustering. In Proceedings of the Fifth International Conference on Computer and Information Technology. ACM, New York, NY, USA, 19-24. (2002)
20. Wu, Y.H., Chen, Y.C., Chen, A.L.P.: Enabling personalized recommendation on the Web based on user interests and behaviors. Research Issues in Data Engineering, Proceedings of Eleventh International Workshop on Research Issues in Data Engineering. Document Management for Data Intensive Business and Scientific Applications. IEEE Computer Society, Washington, DC, USA, 17-24. (2001)
21. Kim, J.W., Lee, B.H., Shaw, M.J., Chang, H.L., Nelson, M.: Application of Decision-Tree Induction Techniques to Personalized Advertisements on Internet Storefronts. International Journal of Electronic Commerce, Vol. 5, No. 5, 45–62. (2001)
22. Corchado, J., Bajom, J. De Paz, Rodríguez, S.: An execution time neural-CBR guidance assistant. Neurocomputing. Vol. 72, No. 13-15, 2743- 2753. (2009) 23. Angles, P., Blattner, D.: System and method for delivering customized
advertisements within interactive communication systems. United States patent application publication. (2006)
24. LeMole, S., Howard, S., Thomas, J., Stuntebeck, P.: Method and system for presenting customized advertising to a user on the World Wide Web. United States patent. (1999)
25. Resnick, P., Varian, H.R.: Recommender systems. Communications of the ACM. Vol. 40, No. 3, 56-58. (1997)
26. BeRuby. http://www.beruby.com. Last accessed: July, 21. 2011.
27. Han, J., Kamber, M.: Data Mining. Concept and Techniques. Morgan Kaufman. 2nd Edition. (2006)
28. Kaufman, L., Rousseeuw, P.J.: Finding Groups in Data: An Introduction to Cluster Analysis. Willey. 9th Edition. (2005)
Conference on Machine Learning. Morgan Kaufmann Publishers Inc., San Francisco, CA, USA, 727-734. (2000)
30. Halkidi, M., Batistakis, Y., Vazirgiannis, M.: Cluster validity methods: part I. SIGMOD Rec. 31, 2, 40-45. (2002)
31. Halkidi, M., Batistakis, Y., Vazirgiannis, M.: Clustering validity checking methods: part II. SIGMOD Rec. 31, 3, 19-27. (2002)
32. Stephan Weibelzahl. Framework for the evaluation of adaptive cbr systems. In Proceedings of the 9th German Workshop on Case-Based Reasoning, 254– 263, Baden-Baden, Germany (2001).
33. Evaluation results. Available online at: http://nadir.uc3m.es/alejandro/pubs /beruby/ evresults.pdf
Alejandro Rodríguez González, PhD, is a Researcher and Teaching Assistant of Computer Science Department at University Carlos III of Madrid. His main interests include Artificial Intelligence, Medical Informatics, Semantic Web, and Medical Diagnosis Systems.
Enrique Jiménez Domingo is a Researcher, Teaching Assistant and Ph.D. candidate of the Computer Science Department at Universidad Carlos III de Madrid. His main research lines involve Cloud Computing, Artificial Intelligence and Semantic Web.
Javier Torres Niño is a researcher in the Computer Science Department at University Carlos III. His current interests are applied Artificial Intelligence and large scale distributed systems.
Juan Miguel Gómez-Berbís is an Associate Professor at the Computer Science Department of the Universidad Carlos III de Madrid. He holds a Ph.D. in Computer Science from the Digital Enterprise Research Institute (DERI) at the National University of Ireland, Galway.
Giner Alor-Hernandez, PhD, is a full-time researcher of the Division of Research and Postgraduate Studies of the Instituto Tecnologico de Orizaba. His research interests include Web services, e-commerce, Semantic Web, Web 2.0, service-oriented and event-driven architectures and enterprise application integration.