IJSRSET1624112 | Received : 29 July 2016 | Accepted : 03 August 2016 | July-August 2016 [(2)4: 545-550 ]
© 2016 IJSRSET | Volume 2 | Issue 4 | Print ISSN: 2395-1990 | Online ISSN : 2394-4099 Themed Section: Engineering and Technology
545
Prediction of CBR Value of Coarse Grained Soils by Soft
Computing Techniques
Anupama. U*, Harini H. N.
*1Department of Civil Engineering, REVA I.T.M, Bangalore, Karnataka, India
2Department of Civil Engineering, MIT, Mysore, Karnataka, India
ABSTRACT
California Bearing Ratio (CBR) value is an indicator of subgrade soil strength and is used often for design of flexible pavements. The conventional soaked CBR testing method is expensive and time consuming. To overcome this situation, it is appreciable to predict CBR value of subgrade soil with simple properties of soils such as index properties which include grain size analysis (% Gravel, % Sand, % Fines), Liquid Limit (LL), and Maximum Dry Density (MDD) and Optimum Moisture Content (OMC) from Modified Compaction test.
This paper presents the application soft computing techniques like Artificial Neural Network (ANN) tool of MATLAB and Multiple Regression Analysis (MLR) tool of STATISTICA to build models to help predict California Bearing Ratio value of Coarse grained soils from the basic properties of soil viz. optimum moisture content and maximum dry density, liquid limit and Coarse fraction. Out of total Fifty-four soil data sets, 38 were used for training and 16 were used for testing. It was observed that prediction of CBR from the properties of soil was better through ANN than MLR. The performance of the developed ANN model has been validated by actual laboratory tests and a good correlation of 0.9 was obtained.
Keywords: ANN, CBR, LL, MLR, Modified OMC, MDD, Coarse Fraction, Soils.
I.
INTRODUCTION
Engineering projects that involve earthwork such as road embankments, airport runways and pavement constructions require construction of a proper foundation. The subgrade layer acts as a foundation for these structures. The subgrade should meet strength requirements. California Baring Ratio (CBR) is widely used as an index test to assess the strength characteristic of subgrade in such earth structures.
Characterizing subgrade material by using laboratory tests is involves many inherent problems. For instance, collection and testing of representative samples is a difficult process. Because of the large variability of typical subgrade materials, a large number of random samples are required to be collected and tested to generate results with good statistical significance.
A laboratory test generally takes four days to measure the soaked CBR value for each soil sample. The result of the tests is actually an indirect measure, which represents comparison of the strength of sub grade material to the strength of standard crushed rock referred in percentage values. Civil engineers generally encounter difficulties in obtaining representative CBR values for design of pavement. The CBR tests performed in lab are time consuming. Instead it can be predicted from the index properties of soil which are easily determined and measured in laboratories. Several studies have been conducted to estimate CBR from liquid limit, plasticity index, clay content and standard proctor compaction parameters. MLR and ANN are the most common methods adopted to develop relationships between parameters.
variables and a dependent variable by fitting a linear equation to observed data. Every value of the independent variable is associated with a value of the dependent variable. The equations are expressed as:
(Y =ax1 + bx2 + cx3+---)
Where Xn= is an independent variable, Y is a dependent variable and a, b, c…. are coefficients.
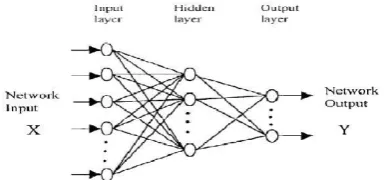
The ANN is one of the computing methods copied from the animal neuron network system which tries to identify the innate correlation among the data and provide a network between the input spaces (input layer/s) and the desired space (output layer/s) through the processor named neuron. This network is composed of at least three: input, hidden and output layers. The hidden layers receive the data from the input layer and deliver them to the output layer after training. Training is a process that ends in learning.
The network learning occurs when the
communicational weights among the layers change in a manner where the differences between predicted and computed values are at the acceptance level.
By obtaining these conditions, the learning process is materialized. These weights express the memory and the knowledge of the network. The trained neuron network can be applied in predicting the outcomes fit to the new data collection.
Fig. 1 shows the configuration of a feed forward three-layer ANN. In this figure, X is a system input vector composed of a number of causal variables that influence system behavior, and Y is the system output vector composed of a number of resulting variables that represent the system behavior.
Figure 1. Structure of feed forward ANN
II.
LITERATURE REVIEW
Most researchers found that ANN performs better than MLR. Many models were developed by several researchers to predict CBR based on index properties or on the standard proctor compaction parameters of the soils for local region.
Mehrjardi [1] evaluated soil properties using artificial neural network and multiple regression analysis for125 soil samples from the Gorgan Province, North of Iran. Results showed that ANN with two neurons in hidden layer had better performance in predicting soil properties than multivariate regression.
Gunaydın [2] presented the application of different methods (simple–multiple analysis and artificial neural networks) for the estimation of the compaction parameters (maximum dry unit weight and optimum moisture content) for soils from Turkey. Results showed that correlation equations obtained as a result of regression analyses are in satisfactory agreement with the test results.
Zelalem [3] developed a correlation between CBR and index properties of granular soil and silty clayey soils. For granular soils the properties considered were Optimum Moisture Content, Maximum Dry Density, and 60% passing sieve size. CBR had best correlation with OMC and MDD with coefficient of determination 0.863. For Silty-clayey soils, the properties considered were LL, PL, PI, OMC, Percent passing 0.075mm sieve no, MDD. Correlation was not strong as granular soils.
Mehmet Saltan[4] successfully used Artificial Neural Network for Flexible Pavement Thickness Modeling. ANN approach was used for the elimination of this drawback of time consumption and indirect measurements by Benkelman Beam dynaflect, road rater and falling weight deflectometer (FWD). Results indicate that the ANN can be used for back calculation of the thickness of layers with great improvement and accuracy
collected from Anatolia Region/Turkey. The results showed that maximum dry unit weight is the most effective parameter influencing CBR.
Venkatasubramanian, et.al,[6] developed a method for predicting CBR values from liquid limit, plasticity index, OMC, Maximum dry density, and UCC of soil samples from south India using ANN and MLR and found that MLR performed better and the value could be further improved by modifying the parameters
Patel, et.al,[7] developed correlation for alluvial soils of various zones of Surat city of Gujarat state, India using SPSS software. The correlation is established in the form of an equation of CBR as a function of different soil properties.
Saklecha, et.al,[8] suggested a Correlation between Mechanical Properties of weathered Basaltic Terrain and strength Characterization of foundation using ANN. Laboratory test data sets were collected for different locations in Wardha district in the state of Maharashtra, India. It has been shown that ANN was able to learn the relations between strength characteristic CBR and mechanical properties of foundation soil
Harini H.N et.al,[9] successfully used Artificial Neural Network (ANN) and Multiple Linear Regression(MLR) for the prediction of CBR from the properties of fine grained soils like plasticity properties, compaction properties and gradation properties collected in and around Bangalore city. The results showed that ANN model gives better correlation than MLR and hence can be used.
In the present study, ANN and MLR models were developed to predict the CBR value of Coarse grained soils from its basic properties such as LL, Coarse fraction, Modified OMC, and MDD. It was observed that ANN models can be an alternate method for estimation of CBR. ANN models are more precise, economical and rapid than MLR.
III.
MATERIALS AND METHOD OF ANALYSIS
Fifty four soil samples in and around Bangalore were collected. Experiments were conducted and the data obtained was first analyzed for the relationship between parameters. The potential of using MLR and ANNs for the estimation of CBR were investigated by
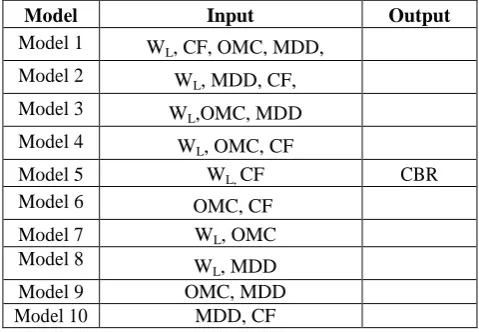
developing various models .The variables which appear to be potentially influential to CBR value were used for prediction models. Totally four basic soil parameters Liquid Limit (WL), Coarse Fraction, Optimum Moisture Content (OMC), and Maximum dry density(MDD), were taken into consideration as input parameters for the models. To obtain the best model that governs CBR, ten different models were established by proper combination of input data with CBR as output. The input scenarios of different models used in the study is given in Table 1. Out of total 54 soils sample data, 38were used for training and 16 were used for testing. 60% of data was used for training, 10% for cross validation and 25% for testing in ANN analysis.
Table 1. Input and Output For The Different Model
Model Input Output
Model 1 WL, CF, OMC, MDD,
Model 2 W
L, MDD, CF,
Model 3 WL,OMC, MDD
Model 4 WL, OMC, CF
Model 5 WL, CF CBR
Model 6 OMC, CF
Model 7 WL, OMC
Model 8 W
L, MDD
Model 9 OMC, MDD
Model 10 MDD, CF
MLR was carried out using STATISTICA software and ANN analysis was performed using MATLAB, which includes various training algorithms. Feed forward back propagation algorithm was made use of to obtain the models with 2 hidden layers. The statistics of the training and testing data set are given in Table 2.
Table 2. Statistics Of The Training And Testing Data Sets
Statistical Parameters
WL CF OMC
%
MDD g/cc
CBR %
T
ra
in
in
g
Minimum 18 66 8 1.77 5.6
Maximum
38 86 14 1.9 11.48
Mean
5.46 5.48 1.37 0.033 1.469
Minimum 18 65 9.0 1.78 5.46
Te
sti
ng
Maximum
38 84 13 1.89 9.19
Mean
25.18 76 10.68 1.83 6.64
SD
5.833 5.046 1.195 0.037 0.938
IV.
RESULTS AND DISCUSSION
Analysis by Multiple Linear Regressions (MLR):
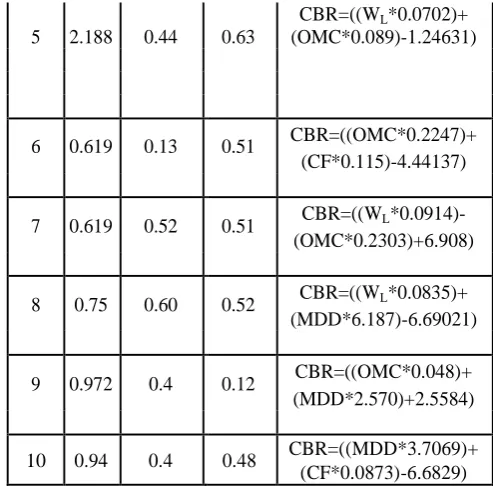
The regression analysis was performed using STATISTICA software and yielded the relation equations as shown in Table 3
Table 3. Performance Indices For Coarse Grained Soil By MLR
Model R
M S E
CC Equations generated
Model
No. Training Testing
1 0.272 0.68 0.70
CBR=((WL*0.0797)+(C
F*0.0902)+(OMC*0.03 103)+(MDD*7.145)-15.5367)
2 1.077 0.6 0.68
CBR =
((WL*0.0822)+(MDD*7.11
36)+
(CF*0.08586)-14.8805)
3 1.1 0.67 0.58
CBR= ((WL
*0.1025)-(OMC*0.2372)+(MDD*6. 3021)-4.8798)
4 0.84 0.59 0.63
CBR=((WL*0.0687)+
(OMC*0.017)+(CF*0.084 4)-1.586)
5 2.188 0.44 0.63
CBR=((WL*0.0702)+
(OMC*0.089)-1.24631)
6 0.619 0.13 0.51 CBR=((OMC*0.2247)+ (CF*0.115)-4.44137)
7 0.619 0.52 0.51 CBR=((WL *0.0914)-(OMC*0.2303)+6.908)
8 0.75 0.60 0.52 CBR=((WL*0.0835)+ (MDD*6.187)-6.69021)
9 0.972 0.4 0.12 CBR=((OMC*0.048)+ (MDD*2.570)+2.5584)
10 0.94 0.4 0.48 CBR=((MDD*3.7069)+ (CF*0.0873)-6.6829)
A comparative study of above results showed that model 1 with relatively high Correlation coefficient (CC) = 0.70 with least RMSE value works out to be the best performing model among other models.
This indicates CBR is well correlated with Liquid limit, Coarse fraction, Optimum moisture content and Maximum dry density. These are reasonable values and indicate good learning of model 1.The scatter plot for Coarse grained soils by MLR is obtained by considering the CBR values obtained by feeding the inputs of testing data to the obtained equations and the CBR values obtained from the laboratory for the same set of data as shown in Figure 2
Analysis by Artificial Neural Network (ANN):
Analysis by ANN was carried out by feed forward back propagation technique using tansig transfer functions and two hidden layers. On the basis of performance in testing, the best ANN model was obtained. The test results are presented in Table 4.
Table 4. Performance Indices for Coarse Grained Soil Group by ANN
The results indicate that a strong correlation was obtained for model 1 with structure 4-2-1 with correlation coefficient (CC) of 0.9.This model was successfully trained in 14 epochs. The test reports showed a good coefficient of relationship (r) = 0.81 during training and 0.90 during testing. RMSE was found to be 0.43. This indicates CBR is well correlated with Liquid limit, coarse fraction, OMC and MDD from modified proctor test.
The scatter plot for Coarse grained soils by ANN is obtained by considering the CBR values obtained by feeding the inputs of testing data to the trained networks and the CBR values obtained from the laboratory for the same set of data as shown in Figure3
Figure 3. Scatter plot for coarse grained soil of observed v/s predicted CBR of Model 1
V.
COMPARISION BETWEEN ANN AND MLR
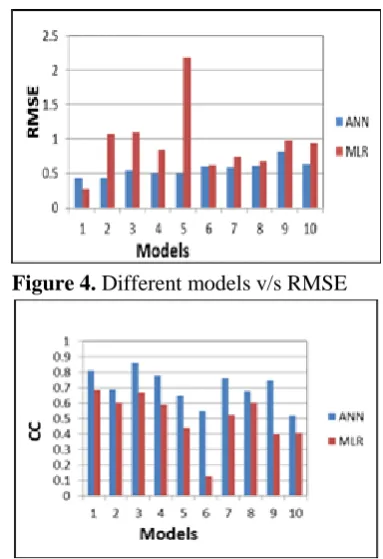
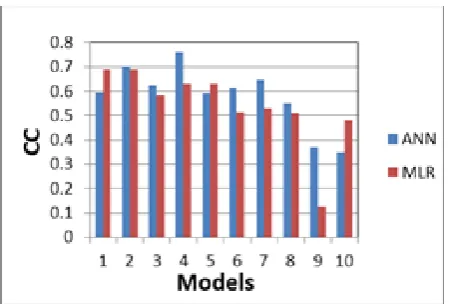
The variation of RMSE and CC with different models for ANN and MLR Analysis are as shown in figure 4, 5 and 6 respectively. The Figure 4 shows that RMSE is more for most of the MLR models when compared with ANN models
It is evident from figures5 and 6 that the correlation coefficient is more for ANN models during training and testing indicating the better learning and predicting ability of ANN models.
Figure 4. Different models v/s RMSE
Figure 5. Different models v/s CC during Training
Model RMSE
CC
No of neurons Training Testing
1 0.43 0.81 0.90 04
2 0.43 0.69 0.70 07
3 0.54 0.86 0.70 05
4 0.49 0.78 0.84 05
5 0.50 0.65 0.59 06
6 0.60 0.55 0.61 03
7 0.60 0.76 0.64 04
8 0.60 0.68 0.55 06
9 0.81 0.75 0.37 05
Figure 6. Different models v/s CC during Testing
VI.
CONCLUSION
ANN and MLR analysis on Coarse grained soil was performed and following conclusions are drawn
1. Neural network models trained by feed forward back-propagation algorithm, with two hidden layers, perform reasonably well for correlating CBR with properties of soil.
2. Neural network models, which can easily incorporate additional model parameters, give less scattered predicted values than those given by MLR.
3. ANN analysis indicated that Liquid limit, Coarse fraction, OMC and MDD have been found to be the most sensitive parameters in correlating CBR with Correlation coefficient (CC) of 0.9
4. MLR method showed that Liquid limit, Coarse fraction, OMC and MDD strongly correlated with CBR value with Correlation coefficient (CC) value of 0.70
5. The CC values obtained by M LR are less than that obtained from ANN for most of the models. Hence it can be concluded that ANN model using Feed Forward Back Propagation Network algorithm with two hidden layers gives better correlation than MLR and hence can be used.
VII.
ACKNOWLEDGEMENTS
The authors extend their sincere thanks to Dr. Y. Ramalinga Reddy, Director, School of Civil Engineering, REVA University, and Prof Prahlad, in providing support to carry out this work
VIII.
REFERENCES
[1] F. Sarmadian and R. Taghizadeh Mehrjardi “Modeling of
Some Soil Properties Using Artificial Neural Network and Multivariate Regression in Gorgan Province, North of Iran”-Global Journal of Environmental Research (2008).
[2] O. Gunaydın “Estimation of soil compaction parameters
by using STATISTICAL analyses and artificial neural networks” Environmental Geology (2009).
[3] Zelalem Worku Ferede “Prediction of California Bearing
Ratio (CBR) value from index properties of soil”-Addis Ababa University, April( 2010).
[4] Mehmet Saltan, Mesut TI Gdemir, Mustafa Karasahin
“Artificial Neural Network Application for Flexible Pavement Thickness Modeling”-Turkish J. Eng. Env. Sci.,(2006).
[5] T. Taskiran “Prediction of California bearing ratio (CBR)
of fine grained soils by AI methods” Advances in Engineering Software-41 (2010).
[6] Venkatasubramanian and Dhinakaran “ANN model for
predicting CBR from index properties of soils” International journal of civil and structural engineering- Volume 2, No 2, 2011.
[7] Patel, Rashmi S. Desai, M.D “CBR Predicted by Index
Properties for Alluvial Soils of South Gujarat”, Indian Geotechnical Conference-December(2010).
[8] Saklecha P.P, Katpatal Y.B “Correlation of Mechanical
Properties of weathered Basaltic Terrain for strength Characterization of foundation using ANN” International Journal of Computer Applications-Nov(2011).
[9] Mukesh A. Patel and Dr. H. S. Patel, “Correlation
Between Physical Properties and California Bearing Ratio Test on Soils of Gujarat Region in Both Soak and Unsoak Condition”, International Journal of Civil Engineering & Technology (IJCIET), Volume 3, Issue 2, 2012, pp. 50 - 59, ISSN Print: 0976 – 6308, ISSN Online: 0976 – 6316.
[10] Dr. K.V.Krishna Reddy, “Benefit Analysis of Subgrade
and Surface Improvements in Flexible Pavements”, International Journal of Civil Engineering & Technology (IJCIET), Volume 4, Issue 2, 2013, pp. 385 - 392, ISSN Print: 0976 – 6308, ISSN Online: 0976 – 6316.
[11] Dr. K.V.Krishna Reddy, “Correlation Between California
Bearing Ratio and Shear Strength on Artificially Prepared Soils with Varying Plasticity Index”, International Journal of Civil Engineering & Technology (IJCIET), Volume 4, Issue 6, 2013, pp. 61 - 66, ISSN Print: 0976 – 6308, ISSN Online: 0976 – 6316.
[12] Harini H.N and Sureka Naagesh, “Fine grained soils