New Zealand Journal of Ecology (2018) 42(1): 58-64 © New Zealand Ecological Society.
New Zealand falcon prey selection may not be driven by preference based on prey
nutritional content
Sara M Kross
1,2*, Alice Tait
3, David Raubenheimer
4and Ximena J Nelson
11School of Biological Sciences, University of Canterbury, Private Bag 4800, Christchurch 8140, New Zealand 2Department of Environmental Studies, California State University, Sacramento, CA 95819, USA
3Institute of Natural and Mathematical Sciences, Massey University, Private Bag 102 904, North Shore Mail Centre,
Auckland, New Zealand
4School of Life and Environmental Sciences and Charles Perkins Centre, The University of Sydney, NSW 2006, Australia
*Author for correspondence (Email: saramaekross@gmail.com)
Published online: 14 December 2017
Abstract: Little is known about how diurnal raptors, as apex predators, select their prey. It has been hypothesised that they are opportunistic, taking prey according to availability, and that they select prey based on prey size. The
threatened New Zealand falcon or kārearea (Falco novaeseelandiae) is New Zealand’s only remaining endemic
bird of prey. A previous study on prey caught by kārearea during the breeding season suggested that introduced
avian prey were taken more often than expected, and endemic avian prey taken less often than expected, based on their abundance. There is a growing interest in the role that nutrients play in prey selection by predators. We
used the nutritional geometry framework in a field study to determine the role that nutritional composition plays in prey choice. We built on an existing dataset to assess whether prey selection by kārearea can be explained
based on prey body-mass, abundance, or nutritional characteristics. We determined the protein-to-lipid ratio and ash content of individuals across 16 species of prey and potential prey, including both endemic and introduced species, and modelled these against known prey consumption based on our earlier work. We found limited evidence for selective predation based on nutrient balancing. Instead, the relative abundance of each species in the surrounding habitat and the endemicity of each species were the most important predictors, with species body-mass playing only a minor role in prey choice. To investigate the apparent selection for introduced over endemic prey, future research could compare the behavioural adaptations of endemic birds against their natural predator with behaviours of introduced birds.
Keywords: diet; Falco novaeseelandiae; foraging behaviour; nutritional geometry; prey choice
Introduction
Animals often do not forage solely in an opportunistic manner, but may take into account prey preference, likelihood of risk, or nutritional composition of the food source (Krause & Godin 1996; Nelson & Jackson 2006; Behmer 2009). Diurnal raptors are well-known apex predators, but little is known about how they select prey. Many previous studies have assumed that raptors are largely opportunistic predators, and choose prey based on their abundance in the environment (Fox 1977; Barea et al. 1999; Salamolard et al. 2000; Gliwicz 2008; Seaton et al. 2008), but some studies have indicated that raptors select prey based on total available prey biomass (Bozinovic & Medel 1988), or on individual prey body size (Steenhof & Kochert 1988).
Birds of prey that have more abundant food sources early in the breeding season have greater breeding output because they lay larger clutches (Newton & Marquiss 1981) and
produce more fledglings (Wiehn & Korpomäki 1997; Palmer
et al. 2001). Falco novaeseelandiae, the New Zealand falcon
or kārearea, is New Zealand’s only remaining endemic bird of
prey and consists of two subspecies (F. n. novaeseelandiae and F. n. ferox;Trewick & Olley 2016)both of which are classified
as ‘At Risk-Recovering’ by the New Zealand Department of Conservation (Robertson et al. 2017). The interaction between
kārearea and potential prey is of considerable relevance to
management of this species because of its potential effect on population increase.
Conservation-related research, especially on island ecosystems that have been invaded by introduced species (Courchamp et al. 2003), typically examines predation on native species by introduced species. In a New Zealand context, a well-supported idea is that native species (often birds, but also reptiles) have not coevolved with (typically) mammalian predators and are prone to falling prey to introduced predators because of a lack of evolved defences (Diamond & Veitch 1981; Towns et al. 2001; Wilson 2004; Massaro et al. 2012; Stanbury & Briskie 2015). Prior to human arrival c. 1280 AD,
New Zealand did not have significant mammalian predators, so this niche was filled by avian predators – one of these being the kārearea. This study is a follow-up to a previous field study
conducted over the summer reproductive season of the ‘eastern’ falcon (F. n. novaeseelandiae). In the previous study, we found
that kārearea, in both intensive agriculture (vineyards in the
Marlborough region of the South Island of New Zealand) and nearby hill-grazing landscapes (Marlborough’s high country), appear to select introduced (but not endemic) bird species as prey more often than would be expected given the relative abundance of prey in the surrounding habitats (Kross et al.
2013). Those results showed that while kārearea took larger
and more abundant prey at greater frequencies, they also chose, or were more effective at capturing, introduced avian prey relative to the endemic prey alongside which they evolved.
This interesting ‘flip-side’ to the more famous examples of
(perhaps by being behaviourally less nimble) than species that
coevolved with kārearea, yet before exploring this theory it is important to first examine other important factors involved
in prey selection.
For optimal foraging, predators are expected to maximise the size of the prey that can be taken with minimal searching time, handling time (chasing and subduing prey), and risk to themselves (MacArthur & Pianka 1966; Charnov 1976). Consequently, all other things being equal (e.g. equally visible to the predator), larger animals requiring higher energy expenditure will choose larger prey. Allometric relationships between predator and prey may explain predator behaviour, assuming the metabolic rate of the predator is known. This approach has been used on birds of prey by Bozinovic and Medel (1988), based on the metabolic equation for birds given by Nagy (1987). In an analysis of eight species (including raptors and owls), Bozinovic and Medel (1988) found a positive relationship between predator size and consumed prey body mass in several (but not all) species.
There is a growing interest in the role that nutrients play in prey selection by predators (Mayntz et al. 2005; Kohl et al. 2015), catalysed by the development of the nutritional geometry framework (Raubenheimer & Simpson 1997; Raubenheimer 2011). This framework considers how mixtures of nutrients might affect food choice and consumption. Studies using this approach have shown that many species of herbivores and
omnivores, both in the lab and the field, choose foods and
regulate the amounts eaten based on macronutrient (protein, lipid and carbohydrate) balance rather than energy content per se (Simpson & Raubenheimer 2012). Recent evidence suggests
that some predators, including insects, spiders, fish, mink and
bears, likewise select prey (or selectively eat certain body
parts of prey) based on a requirement for a specific balance of
macronutrients (reviewed in Kohl et al. 2015). However, few studies have applied this framework to examine prey choice
of predators in the field (Machovsky-Capuska et al. 2016).
This is an important omission, because understanding the factors that govern prey choice may play a role in conservation management. For example, Coogan and Raubenheimer (2016) used the nutritional geometry framework to develop models suggesting that a shortage of food high in lipid or carbohydrate content for North American grizzly bears (Ursus arctos) may
lead to human-wildlife conflict during nutrient-limited seasons.
Here we report a study in which we applied the nutritional geometry framework to examine whether prey nutritional
composition played a role in food selection by kārearea, or
whether prey abundance or body mass were the primary drivers.
Materials and methods
We used previously published field data (Kross et al. 2013) as the basis for our nutrient composition analysis. Briefly, nestling diet at ten kārearea nests was assessed using a combination
of video and prey remains over the course of three breeding
seasons from 2008–2010. The analysis of both prey remains
and remote videography is a robust way to avoid biases inherent in each system and accurately assess prey taken (Kross et al.
2013). At each nest site, modified 5-minute bird counts (Bibby
et al. 2000; Hartley 2012) were used to measure the abundance of prey species at four locations in representative habitats within 500 m of the nest. Counts were truncated to a 50-m radius around the observer to partly control for differences in detectability and conspicuousness among species. While
5-minute bird counts pose concerns for comparisons between habitats and years (Hartley 2012), our counts were all conducted in similarly open habitat types (e.g. vineyards, low-intensity grazing land, planted/felled forestry blocks), and our analyses directly compared prey availability with prey consumption in each nest site, therefore, controlling for potential differences between years. These prey availability data were used to
quantify the available prey species for kārearea in the habitats
around each nest. By frequency, 97.9% of prey delivered to
kārearea nests was avian (Kross et al. 2013), and 664 wild birds were positively identified to species level using the
combination of videos placed at nests (Kross & Nelson 2011) and prey remains found at and near nests (Kross et al. 2013). We assumed that all species were equally detectable in both prey remains and bird counts (Kross et al. 2013).
For the nutritional composition analysis, we used 16 bird
species that represented over 89% of the positively identified avian prey items in our field study, including five endemic
species. We obtained frozen samples of birds from collections stored by the Department of Conservation or the University of Canterbury. The likely cause of death of each bird was noted at the time of initial carcass collection. Most specimens had
been collected after being struck by cars, flying into windows,
or being killed by domestic cats. To avoid sampling birds that had died for reasons that might seriously affect nutrient composition, carcasses with signs of disease, malnutrition and/or decomposition were not used.
Up to four individuals of each species were chosen
for analysis (Table 1). The flight and body feathers of each
individual were plucked and the beaks and feet were removed from the weka (Gallirallus australis australis), quail (Callipepla californica) and kererū (Hemiphaga novaeseelandiae), since
kārearea normally remove the feathers of their prey species
and do not consume the feet or beaks from large species (Fox 1977). We chose to remove the feet from all birds over 100 g because while the feet of starlings and blackbirds have been
observed being consumed by kārearea on video, the feet of
quail were found in uneaten prey remains in the study area (SMK, pers. obs.). The contents of the prey birds’ digestive tracts were also removed because video analysis and analysis
of uneaten remains at kārearea nests revealed that adults often
remove these from avian prey (SMK, pers. obs.).
Samples were chopped into c. 1 cm cubes, frozen at -80oC for a minimum of 48 h, and then freeze dried to c. 4%
moisture levels. Samples were then ground using a ball-mill for 2 minutes (Retsch MM2000, Hahn, Germany), stored in sealed containers and frozen again. Immediately prior to analysis, samples were re-dried overnight in a convection
oven (Contherm Scientific Ltd, Wellington, New Zealand)
at 60°C and re-ground in a coffee grinder. Total nitrogen was measured by Kjeldahl analysis (AOAC 981.10, AOAC 1990) using a Tecator Digestion System and a Kjeltec 8100 Distillation Unit (FOSS, Hillerød, Denmark). Crude protein was estimated by multiplying nitrogen by a factor of 6.25. Total lipid (ether extract) was measured using the Mojonnier method (AOAC 954.02). Moisture was measured by drying the sample in a convection oven at 125°C (AOAC 950.46) and combining this moisture loss with initial loss from the overnight drying. Ash was measured by ignition in a furnace at 550°C (AOAC 920.153).
We created separate linear mixed-effects models of the
relative proportion of each prey species in kārearea diet at
by number and (2) by biomass (each prey species at each nest being a replicate). Predictor variables were the relative abundance of each prey species in the environment surrounding a nest, the endemicity of each species (a categorical variable including endemic, native, and introduced species), and the individual body mass of each prey species (as in Kross et al. 2013). Our candidate model set included all combinations of these three predictors and a nutritional variable, which was either the protein to lipid ratio of each prey species or the result of a principal components analysis compiling all three macronutrients for each prey species. We included two random effects: nest site to group non-independent prey per nest site; and prey species to account for multiple measurements of each species’ abundance and nutritional components. We only included the 16 avian prey species for which we had nutritional information, therefore the total proportion of species at each
nest did not sum to one (range 0.80–0.96). We used the lme4
package (Bates et al. 2015) in R v 3.3.1 (R Development Core Team 2016), which calculates Satterthwaite approximations to
degrees of freedom. Models were fitted with REML to obtain
parameter estimates, and with ML to compare log-likelihood and Akaike’s Information Criterion between models. We used arcsine-square-root transformations to linearise proportional data, and have back-transformed model predictions in our results.
Because the protein, lipid and ash content of each prey species were highly correlated, we used a principal components analysis to summarise these data into two orthogonal axes that explained over 99% of the variance among them. The
first axis, PC1, was positively correlated with ash and protein
and negatively correlated with lipid. The second axis, PC2, was positively correlated with ash, negatively correlated with protein, and not correlated with lipid. Therefore, we would
expect that if kārearea prey selection was positively driven by
PC1, species with lower lipid content would be selected. Our candidate prey species proportion models (above) included
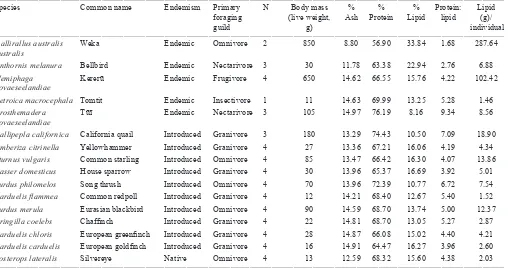
Table 1. Characteristics of species used for nutritional composition analysis.
__________________________________________________________________________________________________________________________________________________________________ Species Common name Endemism Primary N Body mass % % % Protein: Lipid
foraging (live weight, Ash Protein Lipid lipid (g)/
guild g) individual
__________________________________________________________________________________________________________________________________________________________________ Gallirallus australis Weka Endemic Omnivore 2 850 8.80 56.90 33.84 1.68 287.64 australis
Anthornis melanura Bellbird Endemic Nectarivore 3 30 11.78 63.38 22.94 2.76 6.88 Hemiphaga Kererū Endemic Frugivore 4 650 14.62 66.55 15.76 4.22 102.42
novaeseelandiae
Petroica macrocephala Tomtit Endemic Insectivore 1 11 14.63 69.99 13.25 5.28 1.46 Prosthemadera Tūī Endemic Nectarivore 3 105 14.97 76.19 8.16 9.34 8.56
novaeseelandiae
Callipepla californica California quail Introduced Granivore 3 180 13.29 74.43 10.50 7.09 18.90 Emberiza citrinella Yellowhammer Introduced Granivore 4 27 13.36 67.21 16.06 4.19 4.34 Sturnus vulgaris Common starling Introduced Omnivore 4 85 13.47 66.42 16.30 4.07 13.86 Passer domesticus House sparrow Introduced Granivore 4 30 13.96 65.37 16.69 3.92 5.01 Turdus philomelos Song thrush Introduced Omnivore 4 70 13.96 72.39 10.77 6.72 7.54 Carduelis flammea Common redpoll Introduced Granivore 4 12 14.21 68.40 12.67 5.40 1.52 Turdus merula Eurasian blackbird Introduced Omnivore 4 90 14.59 68.70 13.74 5.00 12.37 Fringilla coelebs Chaffinch Introduced Granivore 4 22 14.81 68.70 13.05 5.27 2.87
Carduelis chloris European greenfinch Introduced Granivore 4 28 14.87 66.08 15.02 4.40 4.21
Carduelis carduelis European goldfinch Introduced Granivore 4 16 14.91 64.47 16.27 3.96 2.60
Zosterops lateralis Silvereye Native Omnivore 4 13 12.59 68.32 15.60 4.38 2.03 __________________________________________________________________________________________________________________________________________________________________
alternative nutritional predictor variables for each prey species, either one or both principal component axis values, or the protein to lipid ratio.
Results
Given the differences in body size and foraging strategies
between prey species, it was not surprising to find that prey
species had variable nutritional compositions. However, introduced species (irrespective of foraging strategy) were considerably more nutritionally similar to each other (range
% protein: 64.5–74.4; range % lipid: 10.50–16.69) than native and endemic species (range % protein: 56.9–76.2; range % lipid: 8.2–33.8; Table 1; Fig. 1). While endemic species
had both the highest and lowest protein to lipid ratios, two endemic species fell in the middle of the spread of introduced species (Fig. 1). Endemic species were found at low relative abundances in the habitats surrounding falcon nests (Fig. 2a), but also represented potential prey items with the lowest and highest individual body mass (Fig. 2b). Many of the species analysed for nutritional content showed high variability between individuals (Fig. 1). Although the body mass of introduced species was considerably more uniform than that of native species (Fig. 2b), all species in this study are known
prey of kārearea, as are species much larger than those used in
this study, such as rabbits (Oryctolagus cuniculus) and hares (Lepus europaeus) (Kross et al. 2013).
For the importance of each prey species in kārearea diet
by frequency of individuals consumed, the most important predictors were endemicity and relative abundance (Table 2). This model predicts that, holding the relative abundance of prey static, falcons select endemic species 0.09% of the time, but
that this selection does not differ significantly from zero (95%
CI: 0.0%, 0.24%, t12.2 = 0.43, p = 0.67). Introduced species
Figure 2. The relationship between the mean protein:lipid ratio in prey species compared to a) the relative proportion abundance of each prey species in the environment; and b) the mean body mass of each species.
= 4.57, p < 0.001), and native species are selected 1.98% of the time (95% CI: 0.0%, 9.41%, t13.6 = 2.39, p = 0.03). For
each 1% increase in the relative abundance of a prey species in the surrounding habitat, its likelihood of being selected as
prey by kārearea increases by 94.79%, which indicates a nearly
1:1 ratio of increase (95% CI 72.70%, 98.62%, t77 = 8.80, p
< 0.001). A model containing endemicity, relative abundance and the protein to lipid ratio of prey was the second-best-supported model, while a model containing endemicity, relative abundance, and body mass was the third-best-supported model (Table 2). These two models each had some support based on Akaike weight, but their weights were each less than half that of the best-supported model. Furthermore, both protein to lipid ratio (p = 0.53) and prey body mass (p = 0.76) were
statistically nonsignificant variables in the models in which
they were retained.
For the importance of each prey species in the diet by contribution to total dietary biomass, the best-supported model contained prey endemicity and relative abundance. This model predicts that, holding the relative abundance of prey static, falcons select endemic species 0.04% of the time, but that
this selection does not differ significantly from zero (95%
CI 0%, 0.79%, t12.8 = 0.53, p = 0.60). Introduced species are
selected 2.69% of the time (95% CI 0.005%, 10.03%, t14.3 =
3.07, p < 0.01), and the native species is selected 0.48% of the time (95% CI 0%, 4.89%, t13.7 = 0.53, p = 0.61). For each
1% increase in relative abundance of a prey species in the surrounding habitat, its likelihood of being selected as prey
by kārearea increases by 61.95% (95% CI 18.64%, 94.73%,
t132.9 = 4.57, p < 0.001). The second- and third-best supported
models each contained one additional parameter on the best-supported model: prey body mass and prey protein to lipid
ratio, respectively. These two models each had some support based on Akaike weight, but their weights were less than half that of the best-supported model (Table 2). Furthermore, both protein to lipid ratio (p = 0.79) and prey body mass (p = 0.56)
were statistically nonsignificant variables in the models in
which they were retained. Indeed, when plotted, there was no clear relationship between the relative proportion abundance of each prey species in the environment or mean body mass of prey species and their mean protein to lipid ratio (Fig. 2).
Discussion
Our results do not support the hypothesis that either body mass or nutritional content of the prey are primary drivers
of kārearea prey choice, but rather suggest that both relative
abundance of prey species and the endemicity of species are important (Seaton et al. 2008; Kross et al. 2013). We found that the nutritional composition of each species did not drive
the prey choices of kārearea that we previously observed in the field (Kross et al. 2013). We were somewhat surprised to find so little variation in the nutritional content of introduced
birds of different foraging guilds, since different diets can affect the balance of carbon to nitrogen, an index that is commonly used as a proxy for relative body protein content, even between members of the same species (Greer 2015;
Greer et al. 2015; Novais et al. 2016). While we did find
variation in prey composition, there was overlap between endemic and introduced species, which may explain why
none of our models seeking to predict observed kārearea prey
choices retained nutritional predictor variables. Although we found no evidence for selective predation based on nutrient balancing, these data are extremely hard to collect, and we had
relatively small sample sizes for both the field work (Kross et
Table 2. The eight simplest models for predicting the relative importance of prey species in the diet of kārearea by number
(upper panel) and prey biomass (lower panel). The models tested the effects of the relative abundance of prey species in the habitat surrounding nests, the body mass of each prey species, the endemicity of each prey species to New Zealand (categorical: endemic, native or introduced), and the nutritional composition of each species (PC1, PC2 or protein:lipid
(P:L)). Columns show the difference between each model and the best-supported model (∆AIC), the number of parameters
included in the model, and the Akaike weight (wi) of the model.
∆AIC log-likelihood Model Parameters wi
__________________________________________________________________________________________________________________________________________________________________
Importance in diet by number
~ Endemicity + abundance 0.00 127.04 7 0.46
~ Endemicity + abundance + P:L 1.44 127.32 8 0.22
~ Endemicity + abundance + body mass 1.88 127.11 8 0.18
~ Endemicity + abundance + body mass+ PC1 3.47 127.31 9 0.08
~ Endemicity + abundance + body mass + PC1 + PC2 4.05 128.02 10 0.06
~ Abundance 12.92 118.58 5 0.00
~ Endemicity 55.54 98.28 6 0.00
Null model 65.92 91.09 4 0.00
__________________________________________________________________________________________________________________________________________________________________
Importance in diet by biomass
__________________________________________________________________________________________________________________________________________________________________
~ Endemicity + abundance 0.00 98.003 7 0.44
~ Endemicity + abundance + body mass 1.52 98.244 8 0.21
~ Endemicity + abundance + P:L 1.91 98.05 8 0.17
~ Endemicity + abundance + body mass + PC1 3.38 98.314 9 0.08
~ Endemicity + abundance + body mass+ PC1 + PC2 3.71 99.149 10 0.07
~ Abundance 5.11 93.447 5 0.03
~ Endemicity 17.90 88.054 6 0.00
Null model 28.20 80.905 4 0.00
__________________________________________________________________________________________________________________________________________________________________
al. 2013) and the nutritional analyses. Thus, while these data
do not support the hypothesis that kārearea select prey based
on nutrient composition, it is possible that they might mix different types of prey to compose a nutritionally balanced diet. Given that for each response variable, one highly ranked model did retain protein-to-lipid ratio as a predictor variable, further research in this area is needed. However, our data also suggest alternative hypotheses for prey choice behaviour
in kārearea, including that endemic species may have more
effective anti-predator adaptations than introduced species for
avian predators such as kārearea.
The 5-minute bird count method that we used may underestimate the relative abundance of less conspicuous species, including many endemic species (Hartley 2012). We believe that in our study, by truncating distance detections to within 50 m of the observer and doing counts in predominantly open habitats (e.g. grasslands, shrublands, vineyards, recently felled areas within forestry), we were unlikely to
have significantly underestimated the relative abundance
of endemic species, many of which are found more often in forested habitats (MacLeod et al. 2012). Furthermore, if the relative abundance of endemic species was higher than our results indicated, it would point to an even more pronounced preference by falcons to select introduced prey over endemic species. We encourage future researchers to incorporate distance sampling methodologies into their estimates of falcon prey abundance, or to use an even smaller sampling area to ensure equal detectability across prey species.
The pursuit strategies used by kārearea have evolved in the context of their flight capabilities, as well as their need to pursue
rapid, erratically moving prey in three-dimensional aerial environments. As implied by Kane and Zamani (2014), prey evasive strategies are likely to create selection opportunities
possess more specialised anti-predator behaviours in the face of native avian predators. New Zealand birds evolved with only avian predators prior to the introduction of mammals by human settlers. Many species of endemic New Zealand birds have been noted as displaying anti-predator behaviours not considered useful when facing mammalian predators (for example, freezing when threatened; Wilson 2004). These behaviours have been assumed to be a response to the visual hunting strategies of avian predators, which rely on detecting movement to track prey.
Another possible explanation for the apparent selection for introduced prey over endemic prey is that many introduced species typically spend more time in open habitats, and
endemic species are found closer to dense cover. Kārearea are
sparrowhawk-like in their morphology and are often considered to be a forest falcon because of their relatively short, wide wings and long tails (Fox 1977; Seaton 2007) that make them
adept at hunting in forested environments. Kārearea do not
typically dive or ‘stoop’ at prey from above, as is typical in other Falco species (Dekker 1980; Dekker & Lange 2001;
Zoratto et al. 2010), but instead will glide or fly directly at prey
from a perch, engage in tail chases, or use contour-hugging
low flight to flush prey (Fox 1977). These hunting behaviours
may be more successful against the generally open-habitat introduced bird species than against more forest-dwelling
endemic species. Therefore, while our field surveys did quantify
relative avian abundance in representative habitats around each nest, including both open and more forested habitats,
kārearea may have been preferentially hunting in relatively open habitats, as kārearea were shown to do in North Island
plantation forest (Seaton et al. 2008; Horikoshi et al. 2017).
Our field-based findings (Kross et al. 2013) from South Island
study sites agree with those of Seaton et al. (2008), in which many of the endemic species in their North Island study
area were selected against by foraging kārearea. Likewise,
in Marlborough, Fox (1977) observed 161 hunting attempts on avian prey, only three of which were on endemic species (two on fantail Rhipidura fuliginosa, one on New Zealand pipit Anthus novaeseelandiae; 0% success), compared with 151 observed attacks on introduced species (11 species; 28% success), and seven observed attacks on native species (four species; 28% success). We suggest that further research on the anti-predator adaptations of endemic New Zealand birds against native avian predators would be a fruitful avenue for future
work. Given the difficulties of observing sporadic predation
events, this research could be addressed in a citizen science project (Nelson & Fijn 2013). Citizens who see a falcon attack
could film it; clips submitted to a single repository could then
be analysed to assess differences in the evasive manoeuvres of native versus introduced prey birds. Such a study would be of considerable interest, as the existing literature is dominated by reports of endemic New Zealand birds lacking anti-predator adaptations against introduced predators.
Acknowledgements
We thank J. Healy, K. Udy, and S. Roselli for help with drying and processing samples. D. Wilson, G. Perry, A. Glen, and D. Armstrong provided valuable comments that improved manuscript presentation. J. Briskie and P. Gaze provided
access to deceased birds. Ngāi Tahu gave permission to utilise
endemic bird samples and other permits for this research were provided by the Department of Conservation (NM-23677-FAU)
with help from P. Gaze; ethics permission was provided by the University of Canterbury (2008/27R). We were supported by a University of Canterbury Doctoral Scholarship (to SMK) and
grants from the Brian-Mason Scientific & Technical Trust and
the Miss E.L. Hellaby Indigenous Grasslands Research Trust.
References
AOAC 1990. Official methods of analysis. 15th edn. Arlington, Virginia, USA, Association of Official Analytical Chemists
Inc. 1298 p.
Barea LP, Waas JR, Thompson K, Hyde NH 1999. Diet provided for chicks by New Zealand falcons (Falco novaeseelandiae) nesting in forested habitat. Notornis
46: 257–267.
Bates D, Maechler M, Bolker B, Walker S 2015. Fitting linear mixed-effects models using lme4. Journal of Statistical
Software, 67: 1–48.
Behmer ST 2009. Insect herbivore nutrient regulation. Annual
Review of Entomology 54: 165–187.
Bibby CJ, Burgess ND, Hill DA, Mustor SH 2000. Bird census techniques. 2nd edn. London, Academic Press. 302 p. Bozinovic F, Medle RF 1988. Body size, energetic and
foraging mode of raptors in central Chile. Oecologia
75: 456–458.
Charnov EL 1976. Optimal foraging, the marginal value
theorem. Theoretical Population Biology 9: 129–136.
Coogan SCP, Raubenheimer D 2016. Might macronutrient
requirements influence grizzly bear–human conflict?
Insights from nutritional geometry. Ecosphere 7: e01204. Courchamp F, Chapius J-L, Pascal M 2003. Mammal invaders on islands: impact, control and control impact. Biological
Reviews 78: 347–383.
Dekker D 1980. Hunting success rates, foraging habits, and prey selection of peregrine falcons migrating through
central Alberta. Canadian Field Naturalist 94: 371–382.
Dekker D, Lange J 2001. Hunting methods and success rates of gyrfalcons, Falco rusticolus, and prairie falcons, Falco mexicanus, preying on feral pigeons (rock doves), Columba livia, in Edmonton, Alberta. Canadian Field
Naturalist 115: 395–401.
Diamond JM, Veitch CR 1981. Extinctions and introductions
in the New Zealand avifauna: cause and effect? Science 211: 499–501.
Fox NC 1977. The biology of the New Zealand falcon (Falco novaeseelandiae Gmelin, 1788). Unpublished PhD thesis, University of Canterbury, Christchurch, New Zealand. 421 p.
Gliwicz J 2008. Body size relationships between avian predators and their rodent prey in a North-American sagebrush
community. Acta Ornithologica 43: 151–158.
Greer AL 2015. Intraspecific variation in the foraging ecology
and morphology of kea Nestor notabilis. Unpublished PhD thesis, University of Canterbury, Christchurch, New Zealand. 174 p.
Greer AL, Horton TW, Nelson XJ 2015. Simple ways to calculate stable isotope discrimination factors and convert between tissue types. Methods in Ecology and Evolution
6: 1341–1348.
Hartley LJ 2012. Five-minute bird counts. New Zealand Journal
of Ecology 36: 1–11.
ferox) in an intensively managed pine plantation, central North Island, New Zealand. New Zealand Journal of
Ecology 41: 193–206.
Kane SA, Zamani M 2014. Falcons pursue prey using visual motion cues: new perspectives from animal-borne cameras.
Journal of Experimental Biology 217: 225–234.
Kohl KD, Coogan SCP, Raubenheimer D 2015. Do wild
carnivores forage for prey or for nutrients? Bioessays 37: 701–709.
Krause J, Godin, J-GJ 1996. Influence of prey foraging posture on flight behavior and predation risk: predators take advantage of unwary prey. Behavioral Ecology 7: 264–271.
Kross SM, Nelson XJ 2011. A portable low-cost remote videography system for monitoring wildlife. Methods in
Ecology and Evolution 2: 191–196.
Kross SM, Tylianakis JM, Nelson XJ 2013. Diet composition and prey choice of New Zealand falcons nesting in anthropogenic and natural habitats. New Zealand Journal
of Ecology 37: 51–59.
MacArthur RH, Pianka ER 1966. On optimal use of a patchy
environment. American Naturalist 100: 603–609.
Machovsky-Capuska GE, Coogan SCP, Simpson SJ, Raubenheimer D 2016. Motive for killing: what drives
prey choice in wild predators? Ethology 122: 703–711.
MacLeod CJ, Greene TC, MacKenzie DI, Allen RB 2012. Monitoring widespread and common bird species on New Zealand’s conservation lands: a pilot study. New Zealand
Journal of Ecology 36: 300–311.
Massaro M, Stanbury M, Briskie JV 2012. Nest site selection by the endangered black robin increases vulnerability to predation by an invasive bird. Animal Conservation 16:
404–411.
Mayntz D, Raubenheimer D, Salmon M, Toft S, Simpson SJ
2005. Nutrient-specific foraging in invertebrate predators. Science 307: 111–113.
Nagy KA 1987. Field metabolic rates and food requirements scaling in birds and mammals. Ecological Monographs
57: 111–128.
Nelson XJ, Fijn N 2013. The use of visual media as a tool for investigating animal behaviour. Animal Behaviour
85: 525–536.
Nelson XJ, Jackson RR 2006. A predator from East Africa that chooses malaria vectors as preferred prey. PLoS ONE 1: e132.
Newton I, Marquiss M 1981. Effect of additional food on laying dates and clutch sizes of sparrowhawks. Ornis
Scandinavica 12: 224–229.
Novais A, Dias E, Sousa R 2016. Inter- and intraspecific
variation of carbon and nitrogen stable isotope ratios in
freshwater bivalves. Hydrobiologia 765: 149–158.
Palmer AG, Nordmeyer DL, Roby DD 2001. Factors
influencing nest attendance and time-activity budgets of peregrine falcons in interior Alaska. Arctic 54: 105–114.
R Development Core Team 2016. R: a language and environment for statistical computing. Vienna, Austria, R Foundation for Statistical Computing. www.R-project.org. Raubenheimer D 2011. Toward a quantitative nutritional
ecology: the right-angled mixture triangle. Ecological
Monographs 81: 407–427.
Raubenheimer D, Simpson SJ 1997. Integrative models of nutrient balancing: application to insects and vertebrates.
Nutrition Research Reviews 10: 151–179.
Robertson HA, Baird K, Dowding JE, Elliott G, Hitchmough R, Miskelly C, McArthur N, O’Donnell CFJ, Sagar PM,
Scofield RP, Taylor GA 2017. Conservation status of New Zealand birds, 2016. New Zealand Threat Classification
Series 19. Wellington, New Zealand, Department of Conservation. 22 p.
Salamolard M, Butet A, Leroux A, Bretagnolle V 2000. Responses of an avian predator to variations in prey
density at a temperate latitude. Ecology 81: 2428–2441.
Seaton R 2007.The ecological requirements of the New Zealand falcon (Falco novaeseelandiae) in a plantation forest. Unpublished PhD thesis, Massey University, Palmerston North, New Zealand. 126 p.
Seaton R, Hyde N, Holland JD, Minot EO, Springett BP 2008. Breeding season diet and prey selection of the New Zealand falcon (Falco novaeseelandiae) in a plantation
forest. Journal of Raptor Research 42: 256–264.
Simpson SJ, Raubenheimer D 2012. The nature of nutrition: a unifying framework from animal adaptation to human obesity. Princeton, Princeton University Press. 248 p. Stanbury M, Briskie JV 2015. I smell a rat: can New Zealand
birds recognize the odor of an invasive mammalian
predator? Current Zoology 61: 34–41.
Steenhof K, Kochert MN 1988. Dietary responses of three raptor species to changing prey densities in a natural
environment. Journal of Animal Ecology 57: 37–48.
Towns DR, Daugherty CH, Cree A 2001. Raising the prospects for a forgotten fauna: a review of 10 years of conservation effort for New Zealand reptiles. Biological Conservation
99: 3–16.
Trewick SA, Olley L 2016. Spatial size dimorphism in
New Zealand’s last endemic raptor, the kārearea Falco novaeseelandiae, coincides with a narrow sea strait. Ibis
158: 747–761.
Wiehn J, Korpimäki E 1997. Food limitation on brood size:
experimental evidence in the Eurasian kestrel. Ecology
78: 2043–2050.
Wilson KJ 2004. Flight of the huia: ecology and conservation of New Zealand’s frogs, reptiles, birds and mammals. Christchurch, New Zealand, Canterbury University Press. 412 p.
Zoratto F, Carere C, Chiarotti F, Santucci D, Alleva E 2010. Aerial hunting behaviour and predation success by peregrine falcons Falco peregrinus on starling flocks
Sturnus vulgaris. Journal of Avian Biology 41: 427–433.
Editorial board member: Deb Wilson