Testing models for equilibrium distribution and abundance of insects
John M. Kean
AgResearch, P.O. Box 60, Lincoln, New Zealand (E-mail: [email protected])
____________________________________________________________________________________________________________________________________
Abstract: The Kean–Barlow model predicts how the equilibrium distribution and abundance of a population may be affected by local rates of increase, dispersal, colonisation, and extinction. Here, the model is parameterised for three insects: the Glanville fritillary Melitaea cinxia in Åland, Finland, the ribbonwood aphid
Paradoxaphis plagianthi in Christchurch, New Zealand, and the coxella weevil Hadramphus spinipennis in the Chatham Islands, New Zealand. The model was modified for the weevil to accommodate its unusual habit of overexploiting local resources. For the butterfly and the weevil, parameters estimated from the literature suggest high patch occupancy with low to moderate relative local population sizes. For the aphid, the model suggested low distribution and abundance. These predictions appear to match field observations, at least qualitatively, suggesting that the model captures sufficient biological detail to be a valid tool for exploring the relative effects of population-level processes on rarity and commonness.
____________________________________________________________________________________________________________________________________
Keywords: Rarity; dispersal; metapopulation dynamics; Melitaea cinxia; Paradoxaphis plagianthi; Hadramphus spinipennis.
New Zealand Journal of Ecology (2006) 30(1): 53-60 ©New Zealand Ecological Society Published on-line: 20 February 2006
Introduction
In the paradoxical words of Brian McArdle (1990, p. 276), “Rare species are very common”. This is true at both the community level, where the “mystery of singletons” is well recognised (Novotný and Basset, 2000), and on a landscape scale, where frequency histograms of species in terms of their global distribution or total numbers tend to be skewed towards the low end, with most species having low overall distribution or abundance (Gaston, 1994). Nevertheless, ecological theory has been built largely on observations of common species (Andrewartha and Birch, 1954), since these are generally easier to find and study, and are often of economic importance as pests.
Recently, however, rarity has become a subject for research in its own right (e.g. Rabinowitz, 1981; Gaston, 1994), with the predominant approach being to compare the biological characteristics of rare species with those of common relatives (e.g. Hodgson, 1993; Kunin and Gaston, 1997). This method leads to an interesting list of correlates to rarity, but it cannot on its own distinguish the mechanistic causes of rarity. Kean and Barlow (2004) suggested an alternative, based on a simple population model for local increase within habitat patches, coupled with local extinction and recolonisation between patches. The model predicts how each of seven general population parameters, including the local rates of increase, dispersal, and extinction, may affect the equilibrium distribution and relative abundance of a population within a mosaic of
habitat patches. Based on their equilibria, populations may be classified as: (1) common, if both distribution and local abundance are high; (2) localised, if distribution is narrow but local abundance is high where present; (3) sparse, if distribution is wide but local abundance is low; and (4) scarce, if both distribution and abundance are low. The latter three may be considered types of rarity (Rabinowitz, 1981). The strengths of the Kean–Barlow model lie in its simplicity and objectivity. Each of the seven model parameters is biologically meaningful and measurable, and the assessment of whether a species is rare or not is made relative to the capacity of its environment rather than to an arbitrary set of other species. The weaknesses of the Kean–Barlow approach are that not all parameters may be easy to measure, conclusions may be too general to usefully inform management of a particular species, and the model has yet to be validated against a range of real populations. This contribution addresses the latter, using three well-studied insect species.
Methods
Kean–Barlow model for distribution and abundance
(2) (1) habitat patches. The distribution may then be quantified as the proportion of available habitat patches that are occupied, P, while abundance is measured as the mean local population size where present, N, relative to the patch carrying capacity, K. Both P and N/K are values between 0 and 1, and provide a simple way of quantifying rarity: species with high N/K and P being designated common; those with high N/K but low P
being localised; species with low N/K and high P being sparse; and those with low N/K and low P designated scarce (Kean and Barlow, 2004).
The model assumes that local populations increase independently and asynchronously from each other, but are linked loosely through dispersal. Occupied patches become empty through exogenous extinction events, with empty patches being colonised by randomly searching dispersers from occupied patches. The model is
where r is the intrinsic rate of local population increase,
v2 is the squared coefficient of variation between local
population sizes, m is the dispersal rate, α is the survival rate of dispersers, c measures colonisation ability as the rate of successful establishment per immigration event, and ε is the density-independent local extinction rate. It should be emphasised that the model is not intended for simulation of a particular system, but rather as a mean field approximation for the average interactions within and between a series of local populations. Hence, the variation in local population sizes, an emergent property of real metapopulations, is here regarded as a constant model parameter v2 arising from the averaging process together
with Taylor’s power law, as described by Kean and Barlow (2004). Similarly, several of the other model parameters represent the aggregated effects of lower-level population processes such as births, deaths, and dispersal.
The model may be solved for its equilibrium solutions N*/K and P*, which arise at the intersection between the isoclines:
where f = m/r is the emigration rate relative to the maximum rate of local increase, and g = ε/cαmK
represents potential patch turnover as the extinction
rate of an occupied patch relative to the maximum colonisation rate of an empty patch. Exploring the effects of the parameters on the equilibrium abundance and patch occupancy led Kean and Barlow (2004) to infer some of the ecological circumstances that predispose species to rarity or commonness. The robustness of these conclusions depends on how well the model captures relevant population-level processes. By parameterising, and where necessary modifying, the model for some well-studied insects, its predictions can be validated against field results to help assess the usefulness of the model as a tool for understanding rarity and commonness.
Species modelled
Glanville fritillary
The Glanville fritillary butterfly, Melitaea cinxia, has been extensively studied across the Åland Archipelago in western Finland. Hanski et al. (1994) presented detailed data for a 50-patch metapopulation of
M. cinxia studied in 1991–92. Mean estimated adult population size in 1991 across the 42 occupied patches was N = 239, with a squared coefficient of variation
v2 = 2.18. Of these, five had no larvae present the following spring, but only three had no adult butterflies when resurveyed subsequently in late summer, possibly because of adult dispersal immediately prior to the survey. The extinction rate of occupied patches can therefore be estimated at 3/42 to 5/42, or approximately 0.1 yr-1.
Mark-recapture results from the same study suggested that the proportion of adults emigrating from a patch over a 9- to 16-day period (the longest span over which reliable estimates were possible) was 0.47 for males and 0.74 for females, suggesting m = 0.6 yr-1 on average. A similar mark-recapture study of the
same species in a different patch network estimated an emigration rate of 0.4 (Kuussaari et al., 1996), but this is likely to be an underestimate since a large proportion of the marked individuals (53% of males and 64% of females) disappeared, most likely through migration and subsequent mortality. This rate of disappearance does, however, allow us to estimate dispersal survival
(1994) assumed r = 2.0 yr-1, based on that measured for
the closely related marsh fritillary, Mellicta athalia
(Warren, 1991).
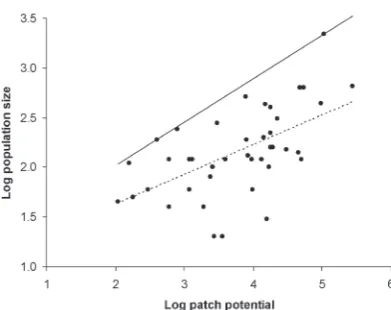
Estimating K for this system is difficult since habitat patches vary in both size and quality, and extinction/recolonisation dynamics mean that observed local population sizes do not necessarily reflect their local potential. The 1991 data for the 50-patch metapopulation (Hanski et al., 1994) show a highly significant relationship between local butterfly population size and “patch potential”, given by patch area multiplied by an index of quality (Fig. 1). A line was fitted to the observed maxima, since this gives the best estimate of patch carrying capacities. This result suggests that populations in large, good-quality patches are no more likely to be close to K than those in small, poor patches, which is consistent with the model’s assumption that local extinctions are independent of population size or quality. The fitted function was applied to each of the 50 patches, and the results averaged to estimate the mean local carrying capacity as K = 724 for this metapopulation.
Ribbonwood aphid
The indigenous New Zealand ribbonwood aphid (Paradoxaphis plagianthi Eastop) lives year-round on the leaves and flower buds of the lowland ribbonwood tree, Plagianthus regius. Although its host is common throughout New Zealand, the aphid is known only from small stands of remnant lowland forest in the centre of Christchurch city (Kean, 2002). Within this Figure 1. Relationship between local population size and patch potential (patch area multiplied by quality) for M. cinxia in a 50-patch metapopulation (data from Hanski et al., 1994). Dotted line shows regression model fit (y = 0.300x + 1.025, d.f. = 41, R2 = 0.32, P < 0.001); solid line is fitted through the
observed maxima (y = 0.437x + 1.143).
habitat, only a few small colonies have been observed at any one time, with the aphid absent from many apparently suitable hosts. Furthermore, when present, local populations occupy only a small proportion of the available and apparently suitable leaves (Kean and Stufkens, 2005), with no apparent differences in distribution from ground level to canopy (Marlon Stufkens, Crop & Food Research, Lincoln, N.Z., pers. comm.).
Field populations of the ribbonwood aphid have been monitored in some detail, allowing the model parameters to be estimated. The observed exponential rate of colony growth in spring (Fig. 2) was 0.024 in 1999 and 0.015 in 2000 (Kean and Stufkens, 2005), suggesting r = 0.02 day-1 on average. Field densities varied considerably, but consistently, throughout the year (Kean, 2002; Kean and Stufkens, 2005), probably reflecting seasonal changes in host plant quality, which can be regarded as setting the carrying capacity, K. A weighted seasonal mean was estimated as shown in Figure 2, suggesting K = 261 for this colony. At any one time, the largest number of local aphid colonies known was 11, on 22 February 2000, with sizes 1, 1, 1, 1, 2, 3, 8, 11, 16, 23, and 53, suggesting v2 = 1.9.
Dispersal rate, m, was estimated by noting that, on average throughout the year, 29% of fourth instar nymphs in field populations were winged (Kean, 2002). Since the rate of production of adults is r, the rate of production of alatae (winged adults) may be estimated as m = 0.29r = 0.0057 day-1. This assumes that all alatae disperse, but is reasonable given that very few were observed in the aphid colonies. To estimate Figure 2. Temporal dynamics of a P. plagianthi subpopulation (shaded area), with exponential spring increase (solid lines: in 1999, log N = 0.90 + 0.024t, R2 = 0.97; in 2000, log N = 1.63
+ 0.015t, R2 = 0.99, where t is time in days), and estimated
(5) (4) dispersal survival, α, it was first necessary to calculate
approximately how many alates were produced in a field colony over the course of a year. While it was not possible to count them directly, since they tend to fly away, it was possible to infer them from knowledge of winged fourth instar numbers and their development time. Total nymphal development is split fairly evenly into four instars, and requires 212 degree days above a lower threshold of 5°C (Kean and Stufkens, 2005). Temperature in the field during the time of peak alate production in spring 2000 rarely dropped below the 5°C threshold, and the 11.6°C mean suggests a fourth instar development time of around 8 days. The area under the curve of winged fourth instar density over time was 707.5 for 2000, suggesting that 707.5/8 = 88 alates were produced. During this season, 10 new colonies were observed in the vicinity of the main colony (Kean, 2002), therefore dispersal survival may be estimated as α = 10/88 = 0.11. Of these 10 new colonies, only two survived to produce dispersers of their own, with the remainder going extinct at only one or two aphids (Kean, 2002). The probability of successful colonisation may be estimated directly, therefore, as c = 2/10 = 0.2. Conversely, the extinction rate may be estimated as the inverse of mean persistence time for the three colonies for which this is known (Kean, 2002): ε = 3/(489+92+40) = 0.005 /day.
Coxella weevil
The coxella weevil (Hadramphus spinipennis Broun) is confined to two small islands in the Chatham group, New Zealand, where its host plant, Dieffenbach’s speargrass Aciphylla dieffenbachii, is patchily distributed (Schöps, 2000). Weevil and host are classified as endangered and threatened, respectively, but management is complicated by the fact that weevil populations tend to overexploit their local resources causing the death of host plants and collapse of their habitat patch; weevils subsequently disperse up to 500 m to new patches (Schöps, 2002). Since both patch extinction rate and dispersal rate are dependent on local density, the model of Equation 1 must be modified. By assuming that the risk of extinction increases as the local population approaches its carrying capacity, then the extinction parameter ε may be replaced by ε′ × N/K. An implicit assumption is that for each habitat patch destroyed, another one becomes available through recruitment of seedlings. The dispersal rate is scaled in the same way as extinction, by replacing m with m′ × N/K, and the model becomes
The equilibrium model isoclines are now given by
where f′ = m′/r, and g′ = ε′/cαm′K and the equilibrium itself is
It can be shown that this equilibrium is stable and ecologically realistic only if αfg′ ≤ 1, α(1-g′) – v2/f≤
1, and g′(1+v2+f) ≤ 1.
For the coxella weevil, mark-recapture experiments conducted across three summers (Schöps, 2002) suggested an average annual finite rate of increase of 1.97 in rapidly increasing local populations. The intrinsic rate of increase may be estimated as the natural log of the mean finite rate of increase: r = ln(1.97) = 0.68 yr-1. In the same study it was noted that
once weevil densities exceed 18 per plant then overexploitation occurs and the resource inevitably collapses (Schöps, 2002). This suggests that the probability of extinction becomes unity when the carrying capacity is exceeded, and ε′ = 1. Nevertheless, weevils did not disperse immediately on reaching this density, but remained and continued to increase until only a small piece of stem remained on each plant, with up to 55 weevils clustered on it (Schöps, 2000). This suggests that the density-dependent dispersal parameter
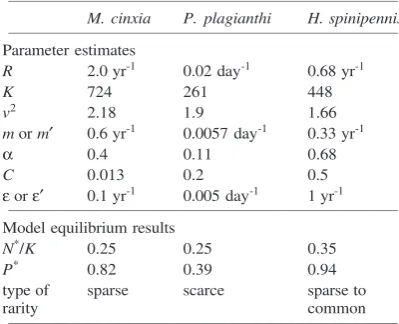
Table 1. Parameter values estimated for the case study species, and model equilibrium results.
_______________________________________________________________
M. cinxia P. plagianthi H. spinipennis _______________________________________________________________
Parameter estimates
R 2.0 yr-1 0.02 day-1 0.68 yr-1
K 724 261 448
v2 2.18 1.9 1.66
m or m′ 0.6 yr-1 0.0057 day-1 0.33 yr-1
α 0.4 0.11 0.68
C 0.013 0.2 0.5
ε or ε′ 0.1 yr-1 0.005 day-1 1 yr-1 _______________________________________________________________
Model equilibrium results
N*/K 0.25 0.25 0.35
P* 0.82 0.39 0.94
type of sparse scarce sparse to
rarity common
_______________________________________________________________
may be estimated as m′ = 18/55 = 0.33.
Despite being flightless, dispersing weevils were observed to travel up to 500 m to new habitat patches, and 68% of weevils released 100 m from the nearest host plants were later recovered from hosts (Schöps, 2000), suggesting dispersal survival is at least α = 0.68. Colonisation ability appears to be high, but in the absence of data we follow Hanski and Thomas (1994) who assumed that half of the immigrants into an empty patch are mated females, hence c = 0.5.
Johst and Schöps (2003) estimated the carrying capacity of each of the habitat patches present on Mangere Island, suggesting a mean of K = 448. Since no information is available on the variability in weevil subpopulation sizes, it is assumed to be similar to that
for the patch carrying capacities reported by Johst and Schöps (2003), suggesting v2 = 1.66. Given the
subjectivity and uncertainty around several of the parameter estimates for this and the other case study species, sensitivity analyses were carried out to determine how much influence these have on the model outcomes. The parameter values derived for each of the three case studies are listed in Table 1.
Results
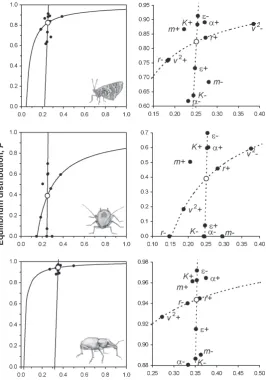
The results from estimating the model parameters for each of the case study insects are shown in Table 1 and Figure 3. The model equilibrium for M. cinxia suggests
Figure 3. Results from
high patch occupancy but low relative local abundance, and this was in close agreement with the actual values of N/K = 239/724 = 0.33 and P = 42/50 = 0.84 observed in the field in 1991 (Hanski et al., 1994). The result was reasonably robust to substantial (± 50%) variation in the model parameters, with the greatest effect arising from decreases in dispersal survival α, local carrying capacity K, colonisation ability c, dispersal rate m, or heterogeneity, v2 (Fig. 3).
For P. plagianthi, the model suggested low equilibrium occupancy and relative abundance, and the result was sensitive to variation in the parameter values. The model suggested that 50% reductions in the intrinsic rate of increase r, local carrying capacity
K, colonisation ability c, dispersal survival α, of dispersal rate m would eventually lead to extinction, while an equivalent decrease in local extinction rate ε would lead to a more widespread equilibrium population.
In contrast, the model for H. spinipennis suggested a wide distribution across habitat patches and moderate local abundance, with this result being very robust. Equilibrium occupancy and relative abundance was insensitive to the local rate of increase r, and affected little by ±50% changes in any of the other parameters. The greatest effect arose from reducing heterogeneity
v2, leading to increased relative abundance.
Discussion
Kean and Barlow (2004) used their model to suggest what combination of population-level characteristics might predispose a species to a certain pattern of distribution and abundance. For M. cinxia, the model predictions of N*/K = 0.25 and P* = 0.82 appear to conform well with the actual values N*/K = 0.33 and
P* = 0.84 observed in the field, despite there being some evidence that the metapopulation may not be at equilibrium (Hanski et al., 1995). This comparison may be criticised on the grounds that the test was not completely independent since the estimation of model parameter c relied on the patch occupancy and local abundance observed in the field. However, the other six model parameters were estimated independently (though some indirectly from the same survey results) and sensitivity analysis suggested that the qualitative pattern of wide distribution and low relative local abundance was unaffected by substantial variation in the parameter estimates.
The same “sparse” pattern (Kean and Barlow, 2004) arises from the H. spinipennis model, though in this case the population equilibrium might even be classified as “common”. Superficially, this might seem counter-intuitive for a species considered endangered by the New Zealand Department of Conservation
(Schöps, 2000), but the threat to the species is mainly perceived to be its very restricted natural range, being only two small rodent-free islands. Within those islands, however, the weevil is abundant (Schöps, 2000). This issue highlights the problems of unambiguously defining terms such as “rare” and “common”, which have plagued ecology and hampered the development of robust theory. Rabinowitz (1981) made a major contribution by breaking “rarity” into a number of more specific types, and Kean and Barlow (2004) carried this further by suggesting how rarity might be quantified. The crux of the problem is that “rare” is a relative term: species may be rare in comparison with other species (Gaston, 1994), or compared with the capacity of their environment. The latter approach, embodied in the Kean–Barlow model, relies on the capacity of the environment being measurable, by defining suitable habitat patches and estimating the carrying capacity K of each. The current exercise has shown how difficult that can be, even for relatively well-studied species. As well as K, the occupancy and abundance predicted by the model for each of the case study species was sensitive to v2, which will be heavily
influenced by the variation in size and quality of habitat patches. These difficulties help re-emphasise that the Kean–Barlow model is inappropriate for predicting specific solutions, with its value being rather as a tool for exploring the relative importance of population phenomena leading to particular patterns of occupancy and abundance.
The particular example of H. spinipennis also brings up the issue of populations affecting the availability or quality of their resources. The impacts of populations on their resources are well recognised in multi-trophic level studies, and exploited by biological control practitioners. H. spinipennis is perhaps unusual in the degree to which the resource is affected, with whole patches of host plants being destroyed, but the affect of a population on its resource makes it even more challenging to estimate the carrying capacity except by direct experimentation. Further developments on the population dynamics of rarity would benefit from consideration of population– resource interactions in more detail than the models discussed here.
Kindlmann (1990) suggested that aphid densities might be determined partly by the abundance of their host plants in the landscape, mediated through dispersal mortality. If so, this might help to explain why
P. plagianthi has not been found in other lowland forests, where a lower abundance of host trees might lead to even lower survival of dispersers in this weakly-flying species.
The sensitivity analysis suggested that
P. plagianthi might be strongly affected by changes in its environment, with 50% reductions in any of local rate of increase r, dispersal rate m, carrying capacity K, survival on dispersal a, or colonisation ability c leading to overall extinction (Fig. 3). This should be of particular concern given the very restricted known range of this species. Conversely, the model suggests that a decrease in local extinction rate e or increases in K, c, or α might substantially increase patch occupancy. During 2000, an irrigation system was installed in Riccarton Bush, where this species is primarily found, and the model suggests that if this improves host tree quality or decreases local extinctions in the unfavourable summer months (Fig. 2) then there might be substantial benefits for the conservation of P. plagianthi. Conversely, the aphid may be vulnerable to habitat loss, as this would negatively affect several of the model parameters to which the species’ persistence is sensitive (Fig. 3). This contrasts with the other case study species, which may be better able to withstand some habitat loss, and emphasises the need for better understanding of the determinants of rarity in order to gauge the likely impacts of human-induced change on different species. In conclusion, the Kean–Barlow model suggests some insights into the population-level processes leading to the patterns of distribution and abundance seen in the three case study species. Parameterisation of the models was difficult in the absence of specially designed experiments, though sensitivity analyses suggested that the qualitative patterns suggested by the models were reasonably robust, at least for
M. cinxia and H. spinipennis. The model predictions gave a qualitative match with field observations for each species, suggesting that the underlying assumptions may be appropriate, though further tests are recommended. Finally, it should be emphasised that the Kean–Barlow model and its variants are formulated as general tools for exploring distribution and abundance as ecological phenomena, but are not appropriate for making management decisions for particular species. Despite some suggestive results, these models are no substitute for detailed ecological study of rare species together with careful population viability analyses. With further empirical examples it may become possible to conduct comparative analyses that relate the critical model parameters to particular trait complexes of species. Meanwhile the management
of particular rare species should be informed by targeted study and strategic modelling, as is exemplified by the work on M. cinxia by Hanski and colleagues (e.g. Hanski and Thomas, 1994; Hanski, 1999) or on
H. spinipennis by Johst and Schöps (2003).
Acknowledgements
This work would not have been possible without the guidance and inspiration of the late Nigel Barlow. Thanks also to John Parkes for organising the Barlow Symposium, where these ideas were aired, and to the anonymous referees who provided insightful feedback. Financial support was provided by the Marsden Fund.
References
Andrewartha, H.G.; Birch, L.C. 1954. The distribution and abundance of animals. University of Chicago Press, Chicago. 781 pp.
Dixon, A.F.G.; Kindlmann, P. 1990. Role of plant abundance in determining the abundance of herbivorous insects. Oecologia83: 281-283. Gaston, K.J. 1994. Rarity. Population and Community
Biology Series No. 13, Chapman & Hall, London, U.K. 205 pp.
Hanski, I. 1999. Metapopulation Ecology. Oxford Series in Ecology and Evolution, Oxford University Press, Oxford. 313 pp.
Hanski, I.; Thomas, C.D. 1994. Metapopulation dynamics and conservation: a spatially explicit model applied to butterflies. Biological Conservation68: 167-180.
Hanski, I.; Kuussaari, M.; Nieminen, M. 1994. Metapopulation structure and migration in the butterfly Melitaea cinxia. Ecology75: 747-762. Hanski, I.; Pakkala, T.; Kuussaari, M.; Lei, G.-C.
1995. Metapopulation persistence of an endangered butterfly in a fragmented landscape.
Oikos72: 21-28.
Hodgson, J.G. 1993. Commonness and rarity in British butterflies. Journal of Applied Ecology30: 407-427.
Johst, K.; Schöps, K. 2003. Persistence and conservation of a consumer-resource metapopulation with local overexploitation of resources. Biological Conservation109: 57-65. Kean, J.M. 2002. Population patterns of Paradoxaphis
plagianthi, a rare New Zealand aphid. New Zealand Journal of Ecology26: 171-176.
Kean, J.M.; Barlow, N.D. 2004. Exploring rarity using a general model for distribution and abundance.
American Naturalist163: 407-416.
population ecology, and rarity of the New Zealand ribbonwood aphid, Paradoxaphis plagianthi. New Zealand Journal of Zoology32: 143-153. Kunin, W.E.; Gaston, K.J. 1997 (Editor). The biology
of rarity. Chapman & Hall, London, U.K. 280 pp. Kuussaari, M.; Nieminen, M.; Hanski, I. 1996. An experimental study of migration in the Glanville fritillary butterfly Melitaea cinxia. Journal of Animal Ecology65: 791-801.
McArdle, B.H. 1990. When are rare species not there?
Oikos57: 276-277.
Novotný, V.; Basset, Y. 2000. Rare species in communities of tropical insect herbivores: pondering the mystery of singletons. Oikos89:
564-572.
Rabinowitz, D. 1981. Seven forms of rarity. In: Synge, H. (Editor), The biological aspects of rare plant conservation, pp. 205-217. John Wiley, Chichester, U.K.
Schöps, K. 2000. Metapopulation dynamics of the coxella weevil (Hadramphus spinipennis) on the Chatham Islands. Science for Conservation134:
1-37.
Schöps, K. 2002. Local and regional dynamics of a specialist herbivore: overexploitation of a patchily distributed host plant. Oecologia132: 256-263. Warren, M.S. 1991. The successful conservation of an
endangered species, the heath fritillary butterfly,