R E S E A R C H A R T I C L E
Open Access
A cross sectional study on the different
domains of frailty for independent living
older adults
Didi Verver
1*, Hanneke Merten
1, Carolien de Blok
2and Cordula Wagner
1,3Abstract
Background:With the ageing population, there is a stronger focus on supporting older people to live
independently as long as possible. One of the important factors to take into consideration for independent living older adults is frailty. This manuscript aims to provide insight into the relation between the different domains of frailty (physical, social and psychological or a combination), health outcomes and wellbeing aspects for
independent living older adults.
Methods:This cross sectional community-based study included independent living older adults of 65 years and over who are member of a welfare organisation.The questionnaire contained items on background characteristics, health, quality of life, frailty (Tilburg Frailty Indicator), activities and loneliness. A multivariate analysis, one Way ANOVA’s and chi-square tests with post-hoc analyses were used to identify significant differences between the following outcomes: Age, gender, marital status, living situation, income, health perception, number of conditions, activities of daily living, home care and informal care, Quality of life, loneliness, going outside, meeting people and the different domains of frailty.
Results:1768 (35.1%) participants completed the questionnaire. 68.9% of the respondents was frail on one or multiple domains and 51.6% of the respondents was frail based on the total score on the TFI. Social frailty (18.4%) was most often present followed by 10.3% for frailty on all three domains of the TFI. All variables tested, except for income, showed significant differences between the different domains of frailty.
Conclusion:Distinguishing the different domains of frailty provides information about the older adult’s needs which is valuable for policymakers and care providers, to anticipate to the increasing number of independent living older adults and deliver them tailored care and support to contribute to their independent living situation and wellbeing.
Keywords:Frailty, Older adults, Independent living, Ageing in place, Policy
Background
The population is ageing worldwide and people live
lon-ger in good health [1, 2]. Also, the proportion of people
over 80 years old is rising [3]. These changes may threaten the sustainability of welfare systems of western countries. As a result, many western countries adopted
some form of,‘ageing in place’ policy [4, 5], aiming to
prolong the independent living status of older adults at
home instead of institutionalisation. A recent study in the USA found that support for aging in place for the home care population can measurably delay nursing home admission by 8 months [6]. This policy is mainly performed to limit health and social care costs, however, older people also mainly prefer to age in place [7,8].
This is also the case for the Netherlands. The Dutch
government has decided to focus on enhancing
self-sufficiency and independent living as long as pos-sible, which leads to more independent living frail older adults, and as a consequence potential complex care sit-uations in their home setting [9]. In addition, many of * Correspondence:d.verver@vumc.nl
1Amsterdam Public Health research institute, Department of public and occupational health, VU University Medical Center, Van der Boechorststraat 7, 1081, BT, Amsterdam, the Netherlands
Full list of author information is available at the end of the article
the responsibilities to support these independent living older adults have been shifted to the municipalities since January 2015. An important assumption for this decision is that municipalities should be more capable to address needs and wishes of independent living people on the local level, and they are better able to organize the needed care and support [10]. The changes in life ex-pectancy, living situations and responsibilities make it important for municipalities, and other policy making agencies, to anticipate to the health and wellbeing situ-ation of their frail older inhabitants, so they can offer sufficient care and support.
Frail older adults have an increased risk for negative health outcomes like mortality, morbidity and admission to a hospital or nursing home [11]. These risks contrib-ute to the rising healthcare costs and have a negative im-pact on the quality of life of the older adults and their potential to live independently [12]. In total, the
Netherlands had 16,574.989 inhabitants of which
2538.328 were 65 years or older in 2010 [13] There were 690.000 frail adults of 65 years and older in the Netherlands in 2010 according to the Netherlands Insti-tute for Social Research (SCP), a proportion of 27%. Most of them, between 500.000 and 600.000, lived
inde-pendently, the remaining 90.000–190.000 lived in an
institution. The SCP expects an increase in the number of frail older adults in the Netherlands between 2010 and 2030 from almost 690.000 up to more than one mil-lion [14], which will cause an increase in the care and support needed for this group to enable them to live independently.
A number of frailty assessment tools have been devel-oped in the past years, the majority of these tools in-clude only items on physical frailty characteristics [15]. The Frailty Index [16], the Groningen Frailty Indicator [17], the Tilburg Frailty Indicator (TFI) [18] and the Ed-monton Frail Scale [19] are examples of tools which do include the different domains. According to a recent study by Roppolo et al.(2015) different instruments based on different conceptualizations of frailty detect different individuals as frail. However, they state that a multidimensional tool would be better able to detect in-dividuals at risk for negative health outcomes [20]. Also a study by Khezrian endorses frailty tools which provide a composite measure of frailty [21]. The definition of frailty, as presented by the SCP [14], also emphasizes the focus on the accumulation of problems on the different domains, the physical, psychological and social domain are all likely to be key issues. Complex interactions in these domains may contribute to the degree of frailty in an individual. To enable integrated and seamless care it is important to pay attention to the individual as a whole and take all three domains into account. This also fits the movement of positive health by Machteld Huber
[22] and the definition of the World Health
Organization (WHO), which defines health as‘a state of
complete physical, mental, and social well-being and not
merely the absence of disease or infirmity’ [23]. This
paper adds to the knowledge of which variables may contribute to the different domains of frailty, since the association between lifestyle factors and frailty is not a well-studied topic [24].
The increase of independent living frail older adults and changes in government and municipality responsi-bilities for supporting them, make it important for muni-cipalities, policymakers and care and welfare providers to assess important characteristics, health outcomes and wellbeing aspects of this population to offer them tai-lored support in care and wellbeing within the home situation. This paper aims to provide insight into the re-lation between these characteristics and different do-mains of frailty.
Methods
Design and setting
This manuscript displays and discusses the baseline data
of a quantitative evaluation study ‘Home Sweet Home’.
The Home Sweet Home project was executed by ‘WonenPlus’, a collective name for multiple welfare orga-nizations which deliver support to independent living older adults in different regions of the province of North-Holland in the Netherlands. This project was fi-nanced through the National Care for the Elderly Programme of The Netherlands Organization for Health Research and Development (ZonMw), which was de-signed to improve care for older people with complex care needs. The Amsterdam Public Health research in-stitute /VUmc evaluated this project. Activities of the WonenPlus organizations aim to contribute to the well-being and support of independent living older adults and other people with mental or physical disabilities. The study aimed to compare the standard reactive method to an adjusted method which proactively approached independent living older adults to offer
them support. With the reactive method, the
organization provided help and support only when the older adult asked for support. With the proactive method employees and volunteers reached out to the older adults, who already were a member of the
‘WonenPlus organization’, and offered their help and
support.
Data for the current study on the baseline measure-ment was collected between January 2011 and April 2012 using paper-based quantitative questionnaires.
Questions from the ‘The Older Persons and Informal
Caregivers Survey Minimum DataSet’ (TOPICS-MDS)
questionnaire so one questionnaire could be used. The TOPICS-MDS contains questions about health, multi morbidity, quality of life and care usage. The aspects of health of interest for this manuscript were; health perception, number of conditions and ADL problems. Next to the TOPICS-MDS, complementary questions were added to the questionnaire about
so-cial contacts, loneliness [26, 27], frailty [18] and other
topics. The questionnaire was developed for this study, using validated questionnaires and additional
questions. See Additional file 1 for the additional
questions.
Owing to privacy reasons, questionnaires were sent to potential participants, who were a member of the Wonen-Plus organization, by the WonenWonen-Plus organizations and they collected the data. After deleting all possible partici-pant identifiers by the WonenPlus organizations the an-onymous questionnaires were handed over to the researchers.
Inclusion criteria
In this study, we defined independent living as follows: older adults who either lived alone, with their spouse or other relatives in their own home. Older adults living in sheltered accommodation or housing designed for older people with on-call staff were excluded from the defin-ition independent living. Participants had to be 65 years or older, able to give informed consent, live independ-ently and be a member of a WonenPlus organization in a rural or urban environment. All members of 65 years and older registered in seven different WonenPlus-client databases were asked to participate in the study, which were 5026 older adults in total.
At the baseline measurement the response for partici-pation was 35.1%; 1768 older adults completed the ques-tionnaire and gave written informed consent. 1085 (61.4%) completed the questionnaire independently and 604 (34,2%) respondents had some kind of help with fill-ing out the questionnaire, of 75 (4.5%) respondents this item was missing. Reasons for non-response are not available, since data was collected by the Wonenplus or-ganizations and follow-up on the non-response by the researchers was not possible due to privacy reasons.
Frailty, Tilburg Frailty Indicator (TFI)
The SCP (2011) describes frailty as follows: “A process
of an accumulation of physical, psychological and/or so-cial deficits in functioning which increases the chance of adverse health outcomes (functional disabilities,
admis-sion to an institution, death)” [14]. The TFI of Gobbens
et al. (2010) is an instrument to operationalize and measure frailty. This instrument distinguishes different domains of frailty, namely; physical, psychological and
social [18,28]. In this study the TFI was used to assess
frailty, using 15 items concerning frailty. Scores on the different domains were counted as follows: a score of 4 or higher on the eight items of physical frailty was assessed as physically frail. A score of two or higher on the four items of psychological frailty was assessed as psychologically frail. A score of two or higher on the three items of social frailty were assessed as socially frail [14]. The total score on the TFI was calculated to deter-mine overall frailty; a score of five or higher was classi-fied as being frail [18]. The psychometric properties of the TFI have been established by the developers of this questionnaire, the internal consistency was measured as
Cronbach’s α= 0.73, indicating moderate internal
consistency [18,29]. In the current study, it was decided
that when an item on the TFI was missing, it was counted as ‘0’, so it would not contribute to the degree of frailty, but overall scores on the different domains and a total score could be calculated for all respondents. This decision was taken since the number of missing values for items three up to eight in the TFI was exten-sive, but the respondents appeared to only have
an-swered the question when their answer was ‘yes’
(contributing towards frailty) and left it blank when their answer was‘no’(not contributing to frailty). The number of missing values was analysed using frequencies and a missing value analysis on different items was performed. Missing values were imputed and the imputed data was compared to the original data. These steps will be fur-ther explained in the section on the statistical analyses.
Health aspects
The following aspects of health were analysed:
Health perceptionis analysed in three categories; excellent/very good, good and reasonable/bad
Number of conditions;ranging from zero up to eleven. The participants were asked to check the box when they had one or more of the following diseases or conditions in the past 12 months: diabetes, stroke, heart failure, cancer, asthma or other lung problems, incontinence, joint wear, depression, anxiety or panic disorder, dementia, hearing problems and vision problems.
Activities of daily living (ADL), KATZ
Home care and informal care
Usage of home care and informal care were analysed using the following questions at which the respondents could answer‘yes’or‘no’:
‘Do you use home care? For example, a district nurse or help at home‘
‘Do you have someone who voluntarily helps or supports you for a longer period of time? (informal care provider)’
Wellbeing aspects
The following aspects of wellbeing were analysed:
Quality of life,the respondents graded their quality of life and compared to a year ago (much better, little better, the same, little worse, much worse).
Loneliness,loneliness was assessed using the loneliness scale of de Jong-Gierveld with a 3-point likert scale and a reliability of Cronbach’sα= 0.80 up to 0.90 [27]. The loneliness scale has 11 items and a total score on the 11 items was calculated, analyses were done with the total score as continuous variable. When two or more items were missing, the respondents were left out of the analyses. To create the imputed data file loneliness was used as a categorical variable to lower the number of parameters; not lonely (score 0, 1 or 2), moderate lonely (score 3 through 8), severe lonely (score 9 or 10), and very severe lonely (score 11).
Going outside;daily, few times per week, few times per month, less than once a month
Meeting the children, grandchildren, family, friends and neighbours;every week, once or twice per month, less/seldom, never, not applicable
Statistical analysis
IBM SPSS (SPSS Inc., Chicago, Illinois) version 22.0 was used to analyse the data. Descriptive statistics were used to calculate frequencies on the different domains of frailty. Because of the large amount of missing data for the TFI items 3,4,5,6,7 and 8 it was decided to conduct a missing value analysis, using Multiple Imputation in SPSS, to analyse the potential overlap in answers on
re-lated variables. Little’s Missing Completely at Random
(MCAR) Test was used to check whether the data was missing randomly. Values for respondents who answered ‘no’,‘yes’ and missing on these items of the TFI were
compared on the following variables: Age, gender and TOPICS-MDS data on frailty.
As a second step to analyse the potential consequences of the missing data on items 3 through 8 on the TFI, it was decided to impute the data to compare the results of the original data and the imputed data. Variables used to create the imputed data file were: 15 TFI items, age (continuous), gender (male/female), marital status (mar-ried/other) and loneliness (not, moderate, serious, very serious). Marital status and loneliness were dichoto-mized respectively categorized to lower the number of parameters to be able to create the imputed data. The highest percentage of missing was 25.8, which resulted in 26 imputations with 100 iterations.
A multiple regression analysis was performed to deter-mine which variables contribute to the total score of frailty. The following variables were used in this analysis: age, gender, marital status, living situation, income, health perception, number of conditions, ADL problems, home care and informal care. Dummy variables were created for categorical variables.
To assess significant differences between the different domains of frailty a one way ANOVA test was used for the continuous variables. For the variables ADL, number of conditions, quality of life and loneliness, the variances within the different groups were not equal according to
Levene’s test of homogeneity of variances. However,
be-cause of the large sample size, Bonferroni post hoc ana-lyses were used to identify the significant differences between the subgroups.
Chi square tests were done for the dichotomous and categorical variables. Post hoc analyses, using the stan-dardized residuals, were done to show whether the ob-served results per subgroup differed from the expected. When the standardized residual differed more than 2 or
−2 from the expected, it was designated as different
from the expected [31]. P-values lower than 0.05 were
considered as significant.
Results
Missing value analysis
The missing value analysis showed that the respondents with missing values on items three up to eight were more often female and their mean age lied between the mean age of the respondents who answered‘yes’and‘no’
on those items. Also, the frailty score of the
TOPICS-MDS was calculated to compare the results with the TFI. For respondents who had missing values for TFI items three up to eight, it was assessed whether they were frail according to the frailty index of TOPICS-MDS 0.20. On all six items, there were no sub-stantial differences on the percentage of frail
Missing Completely at Random (MCAR) Test showed
that the missing values were at random (p= .685).
Additional file2 shows the scores on the items of the
TFI for the original and imputed data. Also, the different domains of frailty are shown: physical, psychological, so-cial and the possible combinations of these. For the im-puted data, the scores on the physical domain of frailty increased substantially when compared to the original dataset and as a result of that the total score on frailty also increased. When relating these results to the out-comes of the missing value analysis the imputed data ap-pear to overestimate the scores on frailty and therefore also the number of frail respondents. In addition,
Additional file 2 shows that physical frailty would
in-crease when using the imputed data, but still social frailty and frailty on all domains would remain the most often identified forms of frailty. Based on these findings, it was decided to use the original dataset for analyses, to prevent the risk of overestimating the outcomes on the physical domain and frailty in total.
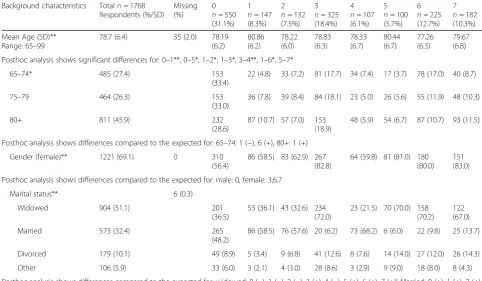
Background characteristics
The mean age of the 1768 respondents was 78.7 years (SD = 6.4) and a large proportion was female (69.1%). More than half of the respondents was widowed (51.1%) followed by the married respondents (32.4%). The ma-jority of the respondents lived independently and alone
(65.1%). Background characteristics are shown in Table2,
including an overview of the different domains of frailty.
Frailty
In total, 51.6% of the respondents was frail according to
the TFI. Table 1 shows data of the original dataset.
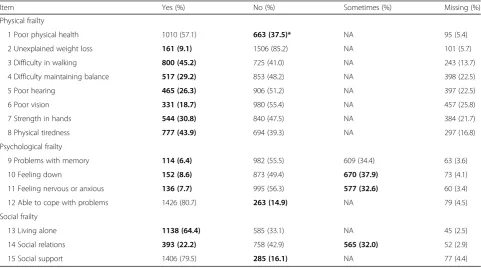
68.9% was frail on one or multiple domains and 31.1% was not frail at all. The type of frailty most often present among the respondents was social frailty (18.4%) and frailty on all domains (10.3%).
The results of the multivariate analysis of the health aspects show that the following aspects significantly con-tribute to the total score of the TFI: living independent alone (+), health perception very good/excellent (−), health perception good (−), home care (+), ADL score (+), number of conditions (+).
Next, statistical analyses were performed to test for potential differences between the health and wellbeing variables [age, gender, marital status, living situation, in-come, health perception, number of conditions, ADL problems, home care, informal care, quality of life, lone-liness, going outside, meeting the children and grand-children, meeting the family and in-laws, meeting friends, meeting neighbours] and the domains of frailty.
All tested variables (shown in Tables2and3), except for
income, showed significant differences for either the ex-pected values or differences between the subgroups of frailty.
The overall analysis on age groups and the domains of frailty showed a significant difference for the different
domains of frailty (p = 0.001). Physical frailty was more
often present in the higher age group (80+) and less in
Table 1Scores and missing values on the frailty items in the original data
Item Yes (%) No (%) Sometimes (%) Missing (%)
Physical frailty
1 Poor physical health 1010 (57.1) 663 (37.5)* NA 95 (5.4)
2 Unexplained weight loss 161 (9.1) 1506 (85.2) NA 101 (5.7)
3 Difficulty in walking 800 (45.2) 725 (41.0) NA 243 (13.7)
4 Difficulty maintaining balance 517 (29.2) 853 (48.2) NA 398 (22.5)
5 Poor hearing 465 (26.3) 906 (51.2) NA 397 (22.5)
6 Poor vision 331 (18.7) 980 (55.4) NA 457 (25.8)
7 Strength in hands 544 (30.8) 840 (47.5) NA 384 (21.7)
8 Physical tiredness 777 (43.9) 694 (39.3) NA 297 (16.8)
Psychological frailty
9 Problems with memory 114 (6.4) 982 (55.5) 609 (34.4) 63 (3.6)
10 Feeling down 152 (8.6) 873 (49.4) 670 (37.9) 73 (4.1)
11 Feeling nervous or anxious 136 (7.7) 995 (56.3) 577 (32.6) 60 (3.4)
12 Able to cope with problems 1426 (80.7) 263 (14.9) NA 79 (4.5)
Social frailty
13 Living alone 1138 (64.4) 585 (33.1) NA 45 (2.5)
14 Social relations 393 (22.2) 758 (42.9) 565 (32.0) 52 (2.9)
15 Social support 1406 (79.5) 285 (16.1) NA 77 (4.4)
Table 2Analyses on background characteristics for different domains of frailty
Background characteristics Totaln= 1768 Respondents (%/SD)
Missing (%)
0 n= 550 (31.1%)
1 n= 147 (8.3%)
2 n= 132 (7.5%)
3 n= 325 (18.4%)
4 n= 107 (6.1%)
5 n= 100 (5.7%)
6 n= 225 (12.7%)
7 n= 182 (10.3%)
Mean Age (SD)** Range: 65–99
78.7 (6.4) 35 (2.0) 78.19 (6.2)
80.86 (6.2)
78.22 (6.0)
78.83 (6.3)
78.33 (6.7)
80.44 (6.7)
77.26 (6.3)
79.67 (6.8)
Posthoc analysis shows significant differences for: 0–1**, 0–5*, 1–2*, 1–3*, 3–4**, 1–6*, 5–7*
65–74* 485 (27.4) 153
(33.4)
22 (4.8) 33 (7.2) 81 (17.7) 34 (7.4) 17 (3.7) 78 (17.0) 40 (8.7)
75–79 464 (26.3) 153
(33.0)
36 (7.8) 39 (8.4) 84 (18.1) 23 (5.0) 26 (5.6) 55 (11.9) 48 (10.3)
80+ 811 (45.9) 232
(28.6)
87 (10.7) 57 (7.0) 153 (18.9)
48 (5.9) 54 (6.7) 87 (10.7) 93 (11.5)
Posthoc analysis shows differences compared to the expected for: 65–74: 1 (−), 6 (+), 80+: 1 (+)
Gender (female)** 1221 (69.1) 0 310
(56.4)
86 (58.5) 83 (62.9) 267 (82.8)
64 (59.8) 81 (81.0) 180 (80.0)
151 (83.0)
Posthoc analysis shows differences compared to the expected for: male: 0, female: 3,6,7
Marital status** 6 (0.3)
Widowed 904 (51.1) 201
(36.5)
53 (36.1) 43 (32.6) 234 (72.0)
23 (21.5) 70 (70.0) 158 (70.2)
122 (67.0)
Married 573 (32.4) 265
(48.2)
86 (58.5) 76 (57.6) 20 (6.2) 73 (68.2) 6 (6.0) 22 (9.8) 25 (13.7)
Divorced 179 (10.1) 49 (8.9) 5 (3.4) 9 (6.8) 41 (12.6) 8 (7.6) 14 (14.0) 27 (12.0) 26 (14.3)
Other 106 (5.9) 33 (6.0) 3 (2.1) 4 (3.0) 28 (8.6) 3 (2.9) 9 (9.0) 18 (8.0) 8 (4.3)
Posthoc analysis shows differences compared to the expected for: widowed: 0 (−), 1 (−), 2 (−), 3 (+), 4 (−), 5 (+), 6 (+), 7 (+)| Married: 0 (+), 1 (+), 2 (+), 3 (−), 4 (+), 5 (−), 6 (−), 7(−) | Divorced: 1 (−) | other 1 (−)
Living situation**a 12 (0.7)
Independentalone 1151 (65.1) 262
(47.6)
56 (38.1) 50 (37.9) 309 (95.1)
31 (29.0) 93 (93.0) 201 (89.3)
149 (81.9)
Independentwith others
579 (32.7) 280
(50.9)
85 (57.8) 79 (59.8) 14 (4.3) 76 (71.0) 5 (5.0) 19 (8.4) 21 (11.5)
Independent living with possible assistance
25 (1.4) 5 (0.9) 5 (3.4) 1 (0.8) 0 0 2 (2.0) 3 (1.3) 10 (5.5)
Posthoc analysis shows differences compared to the expected for: Independent alone: 0 (−), 1 (−), 2 (−), 3 (+), 4 (−), 5 (+), 6 (+), 7(+) | Independent with others: 0 (+), 1 (+), 2 (+), 3 (−), 4 (+), 5 (−), 6 (−), 7 (−)
Income (Lower than
€1200 net per month)
598 (33.8) 137 (7.7) 160 (29.1)
44 (29.9) 40 (30.3) 120 (36.9)
43 (40.2) 40 (40) 76 (33.8) 75 (41.2)
Health perception** 8 (0.5)
Excellent/very good 219 (12.4) 121 (22) 2 (1.4) 11 (15.6) 62 (19) 0 3 (3) 19 (8.4) 1 (0.5)
Good 611 (34.6) 247
(44.9)
36 (24.5) 57 (43.2) 145 (44.6)
11 (10.3) 17 (17) 81 (36) 17 (9.3)
Reasonable/bad 930 (52.6) 178
(32.4) 108 (73.5)
64 (48.5) 117 (36) 95 (88.8) 80 (80) 124 (55.2)
164 (90.1)
Posthoc analysis shows differences compared to the expected for: excellent very good: 0 (+), 1 (−), 3 (−), 4 (−), 5 (−), 7 (−) | good: 0 (+), 1 (−), 3 (+), 4 (−), 5 (−), 7 (−) | reasonable/bad: 0 (−), 1 (+), 3 (−), 4 (+), 5 (+), 7 (+)
Number of conditions** (Range: 0–11)
2.61 (1.85) Unknown 1.9 (1.4) 3.6 (1.7) 2.3 (1.5) 1.9 (1.3) 4.1 (1.8) 3.6 (1.8) 2.3 (1.6) 4.5 (2.0)
Posthoc analysis shows significant differences for: 0–1**, 0–4**, 0–5**, 0–6*, 0–7**, 1–2**, 1–3**, 1–6**, 1–7**, 2–4**, 2–5**, 2–7**, 3–4**, 3–5**, 3–6*, 3–7**, 4–6**, 5–6**, 5–7**, 6–7**
ADL problems (Range: 0– 15)**
2.2 (2.5) 51 (2.9) 1.08 (1.7) 4.0 (3.2) 1.6 (2.0) 1.3 (1.5) 4.9 (3.3) 3.5 (2.1) 1.6 (1.7) 4.1 (2.6)
Posthoc analysis shows significant differences for: 0–1*, 0–4**, 0–5**, 0–7**, 1–2**, 1–3**, 1–4*, 1–6**, 2–4**, 2–5**, 2–7**, 3–4**, 3–5**, 3–7**, 4– 5**,4–6**, 5–6**, 6–7**
the lower age group (65–74). This increase by age was not seen for other domains of frailty.
The overall analysis for gender in relation to the ent domains of frailty also showed a significant differ-ence (p < 0.001); the physically, psychologically-socially and all-domains frail respondents were more often fe-male (82.8, 80.0 and 83.0%) and the non-frail were more often male (43.6%). Related to this, the marital status also significantly differed for the different domains of frailty (p< 0.001). The percentage widowed respondents was higher for respondents who were frail on the do-mains social, physical-social, psychological-social and on all domains.
Health and care
There was a significant difference between the categories of frailty and the perceived health by the respondents (p < 0.001). The health perception for the socially frail was higher and the health perception for the physically, physically-psychologically, physically-socially and all-domains frail respondents was lower.
The overall analysis shows significant differences for
the mean number of conditions (p < 0.001) and the
mean number of ADL problems (p< 0.001) between the
subgroups of frailty. The largest differences for the num-ber of conditions was seen between the subgroups non-frail versus frail on all domains (MD = -2.66,
p < 0.001) and socially frail versus frail on all domains (MD = -2.7, p < 0.001).
The largest mean difference for ADL problems was found for non-frail versus physically-psychologically frail
(MD =−3.8, p < 0.001), socially versus
psychologically frail (MD = -3.5, p < 0.001), physically-psychologically frail versus physically-psychologically-socially frail (MD = 3.3, p < 0.001), physically-psychologically frail ver-sus psychologically frail (MD = 3.3, p < 0.001). This shows that physical frailty was more associated with the number of ADL problems compared to the other do-mains of frailty.
There was a significant difference between the categor-ies of frailty and the use of home care (p< 0.001). The respondents who were frail on the domains physical, physical-psychological, physical-social and on all do-mains used this type of care significantly more than expected.
In total, 360 respondents (20.4%) had an informal care provider. There was a significant difference for the over-all analysis of having an informal care provider and the frailty categories (p< 0.001). Respondents who were frail on the domains physical, physical-psychological and all domains had an informal care provider more often. The non-frail, socially frail and psychologically-socially frail respondents had an informal care provider less often.
Wellbeing
Table 3 shows aspects of wellbeing for the different
do-mains of frailty. The overall test for quality of life shows significant differences between the categories of frailty
(p < 0.001). Quality of life was the highest for the
non-frail (mean = 7.9, SD = 0.87) and lowest for the re-spondents who were frail on all domains (mean = 6.2, SD = 1.2) (MD = -1.72, p < 0.001). All different domains have a significantly lower quality of life grade compared to the non-frail respondents.
The total loneliness instrument was completed by 1551 (87.7%) respondents. 22.1% scored 0 points on the loneliness instrument and 5.2% scored the total 11 points. The mean score for loneliness was 3.86 (SD = 3.5). Respondents who were frail on all domains had the highest average score on loneliness (7.1, SD = 3.0), followed by psychologically frail and socially frail respondents (6.9, SD = 3.4) and physically-socially frail respondents (5.2, SD = 3.2). Loneliness was lowest for the non-frail (mean = 1.7, SD = 3.0). The overall ana-lysis showed a significant difference between these sub-groups (p< 0.001).
The number of times respondents went outside was analysed and the overall test shows that there was a sig-nificant difference for the different domains of frailty
Table 2Analyses on background characteristics for different domains of frailty(Continued)
Background characteristics Totaln= 1768 Respondents (%/SD)
Missing (%)
0 n= 550 (31.1%)
1 n= 147 (8.3%)
2 n= 132 (7.5%)
3 n= 325 (18.4%)
4 n= 107 (6.1%)
5 n= 100 (5.7%)
6 n= 225 (12.7%)
7 n= 182 (10.3%)
Home care** 762 (43.1) 23 (1.4) 145
(26.4)
82 (55.8) 43 (32.6) 129 (39.7)
66 (61.7) 71 (71.0) 90 (40.0) 136 (74.7)
Posthoc analysis shows differences compared to the expected for: 0 (−), 1 (+), 4 (+), 5 (+), 7 (+)
Informal care** 360 (20.4) 28 (2.9) 74 (13.5) 63 (42.9) 25 (18.9) 35 (10.8) 49 (45.8) 25 (25) 22 (9.8) 67 (36.8)
Posthoc analysis shows differences compared to the expected for: 0 (−), 1 (+), 3 (−), 4 (+), 6 (−), 7 (+)
Not frail for all domains (0), Physical frail (1), psychological frail (2), social frail (3), Physical and psychological (4), Physical and social (5), Psychological and social (6), Frail on all three domains (7)
a
The group‘Independent living with possible assistance’has been left out of the analysis because the group was too small *Analysis shows a significance between 0,05-0,001
Table 3Analyses on wellbeing aspects for different domains of frailty
Wellbeing Totaln= 1768 Respondents (%/SD)
Missing (%)
0 n= 550 (31.1%)
1 n= 147 (8.3%)
2 n= 132 (7.5%)
3 n= 325 (18.4%)
4 n= 107 (6.1%)
5 n= 100 (5.7%)
6 n= 225 (12.7%)
7 n= 182 (10.3%)
Quality of life
Grade (SD)b 7.3 (1.2) 30 (1.7) 7.9 (0.9) 7.3 (1.1) 7.2 (1.2) 7.6 (1.0) 6.5 (1.0) 7.1 (0.9) 6.8 (1.2) 6.2 (1.2)
Posthoc analysis shows significant differences for: 0–1b, 0–2b, 0–3b, 0–4b, 0–5b, 0–6b, 0–7b, 1–4b, 1–6b, 1–7b, 2–3a, 2–4b, 2–6a, 2–7b, 3–4b, 3–5b, 3–6b, 3–7b, 4–6a, 5–7b
Compared to one year agob 26 (1.5)
Much better 71 (4.0) 21 (3.8) 6 (4.1) 2 (1.5) 26 (8.0) 1 (0.9) 5 (5.) 7 (3.1) 3 (1.6)
Little better 127 (7.2) 29 (5.3) 8 (5.4) 10 (7.6) 25 (7.7) 8 (7.5) 5 (5) 23 (10.2) 19 (10.4)
the same 1105 (62.5) 430 (78.2) 80 (54.4) 81 (61.4) 226 (69.5) 42 (39.3) 57 (57) 134 (59.6) 55 (30.2)
Little worse 374 (21.2) 60 (10.9) 45 (30.6) 35 (26.5) 4 (13.5) 40 (37.4) 27 (27) 45 (20.0) 78 (42.9)
Much worse 65 (3.7) 2 (0.4) 6 (4.1) 3 (2.3) 1 (0.3) 14 (13.1) 5 (5) 8 (3.6) 26 (14.3)
Posthoc analysis shows differences compared to the expected for: much better: 3 (+) | the same: 0 (+), 4 (−), 7(−) | little worse: 0 (−), 1 (+), 3 (−), 4 (+), 7 (+) | much worse: 0 (−), 3 (−), 4 (+), 7 (+)
Lonelinessb Range: 0–11
3.9 (3.5) 217
(12.3)
1.7 (2.1) 2.3 (2.6) 3.1 (3.1) 4.2 (3.2) 4 (3.7) 5.2 (3.2) 6.9 (3.7) 7.1 (3)
Posthoc analysis shows significant differences for: 0–2b, 0–3b, 0–4b, 0–5b, 0–6b, 0–7b, 1–3b, 1–4b, 1–5b, 1–6b, 1–7b, 2–3a, 2–4b, 2–7b, 3–6b, 3–7b, 4–6b, 4–7b, 5–6b, 5–7b
Going outsideb 57 (3.3)
Daily 917 (51.9) 360 (65.5) 49 (33.3) 65 (49.2) 181 (55.7) 39 (36.4) 35 (35) 132 (58.7) 56 (30.8)
Few times per week
619 (35.0) 128 (23.3) 67 (45.6) 55 (41.7) 128 (39.4) 45 (42.1) 49 (49) 71 (31.6) 76 (41.8)
Few times per month
113 (6.4) 17 (3.1) 21 (14.3) 7 (5.3) 8 (2.5) 12 (11.2) 8 (8) 12 (5.3) 28 (15.4)
Less than once a month
62 (3.5) 7 (1.3) 9 (6.1) 3 (2.3) 1 (0.3) 10 (9.3) 7 (7) 6 (2.7) 19 (10.4)
Posthoc analysis shows differences compared to the expected for: daily: 0 (+), 1 (−), 4 (−), 5 (−), 7 (−) | few times per week: 0 (−), 1 (+), 5 (+) | few times per month: 0 (−), 1 (+), 3 (−), 7 (+) | less than once a month: 0 (−), 4 (+), 7 (+)
How often do you meet…
Children or grandchildrena 228 (12.9)
Every week 771 (43.6) 256 (46.5) 78 (53.1) 53 (40.2) 136 (41.8) 54 (50.5) 37 (37) 84 (37.3) 73 (40.1)
Once or twice per month
399 (22.6) 119 (13.5) 31 (21) 38 (18.8) 72 (22.1) 22 (20.6) 28 (28) 47 (20.9) 45 (14.7)
Less/seldom 161 (9.1) 33 (4.2) 12 (8.1) 13 (9.8) 32 (9.9) 15 (14) 10 (10) 27 (12) 19 (10.4)
Never 57 (3.2) 13 (2.4) 5 (3.4) 3 (2.3) 10 (3.1) 5 (4.7) 4 (4) 9 (4) 8 (4.4)
Not applicable 152 (8.6) 42 (7.6) 8 (5.4) 7 (5.3) 33 (10.2) 8 (7.5) 15 (15) 29 (12.9) 10 (5.5)
Posthoc analysis shows differences compared to the expected for: less/seldom: 0 (−) | not applicable: 6 (+)
Family/in-lawsb 314
(17.8)
Every week 289 (16.3) 109 (19.8) 25 (17) 13 (9.8) 62 (19.1) 20 (18.7) 12 (12) 29 (12.9) 19 (10.4)
Once or twice per month
371 (21.0) 122 (22.2) 39 (26.6) 35 (26.5) 58 (17.8) 22 (20.5) 19 (19) 39 (17.3) 37 (20.3)
Less/seldom 410 (23.2) 99 (18) 35 (23.8) 35 (27.1) 72 (22.2) 28 (26.2) 30 (30) 63 (28) 48 (26.4)
Never 177 (10.0) 44 (8) 10 (6.8) 4 (3) 31 (9.5) 14 (13.1) 17 (17) 30 (13.3) 27 (14.8)
Not applicable 207 (11.7) 63 (11.5) 25 (17) 17 (12.9) 40 (12.3) 13 (12.1) 9 (9) 21 (9.3) 19 (10.4)
Posthoc analysis shows differences compared to the expected for: every week: 0 (+), 7 (−) | less /seldom: 0 (−) | never: 2 (−), 5 (+), 7 (+)
Friendsb 172
(p < 0.001). Respondents who were physically-psychologically frail and respondents who were frail on all
domains scored significantly higher on the category“
com-ing outside less than once a month”.
The overall analysis for the different types of contact all show significant differences for the different domains
of frailty; namely contact with (grand)children
(p= 0.035), family/in-laws (p< 0.001), friends (p< 0.001) and neighbours (p< 0.001).
The psychologically-socially frail respondents more often do not have children and grandchildren compared to all other domains.
Discussion
Results of this study complement the existing literature on frailty since it distinguishes the different domains of frailty and relate it to potential variables. More older adults will have to live independently and be self-sufficient. Therefore, it is important to offer sufficient care and support to adequately assist the independent living situation. Assessing frailty for the different do-mains provides insight into different needs, which is im-portant for policymakers and care providers.
Our results show that care and wellbeing characteris-tics are related to the domains of frailty. The proportion of frailty increases when looking at the different domains compared to the total TFI score. These results support the results of a study by Oostrom et al. in 2017; they
state that it is important to consider the different do-mains since this helps to identify different groups of frail people, and therefore enables professionals to provide tailored care and support [32]. In our study 68.9% of the respondents was frail on one or multiple domains. This proportion was higher compared to the proportion of frail respondents on the total TFI score (51.6%) because the score for social (two or three) or psychological frailty (two, three or four) was lower than the overall score for frailty (five). Implicating that it is important to not only look at the total frailty score but to take the different do-mains into account as well, with a focus on social frailty (18.4%) and frailty on all three domains (10.3%), since these were most often present. A study by Gobbens and van Assen also emphasizes the necessity to use a multi-dimensional approach. They implicate that problems with walking, feeling down and a lack of social support are important factors that influence the quality of life in older adults, and quality of life in older persons is associ-ated with frailty [33].
Physical frailty is the only domain that showed an as-sociation with the different age groups and increases with age. Other research supports this finding [34]. This implies that psychological and social frailty may have a different onset and pattern of development than physical frailty and support may be needed at a specific time in the lives of the older adults. Social frailty may, for ex-ample, occur after a big life event such as the loss of a
Table 3Analyses on wellbeing aspects for different domains of frailty(Continued)
Wellbeing Totaln= 1768 Respondents (%/SD)
Missing (%)
0 n= 550 (31.1%)
1 n= 147 (8.3%)
2 n= 132 (7.5%)
3 n= 325 (18.4%)
4 n= 107 (6.1%)
5 n= 100 (5.7%)
6 n= 225 (12.7%)
7 n= 182 (10.3%)
Every week 728 (41.2) 259 (47.1) 67 (45.6) 50 (37.9) 143 (44) 39 (36.4) 33 (33) 90 (40) 47 (25.8)
Once or twice per month
506 (28.6) 147 (26.8) 44 (30) 42 (31.8) 94 (28.9) 33 (30.9) 31 (31) 62 (27.1) 53 (29.1)
Less/seldom 264 (15.0) 59 (10.8) 16 (10.9) 21 (15.9) 35 (10.7) 27 (23.4) 27 (27) 38 (16.8) 41 (22.5)
Never 64 (3.6) 7 (1.3) 5 (3.4) 3 (2.3) 13 (4) 3 (2.8) 6 (6) 8 (3.6) 19 (10.4)
Not applicable 34 (1.9) (71.3) 6 (4.1) 2 (1.5) 6 (1.8) 3 (2.8) 0 4 (1.8) 6 (6.3)
Posthoc analysis shows differences compared to the expected for: every week: 0 (+), 7 (−) | less/seldom: 0 (−), 4 (+), 5 (+) | never: 0 (−), 7 (+)
Neighboursb 144
(8.1)
Every week 1006 (56.9) 375 (68.2) 87 (59.2) 74 (56.1) 181 (55.7) 51 (47.7) 47 (47) 116 (51.6) 75 (41.2)
Once or twice per month
298 (16.8) 67 (12.2) 27 (18.4) 24 (18.1) 67 (20.3) 22 (20.6) 20 (20) 24 (15.1) 38 (20.9)
Less/seldom 218 (12.3) 32 (5.6) 17 (11.6) 17 (12.9) 37 (11.4) 23 21.5) 17 (17) 43 (19.1) 32 (17.6)
Never 80 (4.5) 8 (1.5) 7 (4.8) 2 (1.5) 8 (2.5) 8 (7.5) 11 (11) 14 (6.2) 22 (12.1)
Not applicable 22 (1.2) 8 (1.5) 2 (1.4) 1 (0.8) 5 (1.5) 1 (0.9) 2 (2) 1 (0.4) 2 (1.1)
Posthoc analysis shows differences compared to the expected for: every week: 0 (+), 7 (−) | once or twice per month: 0 (−) | less/seldom: 0 (−), 4 (+), 5 (+), 7 (+) | never: 0 (−), 5 (+), 7 (+)
Not frail for all domains (0), Physical frail (1), psychological frail (2), social frail (3), Physical and psychological (4), Physical and social (5), Psychological and social (6), Frail on all three domains (7)
a
Analysis shows a significance between 0,05-0,001
b
spouse.‘Living alone’is one of the items for social frailty and may explain this association. Different studies indi-cate that frailty increases with age [11,35]. However, our study, that of Gobbens et al. [28] and van Assen et al. [34] suggest that this is mainly explained by physical frailty. However, as discussed in the introduction, health is no longer just the absence of diseases, it is seen as a state of complete wellbeing on different domains. Frailty in one of the three domains may jeopardize the health status of an older adult and therefore it is important to include all three domains.
Also, physical frailty and combinations with physical frailty show associations mainly on the health aspects. When offering care and support to the frail older adults, this is an important insight to consider since the needs for psychologically and socially frail older adults may be less focussed on care than for those who are only physic-ally frail. For physical frailty it seems more likely that care is needed to provide support, for example in the ADL-activities. For the socially frail, it can be hypothe-sized that social support, for example in the form of ac-tivities and contacts by a volunteer, is needed to increase their wellbeing.
The proportion of frailty based on the total TFI score (five or higher) was high (51.6%). This possibly could be explained by the fact that respondents already were a member of a welfare organization and therefore in need of more support. However, when looking at the mean age (78.7 SD = 6.4) the proportion of frailty closely matches that of the SCP study [14] for respondents of 80 years and older (50%). A slightly larger sample of fe-male respondents (69.1%) could explain the remaining difference, since women tend to be frail more often than men [36]; in 2012 65% of people over 80 was female in the Netherlands [37].
Strengths and limitations
A large amount (n = 1768) of older adults was reached
for this baseline measurement, even though the response rate was only moderate with 35,1%. The questionnaire contained many topics and many variables were tested to gain an overall view of the individual status of the re-spondent. Also, where possible, validated tools were used to measure the outcomes.
Unfortunately, data on the TFI items showed a signifi-cant number of missing values. A possible explanation could be that items three up to eight of the TFI were presented in a different way than the other items and re-spondents only checked a box when their answer was ‘yes’. In addition, a large part of the respondents filled in the questionnaire by themselves, missing data was more often present for those respondents. Data was therefore imputed and compared to the original data which showed an increase in physical frailty and domains
combined with physical frailty. Because of this and the results of the missing value analysis, it was decided to analyse the data using the original data to prevent an overestimation of frailty. Nevertheless, it should be taken into account that the original data could have shown an underestimation for the proportion of frailty and espe-cially on the domain of physical frailty.
Respondents were recruited via a welfare organisation in the province of North-Holland in the Netherlands. This sample may be specific since these older adults are already registered with a welfare organization, and may be in need of welfare and support. However, it is unlikely that this will affect the main message of this paper, being that it is important to look at the different domains of frailty to provide tailored care and support instead of looking at frailty in general. Nevertheless, when consid-ering generalising the data these differences should be taken into account. However, the data and numbers of frailty in the current study generally match the data of the SCP study in which national data of the Netherlands was used [14].
Reasons for non-responding are not available to the researchers. For privacy reasons the welfare organiza-tions contacted the older adults instead of the re-searchers and reasons for not participating could not be identified. This may have led to some information bias since reasons and characteristics of the non-responders are unknown.
Recommendations
With the rising number of frail independent living older adults and policy focussed on self-sufficiency and inde-pendent living it is important to assess the frail older adults and their care and support needs on an individual basis. Data of this study show that a distinction between the different domains of frailty may provide valuable in-formation about the characteristics for these different domains and what type of care or support is needed in each domain respectively. Our findings support other studies which emphasize the need to use multidimen-sional tools to improve wellbeing of the older adults and the quality of their care and support [32,33]. Further re-search is recommended to assess specific care and/or support needs and wishes for the different domains.
local governments to incorporate the social and physical domain, therefore they have to integrate their activities with those of care and welfare organizations, clients and housing cooperatives in order to appropriately support the older adults in living independent as long as possible while maintaining health and wellbeing.
Conclusion
Distinguishing the three different domains of frailty pro-vides information which is valuable for policymakers and care providers, to anticipate to the increasing number of independent living older adults and deliver them tailored care and support to contribute to their independent liv-ing situation and wellbeliv-ing.
Additional files
Additional file 1:Complementary questions. (DOCX 15 kb)
Additional file 2:Table with frailty scores for original and imputed data.
(DOCX 15 kb)
Abbreviations
ADL:Activities of daily living; MCAR: Missing Completely at Random;
MD: Mean difference; SCP: Netherlands Institute for Social Research; TFI: Tilburg Frailty Indicator; Topics-MDS: The older persons and informal caregivers survey minimum dataset; VUmc: Vrije Universiteit (Medical Center); WHO: World Health Organization; ZonMw: Netherlands Organization for Health Research and Development
Acknowledgements
We thank all the respondents and the involved organisations of WonenPlus NH for the data collection of the study.
Funding
This study was funded by The Netherlands Organization for Health Research and Development (Dutch acronym: ZonMw), within the National Care for the Elderly Programme with award number 31.309.0401.
Availability of data and materials
The datasets used and/or analyzed during the current study are available from the corresponding author on reasonable request.
Authors’contributions
DV has written the manuscript and analyzed the data. HM was involved in the execution of the study and has critically reviewed this manuscript. CdB critically reviewed this manuscript. CW was involved in the design of the study and critically revised the manuscript for important intellectual content. All authors read and approved the final manuscript.
Ethics approval and consent to participate
The study was approved by the Medical Ethical review committee of the VU University Medical Centre. The older adults in this study signed an informed consent form before inclusion took place. All questionnaires gathered were only used for this study and were processed separately from participant identifiers to protect the privacy and confidentiality of the participants within this study.
Consent for publication Not applicable.
Competing interests
The authors declare that they have no competing interests.
Publisher’s Note
Springer Nature remains neutral with regard to jurisdictional claims in published maps and institutional affiliations.
Author details
1Amsterdam Public Health research institute, Department of public and occupational health, VU University Medical Center, Van der Boechorststraat 7, 1081, BT, Amsterdam, the Netherlands.2Rekenkamer Metropool Amsterdam, Weesperstraat 105a, 1000, AE, Amsterdam, the Netherlands.3The Netherlands Institute for Health Services Research (NIVEL), Otterstraat 118-124, 3513, CR, Utrecht, the Netherlands.
Received: 19 June 2018 Accepted: 19 February 2019
References
1. Bruggink J-W. Trends in healthy life expectancy [original title in Dutch:
trends in gezonde levensverwachting]. TSG: tijdschrift voor gezondheidswetenschappen. 2009;87(5):209.
2. Kinsella KG, Phillips DR. Global aging: the challenge of success. Washington:
Population reference bureau; 2005;60(1).
3. United Nations, Department of Economic and Social Affairs, Population
Division (2017). World Population Ageing 2017 (ST/ESA/SER.A/408).
4. Lui CW, Everingham JA, Warburton J, Cuthill M, Bartlett H. What makes a
community age-friendly: a review of international literature. Australas J
Ageing. 2009;28(3):116–21.
5. Means R. Safe as houses? Ageing in place and vulnerable older people in
the UK. Soc Policy Adm. 2007;41(1):65–85.
6. Young Y, Kalamaras J, Kelly L, Hornick D, Yucel R. Is aging in place delaying
nursing home admission? J Am Med Dir Assoc. 2015;16(10):900 e901–900. e906.
7. Gitlin LN. Conducting research on home environments: lessons learned and
new directions. The Gerontologist. 2003;43(5):628–37.
8. Oswald F, Wahl H-W. Housing and health in later life. Rev Environ Health.
2004;19(3–4):223–52.
9. Coalition agreement VVD and CDA: Freedom and responsibility [original
title in Dutch: Vrijheid en verantwoordelijkheid]. The Hague 2010.
10. Parliamentary Papers II 2013–2014, 30597, no. 280, p. 1.
11. Fried LP, Tangen CM, Walston J, Newman AB, Hirsch C, Gottdiener J,
Seeman T, Tracy R, Kop WJ, Burke G. Frailty in older adults evidence for a
phenotype. J Gerontol Ser A Biol Med Sci. 2001;56(3):M146–57.
12. Pel-Littel R, Schuurmans M, Emmelot-Vonk M, Verhaar H. Frailty: defining
and measuring of a concept. J Nutr Health Aging. 2009;13(4):390–4.
13. Statistics Netherlands: Population core numbers. The Hague/ Heerlen, the
Netherlands: Statistics Netherlands (CBS) 2010. Retrieved on may 16th2018.
14. van Campen C. Frail older adults [original title in Dutch: Kwetsbare
Ouderen]. Dutch Institute for Social Research (SCP). The Hague: SCP; 2011.
15. Sutton JL, Gould RL, Daley S, Coulson MC, Ward EV, Butler AM, Nunn SP,
Howard RJ. Psychometric properties of multicomponent tools designed to assess frailty in older adults: a systematic review. BMC Geriatr. 2016;16:55.
16. Mitnitski AB, Mogilner AJ, Rockwood K. Accumulation of deficits as a proxy
measure of aging. Sci World J. 2001;1:323–36.
17. Schuurmans H, Steverink N, Lindenberg S, Frieswijk N, Slaets JP. Old or frail:
what tells us more? J Gerontol Ser A Biol Med Sci. 2004;59(9):M962–5.
18. Gobbens RJ, van Assen MA, Luijkx KG, Wijnen-Sponselee MT, Schols JM. The
Tilburg frailty indicator: psychometric properties. J Am Med Dir Assoc. 2010;
11(5):344–55.
19. Rolfson DB, Majumdar SR, Tsuyuki RT, Tahir A, Rockwood K. Validity and
reliability of the Edmonton frail scale. Age Ageing. 2006;35(5):526–9.
20. Roppolo M, Mulasso A, Gobbens RJ, Mosso CO, Rabaglietti E. A comparison
between uni-and multidimensional frailty measures: prevalence, functional status, and relationships with disability. Clin Interv Aging. 2015;10:1669.
21. Mina Khezrian PKM, McNeil C, Murray AD. A review of frailty syndrome and
its physical, cognitive and emotional domains in the elderly. Geriatrics. 2017; 2(4):36.
22. Huber M, Knottnerus JA, Green L, van der Horst H, Jadad AR, Kromhout D,
Leonard B, Lorig K, Loureiro MI, van der Meer JW, et al. How should we define health? BMJ. 2011;343:d4163.
23. Preamble to the Constitution of the World Health Organization as adopted by
24. Mello Ade C, Engstrom EM, Alves LC. Health-related and socio-demographic factors associated with frailty in the elderly: a systematic literature review.
Cad Saude Publica. 2014;30(6):1143–68.
25. questionnaire available via: https://topics-mds.eu/wp-content/uploads/2014/
03/Baseline-Questionnaire_Participant.pdf
26. de Jong Gierveld J, van Tilburg T: Elaboration and definition of the concept
of loneliness. Backgrounds, causes and approaches [original title in Dutch: Uitwerking en definitie van het begrip eenzaamheid. Zicht op eenzaamheid:
achtergronden, oorzaken en aanpak] 2007:7–14.
27. De Jong G, van Tilburg T: Manual of the loneliness scale. Faculty of social
sciences Vrije Universiteit Amsterdam (Copia obtenida del autor) 1999.
28. Gobbens RJ, van Assen MA, Luijkx KG, Wijnen-Sponselee MT, Schols JM.
Determinants of frailty. J Am Med Dir Assoc. 2010;11(5):356–64.
29. Gobbens R, van Assen M: The Tilburg frailty Indicator, validity and reliability
[original title in Dutch: De Tilburg frailty Indicator: Validiteit en
betrouwbaarheid]. Tijdschrift voor Ouderengeneeskunde 2012, 37(2):75–79.
30. Laan W, Zuithoff N, Drubbel I, Bleijenberg N, Numans M, De Wit N,
Schuurmans M. Validity and reliability of the Katz-15 scale to measure unfavorable health outcomes in community-dwelling older people. J Nutr
Health Aging. 2014;18(9):848–54.
31. Omnibus test. Your Chi-Square test is statistically significant: now what?
Pract Assess Res Eval. 2015;20(8):2.
32. van Oostrom SH, van der AD, Rietman ML, Picavet HSJ, Lette M, Verschuren
WMM, de Bruin SR, Spijkerman AMW: A four-domain approach of frailty explored in the Doetinchem cohort study. BMC Geriatr 2017, 17(1):196.
33. Gobbens RJ, van Assen MA. The prediction of quality of life by physical,
psychological and social components of frailty in community-dwelling older
people. Qual Life Res. 2014;23(8):2289–300.
34. van Assen MALM, Pallast E, Fakiri FE, Gobbens RJJ. Measuring frailty in
Dutch community-dwelling older people: reference values of the Tilburg
frailty Indicator (TFI). Arch Gerontol Geriatr. 2016;67:120–9.
35. Rockwood K, Howlett SE, MacKnight C, Beattie BL, Bergman H, Hébert R,
Hogan DB, Wolfson C, McDowell I. Prevalence, attributes, and outcomes of fitness and frailty in community-dwelling older adults: report from the Canadian study of health and aging. J Gerontol Ser A Biol Med Sci. 2004;
59(12):1310–7.
36. Deeg DJ, Puts M. The frail succes of growing old. About frailty,
multimorbidity and limitations [original title in Dutch: Het kwetsbare succes van ouder worden. Over kwetsbaarheid, multimorbiditeit en beperkingen].
Tijdschr Verpleeghuisgeneeskd. 2007;32:147–51.
37. Statistics Netherlands: Population statistics. The Hague/ Heerlen, the