www.nat-hazards-earth-syst-sci.net/8/1403/2008/ © Author(s) 2008. This work is distributed under the Creative Commons Attribution 3.0 License.
Natural Hazards
and Earth
System Sciences
Influence of check dams on debris-flow run-out intensity
A. Remaˆıtre1, Th. W. J. van Asch2, J.-P. Malet1, and O. Maquaire3
1IPGS, CNRS UMR 7516, School and Observatory of Earth Sciences, University Louis Pasteur, Strasbourg, France 2Utrecht University, Faculty of Geosciences, Utrecht, The Netherlands
3GEOPHEN, CNRS UMR 6554, University of Caen Basse-Normandie, Caen, France
Received: 21 February 2008 – Revised: 31 October 2008 – Accepted: 13 November 2008 – Published: 12 December 2008
Abstract. Debris flows are very dangerous phenomena claiming thousands of lives and millions of Euros each year over the world. Disaster mitigation includes non-structural (hazard mapping, insurance policies), active struc-tural (drainage systems) and passive strucstruc-tural (check dams, stilling basins) countermeasures. Since over twenty years, many efforts are devoted by the scientific and engineering communities to the design of proper devices able to capture the debris-flow volume and/or break down the energy. If con-siderable theoretical and numerical work has been performed on the size, the shape and structure of check dams, allow-ing the definition of general design criteria, it is worth notallow-ing that less research has focused on the optimal location of these dams along the debris-flow pathway.
In this paper, a methodological framework is proposed to evaluate the influence of the number and the location of the check dams on the reduction of the debris-flow intensity (in term of flow thickness, flow velocity and volume). A debris-flow model is used to simulate the run-out of the de-bris flow. The model uses the Janbu force diagram to resolve the force equilibrium equations; a bingham fluid rheology is introduced and represents the resistance term. The model has been calibrated on two muddy debris-flow events that occurred in 1996 and 2003 at the Faucon watershed (South French Alps).
Influence of the check dams on the debris-flow intensity is quantified taking into account several check dams configura-tions (number and location) as input geometrical parameters. Results indicate that debris-flow intensity is decreasing with the distance between the source area and the first check dams. The study demonstrates that a small number of check dams located near the source area may decrease substantially the debris-flow intensity on the alluvial fans.
Correspondence to: A. Remaˆıtre
(alexandre.remaitre@eost.u-strasbg.fr)
1 Introduction
Debris flows are a common type of mass movement in moun-tainous areas; they consist of fully saturated mixtures of wa-ter, sediment and debris (Iverson, 1997) that can travel, in a series of surges, several kilometres. Debris flows are widely recognized as one of the dominant geomorphic processes in steep mountainous terrain (Pierson, 1980; Costa, 1984; John-son and Rodine, 1984; Takahashi, 1991; Scott et al., 1995; Corominas et al., 1996; Hungr et al., 2001; VanDine and Bo-vis, 2002; Godt adn Coe, 2007).
From a practical point of view, several analyses were con-ducted through a “temporal” approach to understand the trig-gering mechanisms and associated rainfall thresholds. These analyses were based on empirical hydrological correlations and pointed out a rather wide range of rainfall thresholds for several study areas (e.g. Campbell, 1974, 1975; Lumb, 1975; Okuda et al., 1980; Caine, 1980; Crozier and Eyles, 1980; Cannon and Ellen, 1985; Wieczorek, 1987). Other studies were conducted through a “spatial approach” in order to de-fine the areas which could potentially trigger a debris flow (the susceptibility) (Montgomery and Dietrich, 1994; Iovine et al., 2003; H¨urlimann et al., 2006; Guinau et al., 2007).
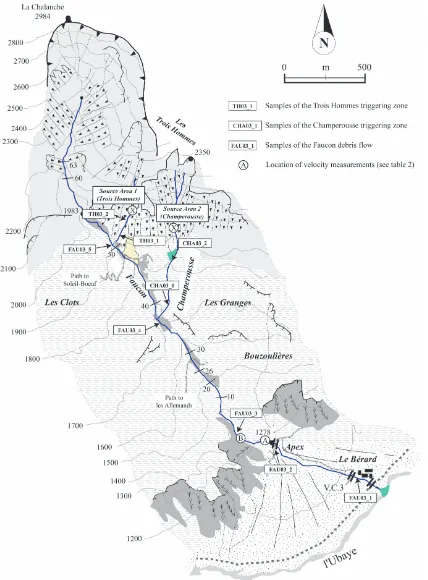
Fig. 1. Morphological sketch of the Faucon watershed (a), photograph of a concrete check dam (b), photograph of masonry check dam (c).
allowing the definition of general design criteria (Johnson and McCuen, 1989; Couvert et al., 1991; Armanini and Scot-ton, 1992; Deymier et al., 1994; Miyazawa et al., 2003), it is worth noting that less research has focused on the opti-mal number and location of these dams along the debris-flow pathway.
The aim of this paper is to analyse with a simple numerical model the effect of check dams on the debris-flow intensity (in terms of flow height, velocity and volume) according sev-eral configurations (number of check dams, location).
2 Description of the test site and characteristics of the 2003 debris flow
2.1 The Faucon torrent
chara-Fig. 2. GIS database of the Faucon torrent. (a) Torrential stretches
characteristics, (b) Morphology of the 2003 debris flow (height of deposits and scouring depth).
cterized by a sandy-silt matrix, may include boulders up to 1–2 m in size and are between 3 and 15 m thick. The in-cised channel has an average slope of about 20◦, ranging
from 35◦ in the headwater basin to 3◦ on the alluvial fan, and is approximately 5500 m in length. The Faucon torrent has formed a 2 km2debris-fan that spreads across the Ubaye valley floor. The fan slope gradient ranged from 4 to 9◦and is made mostly of cohesionless and high-permeable debris (debris-flows strata and/or torrent deposits).
Since 1850, fourteen major debris flows have occurred in the Faucon torrent. In order to prevent flooding, authorities have built a hundred check dams on the torrent since the 1890’s; but only a half of them are still efficient. Two main types of check dams can be observed: concrete check dams (Fig. 1b) and masonry check dams (Fig. 1c). The last major events occurred in 1996 (Remaˆıtre et al., 2005a, b) and
Fig. 3. Morphology of the scouring zones after the 2003 debris-flow
event at the Faucon torrent. (a) View of a scoured stretch, (b) View of a strong scouring at the toe of a check dam.
in 2003 (Remaˆıtre, 2006; Remaˆıtre et al., 2008). A GIS database of the check dams has been built. For each dam, several characteristics have been recorded like the type, the size, and the year of construction (Fig. 2a). A sample of the database is presented in Table 1; the complete database is available on request.
2.2 Kinematics of the 2003 debris flow
Table 1. Characteristics of the Faucon check dams before the 2003 debris flow.
N◦ Type Distance to Dam 1 Toe elevation Top elevation Height Width min. Width max. Status
(m) (m) (m) (m) (m) (m)
Table 1. Continued.
N◦ Type Distance to Dam 1 Toe elevation Top elevation Height Width min. Width max. Status
(m) (m) (m) (m) (m) (m)
56 Concrete 2658 1848 1852 3.40 5.00 15.50 Good 57 Concrete 2683 1851 1857 5.50 6.00 31.00 Good 58 Concrete 2806 1882 1886 3.90 5.00 12.00 Good 59 Concrete 2824 1887 1890 3.50 5.00 29.00 Good 60 Masonry 2870 1895 1895 0.00 25.00 25.00 Destroyed 61 Masonry 3114 1952 1954 3.00 6.00 15.00 Damaged 62 Masonry 3364 2031 2032 1.00 8.20 15.00 Damaged 63 Masonry 3383 2035 2035 0.00 8.50 12.00 Destroyed 64 Masonry 3454 2050 2051 1.00 9.00 18.50 Damaged 65 Masonry 3470 2053 2054 1.50 13.00 16.80 Damaged 66 Masonry 3544 2071 2074 2.00 3.50 3.50 Damaged 67 Masonry 3645 2093 2095 2.20 9.00 15.00 Damaged 68 Masonry 3661 2101 2101 0.00 11.70 29.00 Destroyed 69 Masonry 3681 2103 2106 3.00 11.00 25.00 Damaged 70 Masonry 3770 2126 2126 0.00 4.00 7.00 Destroyed 71 Masonry 3776 2127 2130 2.50 8.00 15.00 Damaged 72 Masonry 3807 2135 2135 0.00 12.50 12.50 Destroyed 73 Masonry 3825 2141 2143 2.20 4.50 12.00 Destroyed 74 Masonry 3842 2145 2149 3.50 6.00 18.00 Damaged 75 Masonry 3886 2158 2162 4.00 9.00 15.00 Damaged 76 Masonry 3898 2163 2167 4.00 4.50 18.50 Good 77 Masonry 3924 2173 2176 3.00 3.00 8.00 Damaged 78 Masonry 3939 2177 2178 0.50 6.00 15.00 Destroyed 79 Masonry 3955 2181 2184 2.50 6.00 16.00 Damaged 80 Masonry 4108 2226 2233 5.50 10.00 18.00 Good 81 Masonry 4197 2295 2300 4.50 6.00 7.00 Good 82 Masonry 4306 2364 2370 6.00 5.00 5.50 Good
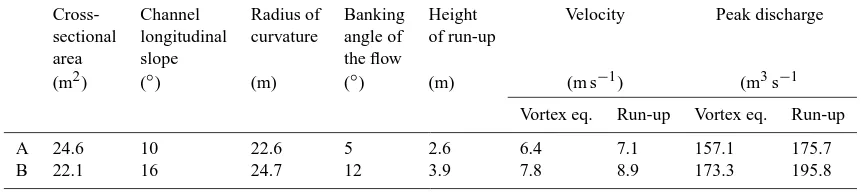
Velocities were back calculated on two cross sections along the channel using both the vortex equation and the run-up equation (Johnson and Rodine, 1984; Hungr et al., 1984; Iverson et al., 1994; Jakob et al., 2000; Remaˆıtre et al., 2005a) and multiplied by the cross-sectional area to estimate peak discharge. Velocities ranged from 6.4 to 8.9 m s−1; ve-locities back-calculated with the run-up equation are some-how higher than those obtained with the vortex equation. Peak discharges ranged from 150 to 200 m3s−1 (Table 2).
2.3 Sedimentology and rheology of the 2003 debris flow Nine samples of matrix were gathered at several locations both on the two triggering spots (Trois Hommes and Cham-perousse) and along the main axis of the debris-flow track (Fig. 4). Debris-flow deposits were sampled at 20 and 50 cm depth; the average weight of the samples was about 50 to 150 kg. The fraction>20 mm has been measured and charac-terized (petrography) in the field. For the fraction<20 mm, all samples were oven dried and sieved from less than 20 mm to 0.050 mm. The proportion of fines (<0.050 mm) was analysed by laser diffractometry. The grain-size
distribu-tion obtained on the fracdistribu-tion passing 20 mm sieve shows a remarkable difference between the debris-flow deposits sam-ples (Fig. 5). The Trois Hommes (TH03) and the Cham-perousse (CHA03) deposits, sampled in the triggering areas, correspond to granular debris-flows flows deposits; indeed the fraction of fine elements (finer than 0.050 mm) did not exceed 10%. The Faucon deposits (FAU03) correspond to muddy debris-flow deposits (D50varies from 0.15 to 1 mm), indeed the clay and silt content ranges from 16 to 33%, and they are sandy clay loam or sandy clay. According to scour-ing phenomena, proportion of fine elements increases with the distance to the triggering areas. This has been either ob-served during the 1996 debris-flow event (Remaˆıtre et al., 2005b).
Fig. 5. Grain-size distribution of the 2003 debris-flow deposits.
The material behaves as a viscoplastic fluid, with a shear rate dependent behaviour, as obtained by other authors for clay-rich mixtures at similar stress conditions (e.g. O’Brien and Julien, 1988; Major and Pierson, 1992; Coussot et al., 1996; Sosio et al., 2007). The FAU03 deposit exhibits vis-coplastic behaviour for all shearing velocities and is well fit by a Herschel-Bulkley model. Rheological parameters (τc,
κ) decreased with the total solid concentration by volume (Fig. 6). The yield strength ranged from 1 to 270 Pa and vis-cosity from 9 to 71 Pa s.
3 The debris-flow run-out model (JDFM-1D)
The JDFM-1D debris-flow run-out model has been devel-oped by van Asch (van Asch et al., 2004). The constitutive equation used in the model is a simplified 2-parameters Bing-ham plastic rheology described mathematically as follows in simple shear geometry:
∂v ∂y=
1
η(τ−τ0) (1)
where,vis the velocity (m s−1),yis the depth perpendicular to the velocity (m),ηis the dynamic viscosity (kPa s),τis the shear stress (kPa) andτ0is the yield strength (kPa). Bingham plastic fluids exhibit linear shear-stress shear-rate behaviour after an initial shear-stress threshold has been reached (An-cey, 2007).
Since the debris-flow has a changing geometry, inter slice forces are not symmetrical like in the infinite slope model. Therefore the shear stress and yield strength in Eq. (1) are calculated with the simplified Janbu equilibrium model (Janbu, 1954; Nash, 1987):
Ft=
P[c0L+(Wt−(Ut
normal+Ut
−1
excess))tanφ0]/nα
PWt
tanα =
PS
PT
(2a)
Fig. 6. Empirical relationships relating yield strength and viscosity
on varying the solid concentration by volume for the 2003 debris-flow event at the Faucon torrent.
nα=cos2α
1+tanαtanϕ
0
Ft−1
(2b)
where, W is the weight of an individual slice j (kN);U is the pore water force on the slip surface of slicej (kN),c0is the cohesion (kPa),φ’ is the effective friction angle (◦),αis
the slope angle of slicej(◦),Lis the length of the slip surface
of slicej(m),S=τ0Lis the resisting force of slice j (kN) and
T=τ Lis the mobilized shearing force of slice j (kN). This stability model satisfies force equilibrium on each slice and moment equilibrium on the whole failure surface (Duncan and Wright, 1980).
In the presented simulation, the width of the slices is 5 m. The Janbu equation delivers the yield strength and the shear stress, which are needed for Eq. (1). Equation (2a) contains
F on both sides, which is solved iteratively in the first time step. In the following time stepsFt on the left side of Eq. (2) is calculated withFt−1obtained from the former time step and which is substituted for each slice in Eq. (2b) to calculate the right side of Eq. (2a). Assuming a velocity profile, which increases linearly with flow depth, the displacement of mass in m3m−1per times step is given by:
Table 2. Velocities and peak discharge of the 2003 debris flow.
Cross- Channel Radius of Banking Height Velocity Peak discharge sectional longitudinal curvature angle of of run-up
area slope the flow
(m2) (◦) (m) (◦) (m) (m s−1) (m3s−1 Vortex eq. Run-up Vortex eq. Run-up A 24.6 10 22.6 5 2.6 6.4 7.1 157.1 175.7 B 22.1 16 24.7 12 3.9 7.8 8.9 173.3 195.8
The thickness of the rigid plug is given by:
hp=
cLhj
T−N0tanϕ0 (4)
N’ is obtained by resolving the forces per slice vertically:
N0=W/cosα−U−Ttanα (5) The routing of the material in a time step is done by a simple mass balance equation:
1qj=qj−1−qj (6) where the slicej−1lies upstream of slicej. A zeroφ-value in Eq. (2) delivers Bingham behaviour of the material. For the Coulomb viscous flow behaviour a combination of c- and
φ-values (including ac=0 condition) can be selected. A pore pressure ratiopu, defined by Eq. (7), is applied for each slice during the run-out:
pu=
hwγw
hjγs
(7) where,hw is the vertical height of the groundwater (m),γw is the unit weight of water (kN m−3),γ
s is the unit weight of saturated material (kN m−3). For a given p
u-value, a pore water forceUcan be calculated for equation 2a for each slice as follows:
U=puhjγsL (8) During run-out, a constant pore pressure ratio or a dissipation of excess pore pressure can be assumed. Assuming that the muddy debris-flow is completely saturated (hw=hj in Eq. 7) the amount of excess pore pressure in terms of the pore pres-sure ratio is:
pexcessu =pu−
γw
γs
(9) During run-out, dissipation of excess pore pressure is esti-mated by Therzaghi’s theory of one-dimensional consolida-tion of an open layer (Whitlow, 1995). The fracconsolida-tional dissi-pation (Fr) of pu-excess during an elapsed run-out timet=i
is given by: t=i
Fr=1− 8 π2
e−(π2/4)Tv+1
9e
−(9π2/4)Tv+1
25e
−(25π2/4)Tv. . .
(10) where, Tv is the dimensionless time factor of one-dimensional consolidation and pore water dissipation pro-cess.Fr has a value between 0 and 1 (=complete dissipation of excess pore pressure).
Tvin Eq. (10) is defined as follows:
Tv=
Cvti
d2 (11)
where, ti is the elapsed time (s), d is the length of the drainage path that for an open layer equals half the mean thickness of the flow (m),Cvis the coefficient of consolida-tion (m2s−1).
For each time step the amount of excess pore pressure is calculated by equation (12):
t=i
pexcessu = t=0
puexcess−Fr t=0
pexcessu (12)
The input parameters (Fig. 7) are the topography of the tor-rential track, and the characteristics of the initial source ma-terial: volume (m3), unit weight (KN m3), the internal fric-tion angle (◦), the cohesion (kPa) and the dynamic viscosity (kPa s).
The model has been previously tested on real debris-flows track profiles. For instance, the model has been calibrated and validated on two landslide-induced debris flows at the Super-Sauze mudslide (van Asch et al., 2004).
Fig. 7. Characteristics of the JDFM 1D model and of the scouring calculation rules.
The model has been calibrated for the 2003 event before using it for scenario modelling (Fig. 8). Calibrations were carried out on the run-out distance and the flow height. For each model run a φ-value was selected starting with φ=0 (Bingham behaviour). The c- andφ-values were obtained by calibration. The cohesion (c) could be calibrated on run-out distance, while the dynamic viscosity (η) could be calibrated on the flow height. With increasingφ-values the dynamic viscosity decreases. This is explained by the overall increase in resistance of the flow due to the dependency of friction on flow depth. Therefore, in order to match the observed flow height the dynamic viscosity has to be lowered. However the calibrated viscosities (η) are much higher (8 kPa s) than the viscosities measured in the laboratory with parallel-plates rheometrical tests and inclined-plane tests; the maximum vis-cosity is 0.1 to 0.2 kPa s (Remaˆıtre, 2006).
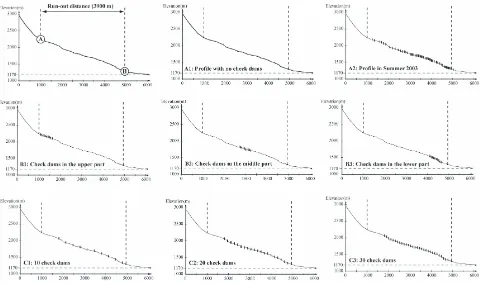
4 Modelling scenarios
For each modelling test, the same triggering scenario has been used, based on the observations of the Faucon stream after a debris-flow triggered in 2003 (Remaˆıtre et al., 2008). A volume of 5000 m3of material has been considered, which corresponds to one of the source area (Trois Hommes area); indeed it is not possible to choose more than one source area. The 2003 debris-flow event started as a granular flow, bulked increased in fine elements by incorporating marly sediments along the torrential paths and transformed into a muddy de-bris flow. Such phenomena have been also observed during the 1996 debris-flow event (Remaˆıtre et al., 2005a, b). In the
model, the rheological characteristics of the debris-flow ma-terial can not be changed during the run-out. Therefore, we considered that the flow exhibits viscoplastic behaviour for the entire simulation. The source area is located at the upper part of the profile (the A point on the Fig. 9) while the check point (the B point on the Fig. 9) location corresponds to the upper part of the fan where the flow-track shows a clear flat-tening of the slope gradient. The run-out distance is approx-imately 4000 m. In the model, the check dams influence the intensity of the debris-flow through topographic variations of the flow track (slope angle). For the scenario A, the height of check dams corresponds to the height observed in the field in July 2003. For the scenarios B and C, a 5 m height has been considered for all the check dams.
Three main run-out scenarios have been tested (Fig. 9): (1) Scenario A: effect of the check dams on the intensity
of the 2003 flow. Two configurations of debris-flow pathway: profile with no check dams (A1), and the profile with the check dams observed and mapped before the 2003 debris-flow event;
(2) scenario B: effect of the location of check dams on the intensity of a debris flow. Three configurations of check dams location: check dams located in the upper part of the torrential pathway (B1), the middle part (B2) and in the lower part (B3);
Fig. 8. Calibration of the JDFM-1D code for the 2003 debris-flow event at the Faucon torrent.
Fig. 10. Comparisons of computed debris-flow intensities (flow velocity, flow height and total volume) using JDFM-1D for three modelling
scenarios.
5 Modelling results
Different configurations of flow track profile were analysed through a sensitivity analysis. For each configuration, the maximal flow height, the maximal velocity and the total vol-ume of debris where analysed and compared (Fig. 10).
For the scenario A, logically, the intensity of the debris flow is decreasing when the torrent is equipped by check dams. The maximum flow height is decreasing from 5.95 m (A1: no check dams) to 2.21 (A2: 75 check dams), while the
The run-out modelling according the influence of the number of check dams (scenario C) shows a relative regu-lar decrease of the flow intensity. The decrease is particu-larly strong between the scenario A1 (no check dams) and the scenario C1 (10 check dams): decreasing of the maximal velocity, the maximal flow height and the volume are respec-tively 29% (1.58 to 1.12 m s−1), 25% (5.95 to 4.41 m) and 26% (69 000 to 51 000 m3); while the decreasing is gently moderate when the number of check dams is increasing (sce-narios C1, C2 and C3). For instance, between the C1 and the C3 scenarios, decreasing of the maximal velocity, the maximal flow height and the volume are respectively 11% (1.12 to 1.00 m s−1), 7% (4.41 to 4.12 m) and 10% (51 000 to 46 000 m3).
Concerning the scenario B, the comparison of the debris-flow intensity for the three cases (B1, B2 and B3) shows that the location seems to have a strong influence on the debris-flow intensity. Indeed, the differences are significant between the B1 scenario (dams located on the upper part) and the B3 scenario (dams located on the lower part): decreasing of the maximal velocity, the maximal flow height and the vol-ume are respectively 37% (1.19 to 0.74 m s−1), 36% (4.97 to 3.18 m) and 33% (62 000 to 41 000 m3).
6 Discussion and conclusions
Morphological, kinematical and rheological features of the 2003 debris flow at the Faucon torrent have been used in the present study to first calibrate a viscoplastic run-out model and second to develop a methodology to assess and quantify run-out intensity according to the presence (number, loca-tion) or the absence of check dams.
The JFDM-1D model can take into account the amount of material entrained by the flow along the path (scouring) thereby increasing the final volume deposited. According to Rickenmann et al. (2003), we assumed that the intensity of the scouring is function of the integrated mean shear stress of the debris-flow mixture which passed through sections of the torrent, and is controlled by the slope gradient, the vol-ume and the density of the mixture which enters this section. Therefore, breaking the energy of the flow in the earlier stage of the debris-flow event kinematics would reduce the total amount of entrained material.
The modelling sensitivity analysis of the relative influence of, on one hand the number of check dams, and on the other hand the location of the check dams shows some interesting results. The simulation which provides the lowest debris-flow intensity corresponds to the case where the check dams are located at the upper part of the flow track (Scenario B1), near the source area. These results suggest that a relative small number of check dams located near the potential source areas could be very efficient by breaking early the energy of the debris-flow. For this reason, additional river engineer-ing measures could be proposed, such as construction of new
check dams in the upper reaches of the Faucon torrent. These conclusions are valid for a debris flow that exhibited a muddy behaviour; some additional modelling tests have to be pro-vided for granular debris-flows.
This new approach opens a new direction for future re-search. Additionally work remains to be done in order to (i) analyse the influence of other check dam characteristics (height, width) on the debris-flow intensity and (ii) to develop a robust and efficient methodology which can be applied for routine debris-flow hazard assessment.
Acknowledgements. This paper has been supported by the project
“Mountain Risks” funded by the European Commission. The authors gratefully thank Gonghui Wang and two anonymous referees for their useful comments.
Edited by: F. Catani
Reviewed by: G. Wang and two anonymous referees
References
Ancey, C.: Plasticity and geophysical flows: A review, J. Non-Newton. Fluid, 142, 4–35, 2007.
Armanini, A. and Scotton, P.: Experimental analysis on the dy-namic impact of a debris flow on structures, Proceedings of the international symposium Interpreavent 1992, Bern Switzerland, 6, 107–116, 1992.
Ayotte, D. and Hungr, O.: Calibration of a runout prediction model for debris flows and avalanches, in: Debris-flow Hazards Mitiga-tion: Mechanics, Prediction, and Assessment, Proceedings of the Second International Conference on Debris-flow Hazard Mitiga-tion, Taipei (Taiwan), edited by: Wieczorek, G. F. and Naeser, N. D., Balkema, Rotterdam, 505–514, 2000.
Caine, N.: The rainfall intensity-duration control of shadow land-slides and debris flows, Geogr. Ann. A, 62, 23–27, 1980. Campbell, R. H.: Debris flows originating from soil slips during
rainstorms in Southern California, Q. J. Eng. Geol. Hydroge., 7, 339–349, 1974.
Campbell, R. H.: Soil slips, debris flows and rainstorms in the Santa Monica Mountains and vinicity, Southern California, USGS Prof. Paper 851, 51 pp., 1975.
Cannon, S. H. and Ellen, S.: Rainfall conditions for abundant de-bris avalanches, San Francisco Bay region, California, California Geology, 38(12), 267–272, 1985.
Corominas, J., Remondo, J., Farias, P., Estevao, M., Z´ezere, J., Diaz de Teran, J., Dikau, R., Schrott, L., Moya, J., and Gon-zales, A.: Debris flows, in: Landslide Recognition, edited by: Dikau, R., Brundsen, D., Schrott, L., and Ibsen M.-L., Wiley, Chichester, 161–180, 1996.
Costa, J. E.: Physical geomorphology of debris flows, in: Devel-opments and Applications in Geomorphology, edited by: Costa, J. E. and Fleisher, P. J., Springer-Verlag, Heidelberg, 268–317, 1984.
Couvert, B., Lefebvre, B., Lefort, P., and Morin, E.: Etude g´en´erale sur les seuils de correction torrentielle et les plages de d´epˆot, La Houille Blanche, 46(6), 449–456, 1991.
Crozier, M. J. and Eyles, R. J.: Assessing the probability of rapid mass movement, Proceedings of 3rd Australian New Zealand Conference on Geomechanics: 2.47–2.53, N. Z. Institute of En-gineers, Wellington, 1980.
D’Ambrosio, D., Iovine, G., Sparato, W., and Miyamoto, H.: A macroscopic collisional model for debris-flows simulation, Env-iron. Modell. Softw., 22, 1417–1436, 2007.
Deymier, J.-M., Tacnet, J.-M., and Mathys, N.: Conception et calcul de barrages de correction torrentielle. Collection Etudes, S´erie Equipement pour l’Eau et l’Environnement, Cemagref Editions, 288 pp., 1994.
Duncan, J. M. and Wright, S. G.: The accuracy of equilibrium meth-ods of slope stability analysis, Eng. Geol., 16(1–2), 5–17, 1980. Godt, J. W. and Coe, J. A.: Alpine debris-flows triggered by a 28
July 1999 thunderstorm in the Central Front Range, Colorado, Geomorphology, 84, 80–97, 2007.
Guinau, M., Vilajosana, I., and Vilaplana, J. M.: GIS-based debris flow source and runout susceptibility assessment from DEM data - a case study in NW Nicaragua, Nat. Hazards Earth Syst. Sci., 7, 703–716, 2007
http://www.nat-hazards-earth-syst-sci.net/7/703/2007/.
Hungr, O., Morgan, G. C., and Kellerhalls, R.: Quantitative analysis of debris torrent hazards for design of remedial measures, Can. Geotech. J., 21, 663–667, 1984.
Hungr, O., Evans, S. G., Bovis, M. J., and Hutchinson, J. N.: A review of the classification of landslides of the flow type, Envi-ronmen. Eng. Geosci., 7, 221–238, 2001.
H¨urlimann, M., Copons, R., and Altimir, J.: Detailed debris flow hazard assessment in Andorra: A multidisciplinary approach, Geomorphology, 78, 359–372, 2006.
Iovine, G., Di Gregorio, S., and Lupiano, V.: Debris-flow suscep-tibility assessment through cellular automata modeling: an ex-ample from 15-16 December 1999 disaster at Cervinara and San Martino Valle Caudina (Campania, southern Italy), Nat. Hazards Earth Syst. Sci., 3, 457–468, 2003
http://www.nat-hazards-earth-syst-sci.net/3/457/2003/.
Iverson, R. M.: The physics of debris flows, Rev. Geophys., 35, 245–296, 1997.
Iverson, R. M., LaHusen, R. G., Major, J. J., and Zimmerman, C. L.: Debris flows against obstacle and bends: dynamic and deposits, EOS T. Am. Geophys. Un., 75, 1994.
Jakob, M., Anderson, D., Fuller, T., Hungr., O., and Ayotte, D.: An unusually debris flow at Hummingbird Creek, Mara Lake, British Columbia, Can. Geotech. J., 37, 1109–1125, 2000.
Janbu, N.: Application of composite slip surface for stability anal-ysis, European Conference on Stability Analanal-ysis, Stockholm, Sweden, 3, 43–49, 1954.
Jibson, R. W.: Debris flows in southern Puerto Rico, in : Landslide processes in Eastern North America and Puerto Rico, edited by: Schultz, A. P. and Jibson, R. W., Geological Society of America Special Paper, 236, 29–55, 1989.
Johnson, A. M. and Rodine, J. R.: Debris flows, in: Slope Instabil-ity, edited by: Brundsen, D. and Prior, D. B., Wiley, Chichester, 257–361, 1984.
Johnson, P. A. and McCuen, R. H.: Silt dam design for debris flow mitigation, J. Hydraul. Eng., 115(9), 1293–1296, 1989.
Laigle, D. and Marchi, L.: Example of mud/debris flow hazard as-sessment, using numerical models, in: Debris-flow Hazards Mit-igation: Mechanics, Prediction, and Assessment. Proceedings of the Second International Conference on Debris-flow Hazard Mit-igation, Taipei (Taiwan), edited by: Wieczorek, G. F. and Naeser, N. D., Balkema, Rotterdam, 417–424, 2000.
Lumb, P.: Slope failures in Hong Kong, Eng. Geol., 8, 31–65, 1975. Major, J. J. and Pierson, T. C.: Debris-flow rheology: experimental analyses of fine-grained slurries, Water Resour. Res., 28(3), 841– 857, 1992.
Malet, J.-P., Remaˆıtre, A., Maquaire, O., Ancey, C., and Locat, J.: Flow susceptibility of heterogeneous marly formations. Implica-tions for torrent hazard control in the Barcelonnette basin (Alpes-de-Haute-Provence), in : Proceedings of the 3rd International Conference on Debris-Flow Hazard Mitigation: Mechanics, Pre-diction and Assessment, Davos, Switzerland, edited by: Ricken-mann, D. and Chen, L. C., Milpress, Rotterdam, 351–362, 2003. Miyazawa, N., Tanishima, T., Sunada, K., and Oishi, S.: Debris-flow capturing effect of grid type steel-made sabo dam using 3D distinct element method, in: Proceedings of the 3rd International Conference on Debris-Flow Hazard Mitigation: Mechanics, Pre-diction and Assessment, Davos, Switzerland, edited by: Ricken-mann, D. and Chen, L. C., Milpress, Rotterdam, 527–538, 2003. Montgomery, D. R. and Dietrich, W. E.: A physically based model for the topographic control on shallow landsliding, Water Resour. Res., 30, 1153–1171, 1994.
Nash, D.: A comparative review of limit equilibrium methods for stability analysis, in: Slope Stability, edited by: Anderson, M. G. and Richards, K. S., John Wiley & Sons Ltd., 11–77, 1987. O’Brien, J. S., Julien, P. Y., and Fullerton, W. T.: Two-dimensional
water flood and mudflow simulation, J. Hydraul. Eng.-ASCE, 119(2), 244–261, 1993.
Okuda, S., Ashida, K., Gocho, Y., Okunishi, K., Sawada, T., and Yokoyama, K.: Characteristics of heavy rainfall and debris haz-ard, Natural Disaster Science, 4, 41–55, 1980.
Pierson, T. C.: Erosion and deposition of debris flows at Mount Thomas, North Canterbury, New Zealand, Earth Surf. Proc. Land., 5, 227–247, 1980.
Remaˆıtre, A.: Morphologie et dynamique des laves torrentielles: applications aux torrents des Terres Noires dans le bassin de Barcelonnette (Alpes du Sud), Ph.D. thesis, Universit´e de Caen-Basse Normandie, 487 pp., 2006.
Remaˆıtre, A., Maquaire, O., and Malet, J. P.: Morphology and sed-imentology of a complex debris flow in clay-shales basin, Earth Surf. Proc. Land., 30, 339–348, 2005a.
Remaˆıtre, A., Malet, J.-P., Ancey, C., Locat, J., and Maquaire, O.: Flow behaviour and runout modelling of a complex debris flow in clay-shales basin, Earth Surf. Proc. Land., 30, 479–488, 2005b. Rickenmann, D., Weber, D., and Stepanov, B.: Erosion by debris
flows in field and laboratory experiments, in: Proceedings of the 3rd International Conference on Debris-Flow Hazard Mitigation: Mechanics, edited by: Rickenmann, D. and Chen, L. C., Predic-tion and Assessment, Davos, Switzerland, Milpress, Rotterdam, 883–894, 2003.
Scott, K. M., Vallance, J. W., and Pringle, P. T.: Sedimentology, behaviour and hazards of debris flows at Mount Rainier, Wash-ington, USGS Prof. Paper 1547, 56 pp., 1995.
Earth Surf. Proc. Land., 32(2), 290–306, 2007.
Takahashi, T.: Debris flows, Balkema, Rotterdam, 165 pp., 1991. van Asch, T. W. J., Malet, J.-P., Remaˆıtre, A., and Maquaire, O.:
Numerical modelling of the run-out of a muddy debris flow, The effect of rheology on velocity and deposit thickness along the run-out track, in: Proceedings of the 9th International Sympo-sium on Landslides, edited by: Lacerda, W., Rio de Janeiro, Brazil, 1, 1433–1438, 2004.
VanDine, D. F. and Bovis, M.: History and goals of Canadian debris-flow research, Nat. Hazards, 26(1), 67–80, 2002.
Whitlow, R.: Basic Soil Mechanics, Essex, Longman, 592 pp., 1995.