and deformability of the erythrocyte membranes[18].
In our study, diabetic rats showed decreased activity of low affinity Ca2+-ATPase and this could be due
to insulin deÞ ciency and insulin being the regulator of the enzyme. Treatment with HMAB restored the level of low affinity Ca2+-ATPase, which might be
associated with insulin secretary effect. The results of this study demonstrate that HMBA exhibits promising antidiabetic activity and also helps to maintain glycemic control by curbing ROS.
ACKNOWLEDGEMENTS
The authors thank the management of VIT University for supporting research.
REFERENCES
1. Nadkarni AN. Indian materia medica. Vol. 1, Mumbai: Popular Book Depot; 1989. p. 619.
2. Jain SP, Singh SC. Ethno-medico-botanical survey of Ambikapur District, MP. Fourth International Congress of Ethnobiology, Lucknow: NBRI; 1994.
3. Alam MI, Auddy B, Gomes A. Isolation, purification and partial characterization of viper venom inhibiting factor from the root extract of the Indian medicinal plant sarsaparilla (Hemidesmus indicus R.Br). Toxicon 1994;2:1551-7.
4. Saravanan N, Rajashankar S, Nalini N. Antioxident effect of 2-hydroxy-4-methoxy benzoic acid on ethanol induced hepatotoxicity in rats. Pharm Pharmacol 2007;59:445-53.
5. Nagarajan S, Rao LJ. Determination of 2-hydroxy-4-methoxybenzaldehyde in roots of Decalepis hamiltonii (Wight&Arn) and Hemidesmus indicus R.Br. J AOAC Int 2003;86:564-7.
6. Alam MI, Gomes A. Viper venom-induced inß ammation and inhibition of free radical formation by pure compound (2- hydroxy-4-methoxy benzoic acid) isolated and purified from anantamul (Hemidesmus indicus R. BR) root extract. Toxicon 1998;36:207-15.
7. Alam MI, Gomes A. Adjuvant effects and antiserum action potentiation by a (herbal) compound 2-hydroxy-4-methoxy benzoic acid isolated
from the root extract of the Indian medicinal plant ‘sarsaparilla’ (Hemidesmus indicus R. Br.). Toxicon 1998;36:1423-31.
8. Prabakan M, Anandan R, Devaki T. Protective effect of Hemidesmus indicus against rifampicin and isoniazid-induced hepatotoxicity in rats. Fitoterapia 2000;71:55-9.
9. Baheti JR, Goyal RK, Shah GB. Hepatoprotective activity of Hemidesmus indicus R.br. in rats. Indian J Exp Biol 2006;44:399-402. 10. Gayathri M, Kannabiran K. Hypoglycemic activity of Hemidesmus
indicus R. Br. on streptozotocin induced diabetic rats. Int J Diab Dev Countries 2008;28:6-10.
11. Trinder P. Determination of glucose in blood using glucose oxidase with an alternative oxygen acceceptor. Ann Clin Biochem 1969;6:24-7. 12. Evans. WC. Trease and Evans Pharmacognosy. 14th ed. Singapore:
Harcourt Brace and Company; 1997. p. 54-67.
13. Niechaus WG, Samuelson B. Formation of MDA from phospholipid arachidonate during microsomal lipid peroxidation. Eur J Biochem 1968;6:126-30.
14. Hjerten S, Pan H. PuriÞ cation and characterization of two forms of a low-affinity Ca2+-ATPase from erythrocyte membranes. Biochim Biophys Acta 1983;728:281-8.
15. Fidan AF, Dunder Y, The effects of Yucca schidigera and Quillaja saponaria on DNA damage, protein oxidation, lipid peroxidation, and some biochemical parameters in streptozotocin-induced diabetic rats, J Diabetes Compl 2008;22:348-56.
16. Jain SK, Lim G. Lipoic acid decreases lipid peroxidation and protein glycosylation and increases (Na2+ +K2+) and Ca2+ATPase in high glucose-treated human erythrocytes. Free Radical Bio Med 2000;29:1122-8.
17. Hope-Gill HF, Nanda V. Stimulation of calcium ATPase by insulin, glucagon, cyclic AMP and cyclic GMP in tri- ton X-100 extracts of puriÞ ed rat liver plasma membrane. Horm Metab Res 1979;11:698-700. 18. La Celle PR, Kirkpatrick FH. Determinants of erythrocyte membrane
elasticity. In: Brewer GJ, editor. Erythrocyte structure and function, New York: Alan R. Liss Inc; 1975, p. 535-57.
Accepted 01 October 2009 Revised 28 July 2009 Received 25 February 2009 Indian J. Pharm. Sci., 2009, 71 (5): 581-585
Development and Validation of a Spectrofluorimetric
Method for the Estimation of Rivastigmine in
Formulations
R. KAPIL, S. DHAWAN AND BHUPINDER SINGH*
University Institute of Pharmaceutical Sciences (UGC Centre of Advanced Studies) Panjab University, Chandigarh-160 014, India
Kapil et al.: Spectrofl uorimetric Method for the Estimation of Rivastigmine
*Address for correspondence
A rapid, sensitive, simple, and cost-effective spectrofl uorimetric method was developed for the estimation of rivastigmine in bulk and pharmaceutical formulations. The relative fl uorescence intensity of rivastigmine was measured in triple distilled water at an excitation wavelength of 220 nm and an emission wavelength of 289 nm. Linearity range was found to be 100 to 4000 ng/ml. The method was validated for various parameters as per the ICH guidelines and USP requirements. The detection and quantitation limits were found to be 20.5 and 62.1 ng/ml, respectively. The results demonstrate that the procedure is accurate, precise, and reproducible, while being simple and rapid too. The results were found to be in good agreement with the label claims.
Key words: Detection limit, fl uorescence spectrophotometry, fl uorimetry, linearity, quantitation limit, validation
Rivastigmine has been available as the drug of choice for the symptomatic treatment of moderate to severe Alzheimer’s disease. More recently, it has been indicated in mild to moderate dementia associated with Parkinson disease too. The usage of rivastigmine has been approved in capsule and liquid form in several countries like US and UK since 1997. Rivastigmine is a dual inhibitor of acetylcholinesterase and butyrylcholinesterase. Its efÞ cacy is dose-related, with daily oral doses ranging between 6 mg and 12 mg[1]. Owing to its numerous clinical advantages,
there has been a spurt in the number of publications on rivastigmine, esp. on its formulation aspects[2-4].
Increasing popularity of rivastigmine, therefore, necessitates the development of a simple analytical method for its estimation in bulk and formulations, and during dissolution runs. UV/Vis spectrophotometry, in this context, is of limited utility because of its non-speciÞ c λmax i.e., 221 nm, a region of high spectrophotometric interference. High performance liquid chromatography (HPLC) methods utilizing UV and ß uorescence detectors are reported in literature[5,6] for estimation of rivastigmine in
dissolution release media and in biological ß uids like plasma and serum. The chromatographic techniques, however, demand a lot of time, cost and expertise in their operation.
The objective of the present study, therefore, was to develop a simple, sensitive, rapid, precise, accurate, effective and cost-effective analytical method for estimation of rivastigmine in pharmaceutical formulations and during in vitro dissolution studies of its formulations. Further, the study would embark upon the validation of the developed methodology as per the ICH guidelines[7] and USP requirements[8].
Rivastigmine hydrogen tartarate was obtained ex gratis from M/s Sun Pharma Ltd, Vadodara, India and M/s Cipla Pharma Ltd, Mumbai, India. Marketed brand (Rivamer® 1.5 mg, Batch no. GK71822, Sun
Pharma Ltd, Kartholi, J&K, India) was employed as the reference. All other chemicals and reagents were of analytical grade and were employed as such. All the fluorescence measurements were conducted on a spectrofluorimeter (Hitachi F 2500, Japan) equipped with a Xenon arc lamp, preloaded with a data interpreting software (FL Solutions ver. 2.0).
Various dissolution media viz. distilled water, 0.1N HCl, phosphate buffer (pH 6.8) and normal saline, alone and in combination with different organic solvents, in various proportions, were employed based on the sensitivity, ease of sample preparation, drug solubility, cost and applicability of the method employed. The relative ß uorescence intensity (RFI) of rivastigmine was measured at an excitation wavelength (i.e., activating wavelength, λexc) of 220 nm and an emission wavelength (i.e., fluorescence wavelength, λem) of 289 nm. Fig. 1 depicts a scan of the emission ß uorescence of the drug obtained at the λexc of 220 nm. The slit width for excitation and emission was kept as 10 nm. The photo-multiplier tube voltage was set at 700 V. Primary stock solution of 1000 µg/ml of rivastigmine hydrogen tartarate was prepared in triple distilled water (TDW). Secondary
300 400 500 600 700 800 nm rk1(EM)
-10 0 10 20 30 40 50 60 70 80 90 100 110
stock solution of 10 µg/ml of drug was prepared in TDW using aliquots of primary stock solution. For preparation of different drug concentrations, aliquots of secondary stock solution were transferred into a series of 10 ml standard ß asks and volume was made up with TDW. A total of 12 different concentrations (100, 150, 200, 250, 300, 400, 500, 1000, 2000, 2500, 3000 and 4000 ng/ml) of rivastigmine were prepared for constructing a standard calibration curve and their RFI was recorded against blank.
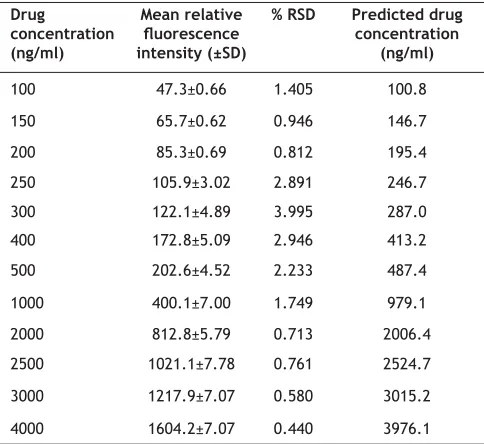
To establish linearity of the proposed method, six separate series of solutions of the drug in the selected medium were prepared from the stock solution and analyzed. Least square linear regression analysis was conducted on the obtained spectrofluorimetric data using MS-Excel 2007 spreadsheet software. Different concentrations and their relative ß uorescence intensities are shown in Table 1. At all the drug concentration levels studied, the values of standard deviation (SD < 7.8%) and the relative standard deviation (RSD < 3.9%) were found to be quite low, indicating high repeatability. The values of predicted concentrations were nearly matching with that of the nominal observed concentrations.
Linearity of the method was confirmed by plotting the ratio of response: concentration (i.e., sensitivity)
vs. log of concentration[9]. The linearity in the
selected medium (TDW) was found to range between 100 and 4000 ng/ml. The graphical plot between sensitivity (response/amount) and log concentration also exhibited linearity in the said range, as depicted in fig. 2. Rivastigmine solutions (200 ng/ml) were prepared in the selected medium with and without common excipients (lactose, starch, methylcellulose, hydroxypropylmethylcellulose). All the studied solutions were scanned for their emission spectra at a Þ xed λexc of 220 nm and investigated for the change in emission spectrum, if any. The emission spectrum of rivastigmine was not found to alter in the presence of these common excipients in the selected medium. No statistically signiÞ cant difference in the relative ß uorescence intensity was observed between identical concentrations of pure drug sample and that of sample with excipients (P>0.05). Hence, insigniÞ cant interference of excipients during the estimation of drug could be inferred. The proposed method, therefore, was found to be quite speciÞ c and selective for the drug which could be potentially employed for its estimation in pharmaceutical formulations.
The spectrophotometric method at a λmax of 221 nm, on the contrary, was found to be quite non-speciÞ c for the drug, as various excipients and solvents also absorb signiÞ cantly in the said region.
To determine the accuracy of the proposed method, different quality control solutions, i.e., low (LQC: 150), medium (MQC: 500), and high (HQC: 2500 ng/ml) were prepared independently from stock solution and analyzed (n=6). Accuracy was assessed as the percentage relative error and mean percentage recovery[10]. The magnitudes of prediction error
(i.e., bias) values ranged between -0.18 and 0.16% for the three concentration levels studied (Table 2), unequivocally vouching high accuracy of the
Fig. 2: Validation of linearity of the analytical method of rivastigmine
TABLE 1: CALIBRATION DATA OF RIVASTIGMINE
Drug
concentration (ng/ml)
Mean relative
ß uorescence intensity (±SD)
% RSD Predicted drug
concentration (ng/ml)
100 47.3±0.66 1.405 100.8
150 65.7±0.62 0.946 146.7
200 85.3±0.69 0.812 195.4
250 105.9±3.02 2.891 246.7 300 122.1±4.89 3.995 287.0 400 172.8±5.09 2.946 413.2 500 202.6±4.52 2.233 487.4
1000 400.1±7.00 1.749 979.1 2000 812.8±5.79 0.713 2006.4 2500 1021.1±7.78 0.761 2524.7
3000 1217.9±7.07 0.580 3015.2
methodology employed. Further, as indicated in the table, the high mean % recovery values (nearly 100%) and the corresponding low standard deviation values (≤0.98%) observed during the studies also corroborated high accuracy of the method.
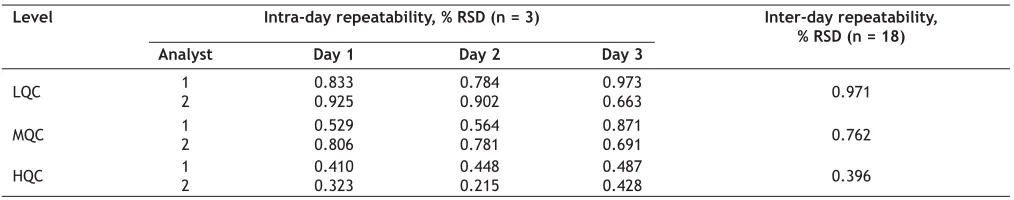
Repeatability was determined using different levels of drug concentrations (as above during determination of accuracy), prepared from independent stock solution and analyzed (n=6). Inter-day variation and intra-day variation, and analyst variation were studied to determine intermediate precision of the proposed method. Different levels of drug concentrations (in triplicate) were prepared at two different times in a day and studied for intra-day variation. The identical protocol was followed on three different days to study inter-day variation (n=18). Different analysts prepared different solutions on different days. The RSD of the predicted concentrations from the regression equation was taken as the value of precision. In the repeatability study, the RSD values ranged between 0.331 and 0.983% (Table 2). At all the three studied concentration levels, precision showed satisfactory levels. Intermediate precision expresses within-laboratory variation on different days and by different analysts. Results of intermediate precision study and RSD values for each set at all the three levels are enlisted in Table 3. In all the cases, low magnitude of RSD (< 1.00%) observed in the studies construe excellent repeatability and intermediate precision of the method.
The values of detection limit (DL) and quantitation limit (QL) of rivastigmine by the proposed method was calculated using the standard calibration curve as 3.3 σ/S and 10 σ/S, respectively, where, S is the slope of the calibration curve and σ is the standard deviation of the response. The values of DL and QL for rivastigmine were found to be 20.5 and 62.1 ng/ ml, respectively. Evidently, this indicated excellent sensitivity of the method even at sub-microgram levels. In contrast, the values of DL and QL for spectrophotometric method were found to be quite high, i.e., 0.93 and 2.82 µg/ml, respectively.
Robustness of the proposed method was determined by changing pH of the media by ± 0.2 units and analyzing stability of drug in the selected medium at room temperature for 10 h. Three different concentrations (LQC, MQC and HQC) were prepared in different pH media and mean percentage recovery was determined[10]. Robustness was found to be quite
high, as the variation of pH of the selected media by ± 0.2 did not have any signiÞ cant effect on RFI values. Mean percentage of recovery (±SD) was found to be 100.37% (±1.29). Drug solution in the selected medium exhibited no spectroß uorimetric change(s) for 10 h, when kept at room temperature.
The proposed method was also evaluated by estimation of rivastigmine in the pharmaceutical formulations. Extraction of drug from the formulation, or otherwise, was considered unnecessary; hence
was not employed. Twenty capsules (Rivamer®
TABLE 3: DATA DEPICTING INTERMEDIATE PRECISION STUDY
Level Intra-day repeatability, % RSD (n = 3) Inter-day repeatability,
% RSD (n = 18)
Analyst Day 1 Day 2 Day 3
LQC 12 0.8330.925 0.7840.902 0.9730.663 0.971
MQC 12 0.5290.806 0.5640.781 0.8710.691 0.762
HQC 12 0.4100.323 0.4480.215 0.4870.428 0.396
TABLE 2: ACCURACY DATA FOR THE DEVELOPED ANALYTICAL METHOD
Level Predicted concentration (ng/ml) Mean % recovery
(± SD) Bias (%)
Range Mean (± SD) % RSD
LQC 148.0–150.9 149.7±1.47 0.983 99.82±0.98 - 0.18
MQC 494.2–503.1 500.3±4.40 0.880 100.06±0.88 0.06
1.5 mg) were weighed and emptied on a butter paper. Amount of the powder equivalent to 1.5 mg of rivastigmine was taken, dissolved in the selected medium and filtered. The solution was diluted suitably to prepare a concentration of 1.5 µg/ ml of drug. This primary stock solution was Þ ltered through Whatman® filter paper and the filtrate was
further diluted to prepare a solution of 150 ng/ ml of rivastigmine. The RFI value of the solution, thus prepared, was observed to estimate the total rivastigmine content in the formulation. The assay values of three samples of Rivamer® capsules ranged
between 98.23 and 101.76%. Assay values (1.47–1.52 mg) of formulations were found to be quite close to the label claim of 1.5 mg. This corroborated that the interference of excipient matrix is insigniÞ cant in the estimation of rivastigmine by the proposed method. The whole process of assay involved the expenditure of minimal time (sparing a few min) and money. In contrast, HPLC procedures for the routine drug analysis require a great deal of developmental effort and expenditure in terms of solvents, columns, guard columns, productive and non-productive time etc. Hence, the spectrofluorimetric method vouches its undisputed efÞ cacy, both in terms of time and cost.
In a nutshell, the proposed method was found to be sensitive, simple, rapid, accurate, precise and inexpensive for routine analysis of rivastigmine in bulk, pharmaceutical formulations and during dissolution studies of oral formulations. The sample recoveries in all the investigated formulations were in good agreement with their respective label claims, indicating non-interference of excipients during the spectroß uorimetric estimation of drug.
REFERENCES
1. Cummings J, Lefevre G, Small G, Appel-Dingemanse S. Pharmacokinetic rationale for the rivastigmine patch. Neurology 2007;69:S10-3.
2. Wilson B, Samanta MK, Santhi K, Kumar KP, Paramakrishnan N, Suresh B. Poly(n-butylcyanoacrylate) nanoparticles coated with polysorbate 80 for the targeted delivery of rivastigmine into the brain to treat Alzheimer's disease. Brain Res 2008;200:159-68. 3. Vintiloiu A, Lafleur M, Bastiat G, Leroux JC. In situ-forming
oleogel implant for rivastigmine delivery. Pharm Res 2008;25:845-52.
4. Lefèvre G, Pommier F, Sedek G, Allison M, Huang HA, Kiese B, et al. Pharmacokinetics and bioavailability of the novel rivastigmine transdermal patch versus rivastigmine oral solution in healthy elderly subjects. J Clin Pharmacol 2008;48:246-52.
5. Craparo EF, Pitarresi G, Bondi ML, Casaletto MP, Licciardi M, Giammona GA. Nanoparticulate drug-delivery system for rivastigmine: Physicochemical and in vitro biological characterization. Macromol Biosci 2007;8:247-59.
6. Karthik A, Subramanian GS, Surulivelrajan M, Ranjithkumar A, Kamat SB. Fluorimetric determination of rivastigmine in rat plasma by a reverse phase high performance liquid chromatographic method: Application to a pharmacokinetic study. Arzneim Forsch 2008;58:205-10.
7. The European agency for the evaluation of medical products. ICH Topic Q2B Note for guidance on validation of analytical procedures: Methodology. GPMP/ICH/ 281/95, 1996.
8. USP 27, NF 22. The United States Pharmacopeia and The National Formulary, Rockville, MD: The United States Pharmacopeial Convention; 20852, 2004. ISSN: 0195-7996, ISBN: 1-889788-20-0. 9. Huber L. Validation of analytical methods In: Validation and
qualification in analytical laboratories, 2nd ed. New York: Informa Healthcare; 2007. p. 125-54.
10. Venugopal K, Movva S, Saha RN. New, rapid, and sensitive spectrofluorimetric method for the estimation of gatifloxacin in bulk and formulations. Indian J Pharm Sci 2006;68:726.
Accepted 03 October 2009 Revised 29 July 2009 Received 07 May 2009 Indian J. Pharm. Sci., 2009, 71 (5): 585-589
Bioefficacy of Lantana camara L. against Some Human
Pathogens
B. SHARMA* AND P. KUMAR
Laboratory of Plant Tissue Culture and Secondary Metabolites, Department of Botany, University of Rajasthan, Bapu Nagar, Jaipur-302 004, India
Sharma and Kumar: Bioeffi cacy of Lantana camara L.
*Address for correspondence