Comparison of Flow Characteristics of Different Sphere Geometries
Under the Free Surface Effect
M. Ozgoren1,a, S. Dogan1, A. Okbaz1, M. H. Aksoy1, B. Sahin2 and H. Akıllı2
1
Selcuk University, Engineering Faculty, Mechanical Engineering Department, Konya, Turkey
2
Cukurova University, Engineering and Architecture Faculty, Mechanical Engineering Department, Adana, Turkey
Abstract.Comparison of the experimental results of turbulent flow structures between a smooth sphere and a sphere with a vent hole, roughened, and o-ring is presented in the presence of a free-surface. Dye visualization and particle image velocimetry (PIV) techniques were performed to examine effects of passive control methods on the sphere wake for Reynolds number Re = 5000 based on the sphere diameter with a 42.5mm in an open water channel. Instantaneous and time-averaged flow patterns in the wake region of the sphere were examined from point of flow physics for the different sphere locations in the range of 0≤h/D ≤2.0 where h was the space between the top point of the sphere and the free surface. The ratio of ventilation hole to sphere diameter was 0.15, o-ring was located at 55o with a 2 mm from front stagnation point of the sphere and roughened surface was formed by means of totally 410 circular holes with a 3 mm diameter and around 2 mm depth in an equilateral triangle arrangement. The flow characteristics of instantaneous velocity vectors, vorticity contours, time-averaged streamline patterns, Reynolds stress correlations and streamwise and cross-stream velocity fluctuations for both the smooth and passively controlled sphere were interpreted.
1 Introduction
Unsteady flow structure occurs when flow pass a bluff body such as a sphere and the level of unsteady characteristics increases when the sphere is located under the free surface of the flow. This kind of flow-structure interactions is available in the natural flow phenomena such as off-shore oil storage tanks, transporting of silicon and polymer, conveying of sediment materials in the river, spherical swimming bodies in the sea or rivers, sport balls, bombs, manned/unmanned submarine research vehicles, in various aerodynamics and hydrodynamics applications.
Hasanzadeh et al. (2012) investigated the flow structure around a sphere beneath free surface for four
different submerging elevation such as h/D = 0.25,0.50,1.0 and 2.00 for the Reynolds number of
5000 by using Large Eddy simulation and a dynamic Smagorinsky sub-grid stress. They stated that examination of the obtained results reveals that the rate of interaction between the free-surface and the wake structure downstream of the spherical body is maximum for the case of h/D = 0.25 and by increasing the submerging elevation, the rate of this interaction decreases. At the submerging elevation of h/D = 2.00, the free-surface effects are minimum and beyond h/D = 2.0,
it may be assumed that these free-surface effects on the sphere wake structure disappear [1].
Ozgoren et al. (2009, 2011a and 2011b) and (2012a and 2012b) investigated interaction between a sphere wake and free-surface in the range of 0≤h/D≤2.0 with different submerging ratios [2-6]. They found that free surface has strong effect in the three-dimensional wake of the sphere. Applied passive control method can diminish the unsteady structure of the wake in positive way. In this study, comparison of three different passive control methods is made to emphasize the effect of flow control.
Under the uniform incoming flow condition, many of the studies to control the flow structure around a sphere were performed by Ozgoren et al. (2011c-e), Hassanzadeh et al.(2011), Jang and Lee (2008), Yun et al. (2006), Leweke et al. (1999), Taneda (1978), Achenbach (1974), Wu and Faeth (1993) and further investigations cited therein [7-18]. Control of flow structure around a sphere for various active and passive methods was studied by Suryanarayana and Prabhu (2000), Suryanarayana and Meier (1995), Suryanarayana et al. (1993), Ozgoren et al.(2011b, 2011c), Kim and Durbin (1988), Kiya et al. (2011), Maxworthy (1969), Jeon et al. (2004), Alammar (2004), Bakic (2008), Hadzic et al. (2002), Choi et al. (2006), Kumar et al.(2008), Aoki et al. (2003a, 2003b), Gad-el-Hak (1996), Wei et al.
EPJ Web of Conferences DOI: 10.1051/
C
Owned by the authors, published by EDP Sciences, 2013 ,
epjconf 201/
01022 (2013) 45
34501022
This is an Open Access article distributed under the terms of the Creative Commons Attribution License 2 0 , which . permits unrestricted use, distributi and reproduction in any medium, provided the original work is properly cited.
EPJ Web of Conferences
(1988), Owen and Bearman (1988), Mehta (1985) and further investigations cited therein[19-36].
In this study, instantaneous and time-averaged flow patterns around four different sphere models have examined and commented using PIV and Rhodamine dye techniques.
2 Experimental Setup
Experiments were performed in a large-scale open water channel with a test section length of 8000 mm and a width of 1000 mm at the Department of Mechanical Engineering at Cukurova University, Turkey. To perform the present experimental study, the test section made from 15 mm thick transparent Plexiglas sheet, which had a total height of 750 mm, was filled with water to a level of only 450 mm. Before reaching the test chamber, the water was pumped into a settling chamber and passed through a honeycomb section and a two-to-one channel contraction. An overview of the experimental system of the sphere models and photographs is shown in figure 1. The free-stream turbulence intensity of the flow is less than 1.0% in the range of the present Reynolds numbers, Re = (U∞D)/ʋ, based on the sphere diameter. Here, and
D are kinematics viscosity and the diameter of the sphere, respectively. U∞ is the free-stream velocity taken as 118
mm/s. The sphere with a diameter of 42.5 mm was made of Plexiglas so that the laser light easily propagates through the sphere. The sphere surface was highly polished to avoid the effects of surface roughness. To fix the sphere in the water channel, a circular bar with a 5 mm diameter was connected to the sphere from the back surface of the sphere at the measurement plane in order to avoid support’s effects while images were taken at the equator cross-section of the sphere. The disturbing effect of the support bar on the laser sheet location of the measurement plane that was observed by dye injection was negligible in the consideration of support diameter with respect to the sphere diameter. The solid blockage ratio of the sphere including support was 1.3%. The Froude number based on the water depth hw was
w
gh U
Fr = 0.056 (1)
which was subcritical flow region owing to the less than Critical Froude number 1.0. Experiments were carried out in open water channel in which Reynolds number is restricted in the laminar flow region based on the sphere diameter with a 42.5mm and turbulent flow depending on the hydraulic diameter of the channel that is 947 mm
(Dh=4 .
A/P) (2)
and Reynolds hydraulic
Rek = (U∞Dk)/ʋ= 112000 (3)
Here, A is cross-sectional area of the flowing water and P is the wetted perimeter of the channel of flowing water.
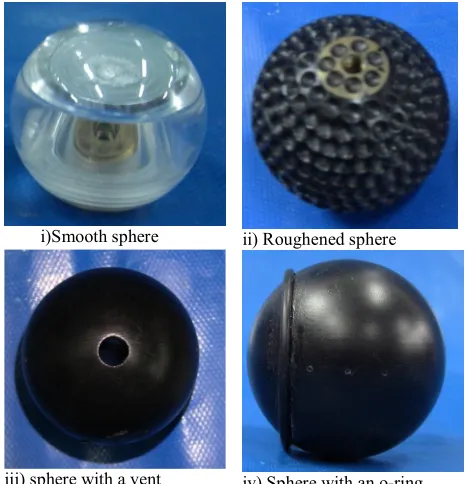
(i) Experimental Setup.
a) Smooth sphere b) Roughened sphere
c) Sphere with an o-ring at 55° and 2 mm
d) Sphere with a ventilation hole d/D = 0.15
(ii) Sphere Models.
Fig. 1. Schematic View of the Experimental Setup of PIV System, Laser Illumination for a Sphere Located in a Boundary
Layer for Smooth Sphere, a Sphere with a Vent Hole, Roughened, and Sphere with 2 mm O-ring.
EFM 2012
diameter (D=42.5 mm) to vented hole diameter (d=6.4 mm) is d/D=0.15, which provides a vent area of 2.26%. The mass flow rate and momentum flux through the hole are 3.8×10⁻³ and 4.48×10⁻⁴, respectively.
Nd:YAG laser was used to generate a laser sheet that was perpendicular to the axis of the sphere and the symmetry axis (i.e. equator of the sphere) was passed through them.
A CCD camera having a resolution of 1,600 ×1,186 pixels was used to record the images. The laser sheet was generated from a dual pulsed Nd:YAG system, having the maximum output of 120 mJ per pulse, which had time delays t = 1.0-1.7 ms for the present experiments. The suspended seeding particles with a diameter of 10 µm in the flow were silver metallic coated hollow spheres. The illuminating laser sheet thickness in the flow field was approximately 1.5 mm. As shown in figure 1, the laser was mounted in a fixed position beneath the water tank while the camera was the right angle to the laser sheet. The high-image-density criterion was satisfied by ensuring that a minimum of approximately 20-30 particles was contained within the interrogation area. Dantec Flow Grabber digital PIV software employing the cross-correlation algorithm was used to compute the raw displacement vector field from the particle image data. An interrogation window of 32 ×32 pixels in the image was selected and converted to grid size approximately 1.44 × 1.44 mm2 for the sphere (0.034D ×0.034D). The overall fields of physical view had 7,227 (99 ×73) velocity vectors for whole taken images. During the interrogation process, an overlap of 50% was employed in order to satisfy the Nyquist criterion. Patterns of instantaneous particle images with a total of 350 images in a continuous series were taken at the rate of 15 Hz to calculate the time-averaged patterns of the flow structure.
i)Smooth sphere ii) Roughened sphere
iii) sphere with a vent iv) Sphere with an o-ring
Fig. 2. Photographs of the sphere models.
3 Results and Discussion
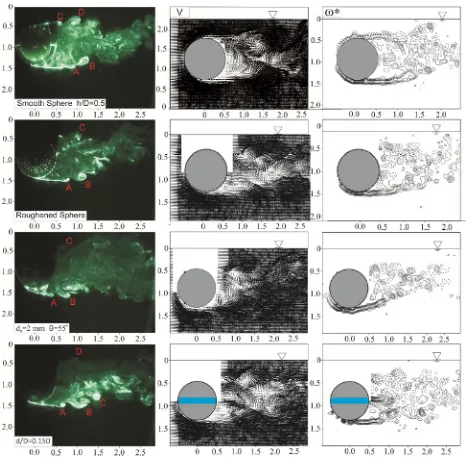
Comparison of flow visualization of flow structure with laser illumination of Rhodamine dye injection technique (column I), normalized instantaneous velocity V (column II) and vorticity * (column III) around the sphere models for h/D = 0 at Re = 5000. The rows show flow structures of four sphere models for smooth sphere (top row), roughened sphere (second row), sphere with 2 m o-ring (third row) and sphere with a hole (bottom row) is shown in figures 2a-d. All figure dimensions are normalized with the appearance diameter of the sphere as x/D, y/D and h/D. Layers of positive and negative vortices are displayed with solid and dashed lines, respectively. Instantaneous vorticity contours of the wake structure is normalized as * (i.e., * = D/U∞).
Fig. 3. Comparison of flow visualization of flow structure with laser illumination of Rhodamine dye injection technique (column I), normalized instantaneous velocity V (column II)
and vorticity * (column III) around the sphere models for h/D = 0 at Re = 5000. The rows show flow structures of four sphere models for smooth sphere (top row), roughened sphere
(second row), sphere with 2mm o-ring (third row) and sphere with a hole (bottom row). The minimum and incremental levels
of the vorticity * are taken as │*│min = │*│min = ±2.
EPJ Web of Conferences
wake region increases with increasing submerged depth of the sphere for all of the sphere models. For h/D = 1.0, the vortices produced from the flow separation around the periphery of the sphere have a tendency to move inwards because of the lower pressures prevailing within the wake. This situation is counter-balanced by the growing wake size, which shifted the vortex centerline outwards due to the effect of free-surface.
Fig. 4. Continuous of figure 3 for h/D=0.25
Ventilation hole decreases the Kelvin Helmholtz vorticity strength and the distance between the maximum vorticity values. In the second and third columns of figure 3, instantaneous vector field and corresponding vorticity patterns are shown. The modified flow structure of the near wake of the vented sphere may be characterized by a pair of counter-rotating ring vortices, which have the effect of aerodynamically streamlining the sphere as expressed by Suryanarayana and Prabhu [19].
Fig. 5. Continuous of figure 3 for h/D=0.5
For all sphere models, wake structure has complicated and very wavy wake. Passive controlled sphere may create a narrower and shorter wake region which, in turn, results in lower loading effects, drag and lift coefficients. Sphere with a ventilation hole make the wake structure streamline because of the injected flow through the lower pressure region. When compared the wake structure, the sphere with ventilation hole has two new vortices at the exit of the hole. The wake region is the smallest and shortest for the sphere with an o-ring case because of the triggering of the boundary layer on the sphere surface before occurrence of separation phenomena. As the flow travels in the downstream direction, the dimensions of the vortices increase then these vortices are shed from the lower section of the sphere directly to the inward wake region between free-surface and free-stream, and the separated flow reattaches to the free-surface.
Fig. 6. Continuous of figure 3 for h/D=1.0
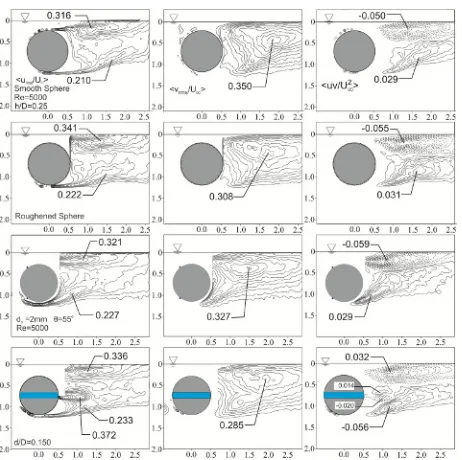
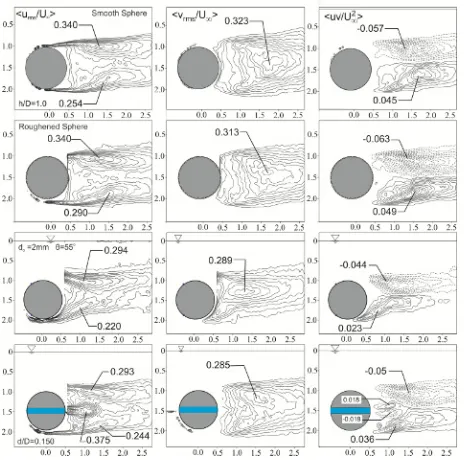
Comparison of time-averaged normalized
streamwise velocity fluctuations <u*rms> (column I), cross-stream velocity fluctuations < *
rms
v > (column II), Reynolds stress correlations
2
U
v'
u'
(column III)around the sphere models for h/D = 0 at Re = 5000 is displayed in figures 3a-d. The rows show flow structures of four sphere models for smooth sphere (top row), roughened sphere (second row), sphere with 2 mm o-ring (third row) and sphere with a hole (bottom row). Comparison of distributions of the time-averaged streamwise rms fluctuating velocity components, <urms/U∞>, is illustrated in left column of figure 3 as a
EFM 2012
fluctuations, <urms/U∞>, at h/D = 0.5 increases for all
submerging elevations, h/D, due to dissipation of eddies. For the case of h/D = 1.0, as seen, the variations of the streamwise fluctuating velocity, <urms/U∞>, are still
unsymmetrical condition in all vertical cross sections, h/D while indicating the decrease of free surface effects on the wake structure.
The rate of entrainment due to the high rate of circulatory flow motion of vortical flow structure close to free-stream region for h/D = 0.1 and 0.25 is extremely high which results in causing unstable wake flow structures. For h/D = 0, only streamwise velocity fluctuations of the lower shear layer are formed whereas two peak points of streamwise velocity fluctuations occur due to the flow separation from the upper and lower shear layers for h/D = 0.1. For h/D = 0.25, the peak magnitude of the streamwise velocity fluctuations <
u
*rms>, of the upper shear layer is 0.316, while that of the lower shear layer of the sphere is 0.210, respectively. At the submerging ratio of h/D = 1.0, peak magnitudes of the streamwise velocity fluctuations <u
*rms>, are slightly higher than the other positions. The rms streamwise velocity patterns, <u
*rms>, have detectable double peaks at almost equal distances in the upper and lower wake regions of the centerline of the sphere. A global view on the asymmetry in the intensity of the time-averaged stream-wise velocity fluctuations show a thinning of the upper shear layer and a thickening of the lower shear layer due to the influence of the water free-surface.The, <v
*rms> distribution has a peak value at approximately merging point of the shear layer around the sphere for h/D = 0.5 and 1.0. The <v
*rms> increases rapidly until the peak point and decreases slightly to reach the free-stream flow condition for h/D = 1.0. In the first and second columns of figure 5, cross comparison of the results reveals the existence of double peaks for <u
*rms> placed in the shear layers while a single peak is observed in <v
*rms> with a maximum for h/D 0.25.To reveal the relative effects of h/D ratio on the wake of the sphere and free-surface interactions, Reynolds stress correlations 2
U v'
u' are presented in
the third column of figure 3. In the effect of the free-surface flow, Reynolds stress correlations of flow past a sphere are formed asymmetric about the centerline of the sphere wake with negative and positive peak values. This
asymmetric distribution of Reynolds stress
correlations
2
U v'
u' is formed with the effect of the free-surface flow in close proximity. For h/D = 0, only positive Reynolds stress occurs on the lower shear layer. As the submerging ratio is increased to h/D = 0.25, besides the large-scale cluster of the
2
U v'
u' with a
positive and negative values, there are two additional clusters with positive and negative values located downstream of the sphere base of the ventilation hole for Re = 5000. This situation occurs as a result of different behaviors of the jet-like flow through the ventilation hole.
Reynolds stress correlations 2 U v'
u' for h/D = 1.0
point out that there are no small-scale concentrations in the wake region of the sphere due to the very small magnitudes of the oscillations in that region as a result of separation around the periphery of the sphere. On the other hand, distributions of the
2
U v'
u' which
resemble the same behaviors of the flow stated above for other flow structures do not form symmetrical shape. A
cluster and a maximum value of
2
U v'
u' occur on the
upper section of the sphere and along the shedding shear
layer. The magnitude of Reynolds stress
correlation
2
U v'
u' keeps its strength due to the high
rate of entrainment between wake and core flow regions, and then it decays down while the vortical flow travels in the downstream direction. This feature is consistent for all values of the sphere locations and for the sphere models.
Fig. 7. Comparison of time-averaged normalized streamwise velocity fluctuations <u*rms> (column I), cross-stream velocity
fluctuations < * rms
v > (column II), Reynolds stress correlationsu'v'U2 (column III) around the sphere models
for h/D = 0 at Re = 5000. The rows show flow structures of four sphere models for smooth sphere (top row), roughened sphere (second row), sphere with 2 mm o-ring (third row) and sphere with a hole (bottom row). The minimum and incremental levels of the flow patterns are taken as│<u*rms>│min = 0.075, <u*rms>
= 0.025, │< * rms
v >│min = 0.050, <v*rms> = 0.025.
│u'v'U2│
min = 0.004 and
2
U v'
u' = 0.004.
EPJ Web of Conferences
the momentum transfer from the free-stream flow into the wake region due to pressure difference between the wake and free-stream flow. Positive and negative small scale Reynolds Stress correlations occur at the exit region of the vent hole and their magnitudes are always less than half of the larger scale one. When compared to the smooth sphere case, sphere with the vent is found to be better performing as a vortex suppression device even though the Reynolds number is in the subcritical range. Reynolds stress patterns produce the maximum Reynolds stress region closer to the base of the sphere with 2mm o-ring at 55o than that of the smooth sphere, although their magnitudes do not differ considerably.
It is observed that for small submerging elevations the recirculation region on the half-upper side of the wake region is larger than that one on the half-lower side of the wake region. On the other hand, the half-upper side of the wake region is under influence of the high kinetic energy of free-surface more than half-lower side of the
wake region. The turbulence Reynolds stress
characteristics indicated that by decreasing the submerging elevation the vortex formation mechanism developed in the streamwise direction on the half-lower side of the wake region is more significant than on half-upper side of the wake region. It is indicated that the reverse flow region in the wake is significantly reduced and the motion in that region also becomes weak owing to the roughened surface or o-ring. Surface roughness or o-ring induces a turbulent boundary layer on the sphere surface because turbulent boundary layer flow has a larger momentum than laminar boundary layer flow and thus delays separation. However, their critical magnitudes are not changed significantly. Another important point is that the peak concentrations of Reynolds stress occurred very close to the saddle points for both the smooth and roughened sphere cases. Peak values of the positive Reynolds stress correlations decrease for the roughened sphere case due to the retarded separation point.
Fig. 8. Continuous of figure 7 for h/D = 0.25
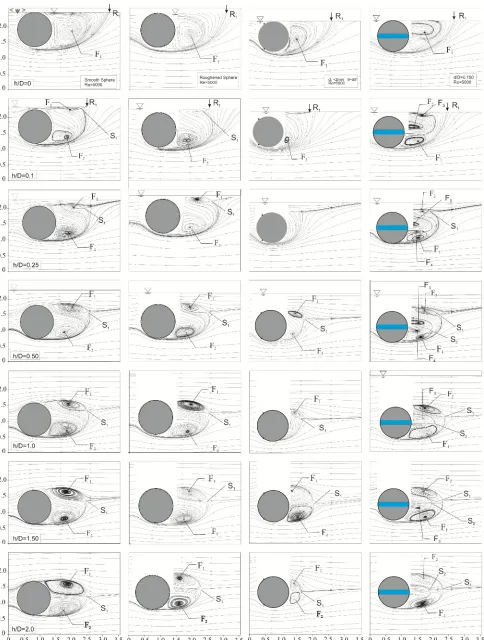
Comparison of time averaged streamline patterns around sphere placed near free-water surface for a smooth sphere (column I), roughened sphere (column II), a sphere with 2 mm o-ring (column III) and a sphere with a vent hole (Column IV) for 0 ≤ h/D ≤1.5 at Re = 5000 are presented in figure 4. The locations of reattachment and saddle point are not clearly defined by the instantaneous velocity vectors V, because the point of the reattachment moves forward and backward randomly due to the instability of the vortical flow structure. Therefore, time-averaged streamline patterns <Ѱ> are calculated and shown in figure 4 and locations of critical points are given in table 1.
The time-averaged streamline topology for all arrangements in figure 4 is displayed and interpreted in terms of foci, F, and saddle points, S. The junction point of the streamlines separated from the rear surface of the sphere that is called as saddle point and denoted with “S” which shows the merging point of the shear layers emanating from the periphery of the sphere. The reattachment point of the streamlines separated from the lower section of the sphere to free surface is denoted with “R”. Locations of foci designated with “F1, F2 andF3” that
are rolling in the clockwise and/or in counter clockwise with respect to the central axis of the sphere exhibit well-defined critical points and they indicate the evidence of three-dimensional flow. For the case of the sphere touching the free-surface of the water at h/D = 0, a large circulation region designated as F1 which is entrapped by
shear layer separated from the lower section of the sphere forms and covers whole the wake flow region.
Fig. 9. Cotinuous of figure 7 for h/D = 0.50
For the sphere with a ventilation hole, the wake region with foci F1 and F2 are identifiable, and then the
two foci F3 and/or F4 are formed. This interaction affects
EFM 2012
slightly towards the rear surface of the sphere as seen in figure 3. The near-wake recirculation region for the passively controlled sphere models shrinks considerably while a complex evolution of vortex structures in the near wake maintains. The second saddle point, S2, occurs due
to the ventilation effect for h/D ≥ 1.0.
Fig. 10. Continuous of figure 7 for h/D = 1.0
For the submerging ratio h/D = 2.0, the wakes of smooth, roughened and vented spheres changes slightly whereas the wake of the sphere with 2 mm o-ring decreases the wake region dramatically due to the delayed flow separation around the sphere as seen in the bottom row of figure 4. The lower recirculation region is wider in length and shorter in weight than the upper one due to the free-surface effect. For the sphere with ventilation hole case two large-scale and one small scale recirculation regions form in the wake region in streamwise direction. In contrast to other sphere cases, there is a decrement in the wake region of the controlled sphere with 2 mm o-ring with a retarded separation location. The flow structure in wake region of the sphere with 2 mm o-ring at 55° is significantly modified by passive control application and hence the distance between the sphere center and saddle point, S1, decreases
as seen from streamline patterns <Ѱ> in figure 4 as well as in table 1.
Table 1. Comparison of the locations of reattachment points (R) and saddle points (S) that are displayed in figure 4 for Re = 5000. Here, x is the distance between the sphere center and
locations displayed by small image below the table.
Submerging Ratio Smooth Sphere <Ѱ> (Δx/D) Roughened Sphere <Ѱ> (Δx/D) Sphere with an o-ring, d0 = 2 mm
<Ѱ> (Δx/D)
Vented Sphere dh/D = 0.15
<Ѱ> (Δx/D)
h/D = 0 R1
(1.68) R1 (1.41) R1 (1.30) R1 (1.45)
h/D = 0.1
R1 (1.10) S1 (0.88) R1 (0.90) S1 (0.76) R1 (0.89) S1 (-) R1 (1.37) S1 (-)
h/D = 0.25 S1
(0.86) S1 (0.80) S1 (-) S1 (0.92)
h/D = 0.50 S1
(1.03) S1 (0.96) S1 (0.51) S1 (0.99)
h/D = 1.0 S1
(1.08) S1 (1.14) S1 (0.36) S1 (1.06)
h/D = 1.50 S1
(1.03) S1 (1.08) S1 (0.74) S1 (1.07)
h/D = 2.0 S1
(1.10) S1 (0.93) S1 (0.38) S1 (0.99)
For the higher submerging ratios h/D ≥ 0.1, more than one focus occur, two foci F1 and F2 in the
EPJ Web of Conferences
Fig. 11. Comparison of time averaged streamline patterns around sphere placed near free-water surface for a smooth sphere (column I), roughened sphere (column II), a sphere with 2 mm o-ring (column III) and a sphere with a vent hole (Column IV) for
EFM2012
4 Conclusions
Examining of the experimental results of flow-structure interaction between a sphere wake and free-surface for both the smooth and passively controlled spheres yields the following results.
-The PIV measurements in the streamwise plane passing through equator of the sphere has quantitatively and qualitatively demonstrated the turbulent structures of the sphere wake such as recirculating flow, shear layer instability, vortex roll-up, and small-scale turbulent eddies.
-The results of the flow visualization show clearly a significant change of the wake structure at different submerging ratios for the sphere models. The flow patterns show that the effects of the flow interference caused by the free-surface of the water are severe when the submerging ratios are small. The concentration of small scale vortices (eddy) covers wake region of the sphere models. The rate of entrainment due to the high rate of circulatory flow motion of vortical flow structure is extremely chaotic which results in causing unstable wake flow structures.
-It is observed that the reverse flow region in the wake is significantly reduced and the motion in that region also becomes weak owing to the roughened surface or o-ring on the sphere surface.
-Surface roughness or o-ring induces a turbulent boundary layer on the sphere surface because turbulent boundary layer flow has a larger momentum than laminar boundary layer flow and thus delays separation.
-The modified flow structure of the near wake of the vented sphere causes the occurrence of a pair of counter-rotating ring vortices, which have the effect of aerodynamically streamlining wake structure.
- Reynolds stress correlations revealed that the interaction between the fluctuated streamwise and fluctuated transverse velocities is strong on the half-lower side of the wake region resulting the high mixing of flow. -In general, vortex formation lengths for the sphere with the modified surface of the sphere are shorter than the smooth sphere case.
-It is found that the submerged portion of the sphere influences the instability of the vortical flow structure, significantly.
-The shedding location of the large-scale vortices rotates slowly and irregularly, and they rotate at random about the stream-wise axis when they travel downstream for all sphere models.
-The effect of the free surface due to the present of the sphere models continue until the h/D = 0.50. As the distance between the free surface and the bottom side of the sphere increases, the reattachment point to the free surface goes further upstream for h/D = 0, which is changed in the range of 1.30≤ x/D ≤1.68 for all sphere models.
-Examination of the obtained results reveals that the rate of interaction between the free surface and the wake structure downstream of the four sphere models becomes less for the sphere with the o-ring by increasing the submerging elevation, the rate of this interaction
decreases for all sphere models. At the submerging elevation of h/D = 2.0, the free surface effects are minimum and beyond h/D = 2.00 it may be assumed that these free surface effects disappear as demonstrated by streamline topology.
- The lower recirculation region is slightly longer and wider than the upper one in length whereas lower recirculation region is larger than the upper one in circulation shape and size.
-The separated flow around the passively controlled sphere models is strongly affected and the flow separation around the sphere is delayed.
- The jet flow exiting from the vent moves in longitudinal direction and stirs the wake flow region to increase the entrainment to a higher level as clearly seen for the right column images of figures 2-4.
- The roughened surface causes local flow separation and triggers the shear layer instability along the separating shear layer, resulting in the generation of large turbulence intensity on the sphere surface and hence the flow reattaches to the sphere surface with a high momentum near the wall and overcomes a strong adverse pressure gradient formed in the rear sphere surface.
-According to the obtained results, the sphere with o-ring controls flow structure better than the others. As shown, the saddle point locations “S1” for the sphere with 2mm
o-ring become closer to the rear surface of the sphere in a smaller size which is clear evidence of passive control results in the flow structure.
- Experimental data obtained here can serve the goal of validation of turbulence models used in numerical simulations and in predicting bluff body flows in the sub-critical regime.
-As a conclusion, it is indicated that interaction between the free-surface motion and the wake structure downstream of the sphere models depends strongly on the submerging elevation of the sphere.
Acknowledgment: The authors would like to
acknowledge the funding of The Scientific and Technological Research Council of Turkey (TUBITAK) under contract No:109R028, Scientific Research Projects Office of Cukurova University Contract No: AAP20025, Selcuk University’s Scientific Research Project Office Contract No: 11101032 and DPT project Contract No: 2009K12180. This study is prepared from Master of Science Thesis of Sercan Dogan.
References
1. R. Hassanzadeh, B. Sahin, M. Ozgoren, Ocean Eng. 54, 213–222 (2012).
2. M. Ozgoren M., B Sahin, E. Pınar, H. Akilli, 5. Ankara
Int. Aerospace Conf., AIAC-2009-012 (2009). 3. M. Ozgoren, S. Dogan, A.Okbaz, B. Sahin, H. Akıllı,
18. National Thermal Science and Tech. Conf., (in Turkish) (2011a).
4. M. Ozgoren, S. Dogan, A. Okbaz, B. Sahin, H. Akilli,
Eur. Phys. J. Appl. Phys., DOI:
EPJ Web of Conferences
5. M. Ozgoren, S. Dogan, A. Okbaz, B. Sahin and H. Akilli, 6th Int. Ege Energy Symposium & Exhibition, (2012a).
6. M. Ozgoren, S. Dogan, A. Okbaz, B. Sahin and H. Akilli, Int. J. of Arts & Sciences Conf. (IJAS), (2012b).
7. M. Ozgoren, A.Okbaz, A. Kahraman, R. Hassanzadeh, B. Sahin., H. Akilli, S. Dogan, 6th Int. Advanced Tech. Symposium,ETE-50 (2011c).
8. M. Ozgoren, A. Okbaz, S. Dogan, A. Kahraman, R. Hassanzadeh, B. Sahin, H. Akilli, 6th Int. Advanced Tech. Symposium, ETE-53 (2011d).
9. M. Ozgoren M., B Sahin, E. Pınar, H. Akilli, Int. J. of Heat Fluid Flow, 32, iss. 6, 1138-1146 (2011e). 10. R. Hassanzadeh, B. Sahin, M. Ozgoren, Int. J. of
Computational Fluid Dynamics 25, Iss.10, 535-545 (2011).
11. M. Ozgoren, A. Okbaz, S. Dogan, B. Sahin, H. Akilli,
Exp. Thermal and Fluid Science,
http://dx.doi.org/10.1016/j.expthermflusci.2012.05.014 (2012c).
12. Y. Jang, Y.II , S.J. Lee, Exp. in Fluids. 44: Issue 6, 905-914 (2008).
13. G. Yun, D. Kim, and H. Choi, Vortical structures behind a sphere at subcritical Reynolds numbers, Phys. Fluids Volume 18, 015102 (2006).
14. T. Leweke, M.Provansal, Ormie`res, Lebescond R., Phys. of Fluids, 11: Issue 9, 12, (1999).
15. S. Taneda, J. of Fluid Mech., 85:1, 187–192 (1978). 16. H. Sakamoto, H.Haniu, J. of Fluids Eng., 112, 386–392
(1990).
17. E. Achenbach, J. of Fluid Mech., 62:2, 209–221, (1974).
18. J.S. Wu, G.M. Faeth, AIAA Journal, 3: Issue.8, 1448– 1455 (1993).
19. G.K. Suryanarayana, A. Prabhu, Exp. in Fluids, 29:6, 582–591 (2000).
20. G.K. Suryanarayana, G.E.A. Meier, Exp. in Fluids, 19, pp.78-88 (1995).
21. G.K. Suryanarayana, H. Pauer, GEA Meier, Exp. Fluids, 16, 73-81 (1993).
22. H.J. Kim, P.A. Durbin, Phys. Fluids 31, p:3260–3265 (1988).
23. M. Kiya, H. Ishikawa, H. Sakamoto, J. Wind Eng. Ind. Aerodynamics, 89, p:1219–1232 (2001).
24. T. Maxworthy, J. Appl. Mech., 36, p:598 (1969). 25. S. Jeon, J. Choi, W. Jeon, H. Choi and J. Park, J. Fluid
Mech., 517, p:113–129 (2004).
26. K.N. Alammar, 22nd Appl. Aerodynamics Conf. and Exhibit, (2004).
27. V. Bakic, Thermal Science, 8 No.1, p:63 – 81, 2004. 28. I. Hadzic, V. Bakic., M.Peric, V.Sajn, F.Kosel, Eng.
Turbul. Model Exp., 5, pp.667–676 (2002).
29. J. Choi, W. Jeon and H. Choi, Phys. of Fluids, 18, 041702 (2006).
30. R.A. Kumar, C.H. Sohn and B:H.L. Gowda, Recent Patents on Mech. Eng., 1, 1-11 (2008).
31. K. Aoki K., Y. Kinoshita, J.Nagase, Y. Nakayama, J. of Visualization, 6, No.2, pp.185-193 (2003a).
32. K. Aoki., A. Ohike, K.Yamaguchi, Y.Nakayama, J. of Visualization, pp.67-76 (2003b).
33. M. Gad-el-Hak M., Appl. Mech. Review, 49, pp.365-379 (1996).
34. J.C. Owen, P.W. Bearman, J. of Fluids and Structures
15, pp.597-605 (2001).
35. Q. Wei, R. Lin, Z. Liu, Fluid Dynamics Research, 3, No.1-4, pp.231-237 (1988).