Prediction Model For Risk Of Breast Cancer
Considering Interaction Between The Risk
Factors
Nabila Al Balushi
Abstract: This paper focuses on expansion of Barlow’s predictive model in which a large data set of 2,392,998 eligible screening mammograms taken
from Breast Cancer Surveillance Consortium which was previously used by Barlow in 2006 to predict a diagnosis of breast cancer in women through including interaction of exploratory variables. 12 explanatory variables that are assumed to influence the risk of developing breast cancer in women and they are :age, breast density, menopause status, race, Hispanic, BMI ,number of first degree relatives with breast cancer, previous breast procedure, age at first birth, surgical menopause, results of last mammogram, and current hormone therapy. Forward selection method was used to select the best predictive model including significant interaction terms. The results showed 33 interactions were included in the new model through forward selection procedure improved the predictive model. However, only 10 interaction terms were found to be significant across all levels of the risk factors. Also, the updated predictive model was found to better than the main effect model, as the AIC value decreased.
Keywords: Interaction, Predictive model, AIC, GLM, Likelihood, Correlation, risk
————————————————————
1.
I
NTRODUCTIONBreast cancer is the most common cancer in women in the United Kingdom, accounts for about one third of cancers in women. [1] It is also the third most common cause of cancer death in the UK after lung and large bowel cancer. Every year, about 12,000 persons die from breast cancer, which is equivalent to one person every ten minutes.[5] Moreover, UK has the 11th highest rate of breast cancer among other European countries according to the World Cancer Research Fund.[4] There are several risk factors which can develop breast cancer, but three main risk factors are : gender, getting older and family history. Age is considered the highest risk factor, as age increases the probability of breast cancer goes up [10]. In 2011, the majority of women who were diagnosed breast cancer in UK were over 50 years old.[8]
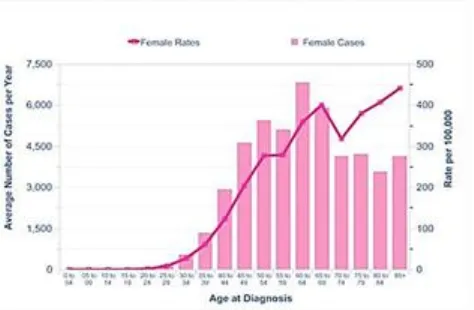
For that reason, every three years all women who are 50-70 years old invited for breast cancer screening. Mammographic screening is the available screening method, in which x-rays images are taken in order to detect early breast lesion. Figure 1 illustrates the rates of breast cancer across age groups in the year 2007/2008. [5] Overall, it is clear that the rate of breast cancer is strongly related with age as the highest rates being in older group. However, a dip occurred after age 70 which could be due to screening program.
Figure 1: Rates of breast cancer across age group in 2007/2008 [5]
_______________________
Nabila Al Balushi
Department of Mathematics and Statistics,
The most commonly and widely tool used for predicting risk of developing breast cancer is "Breast Cancer Assessment Tool". It is an interactive tool which is also known as "Gail score". Gail model was developed in 1989 by Mitchell Gail based on data collected from Breast Cancer Detection Demonstration project in which 2852 cases and 3146 controls were used to form the model. Gail model's tool uses information that can be entered by women via online questionnaire and it consists of eight primary questions for which the probability of breast cancer is calculated based on the information given. The information includes variables such as age, age at first period, age at first birth, number of first degree relatives with breast cancer[mothers, sisters, daughters], and previous breast biopsy. This tool is updated periodically as new research about the risk factors becomes available. Although Gail model has been validated in population prospective, it some major concern.[4] Gail model may not consider all risk factors because the online questionnaire includes only 8 primary questions. Hence, a vast amount of research has been conducted to develop a better model than Gail model.[4] Several studies have been focusing on risk factors affecting breast cancer. A study was done by Barlow in 2006 in order to identify the most significant risk factors and to discover a new model which help to predict the risk of breast cancer instead of Gail model.[8] Barlow used the dataset of 2,392,998 eligible screening mammograms from women who had not diagnosed previously with breast cancer. He realized that the risk factors varied between pre-menopausal women and post-menopausal women. So, separate logistic regression models were constructed for pre-menopause women and post-menopause women. The results showed that age, breast density, race, family history of breast cancer, and previous breast procedure were the most significant risk factors among pre-menopausal women. For post-menopausal women the factors that were statically significant were: age, breast density, race, ethnicity, family history of breast cancer, previous breast procedure, body mass index, natural menopause, hormone therapy, and prior false positive mammogram. To overcome the issue of over fitting, 75% of the datasets were classified randomly as training sample and 25% as
validation sample. Training sample was used to obtain the estimates derived from the model. Validation sample was used to test the predictive model with estimates derived from the model of training sample. Despite the fact that the risk prediction model for breast cancer can be improved by including the risk factors that were found from this study and it may also identify high risk women better than Gail model. Moreover there were some limitations in the use of Barlow's model in predicting the risk of breast cancer. First, there were large number of missing data but they were included in the analyses as separate category which has the potential to bias the estimates. Second, the study did not took into account the interaction between the risk factors. This study aims to improve Barlow's model for predicting the risk of breast cancer by taking into consideration the interaction between the risk factors. So, the main aims of this study are the following:
1) To identify the most important factors and interaction of risk factors for breast cancer
2) To develop a good predictive model for breast cancer including interaction terms.
2.
M
ETHODOLOGYwere used to examine the features of the risk factors. First, marginal probability was plotted for each of the risk factor. Second, correlation plot was produced to measure the association between the risk factors. Then, interaction plots were also generated to see the effect of marginal probability of a risk factor on the levels of another risk factor. All the plots in this study were produced using different packages in R. Logistic regression model is used for relating binary response variable with a set of explanatory variables, which can be discrete or continuous. In general, the logistic regression model with explanatory variable 𝑋 is written as follows:
𝑙𝑜 𝑔 (1 − 𝑝𝑝𝑖
𝑖) = 𝛼 + 𝛽𝑋 (1)
Where, pi is the probability of an event i, β is vector of
regression coefficients and X is vector of covariates.[9] The response variable in this study is ―cancer outcome‖, whether a women has cancer or not and the risk factors are used as covariates.
3.
S
TATISTICALA
NALYSES3.1 Marginal probability plot for each risk factor.
The marginal probability of developing breast cancer was calculated for each risk factor through dividing the sum of breast cancer cases by the overall sum of observations and the 95% confidence interval was calculated by using the following equation:
𝑝̂ ± √𝑝̂ (1 − 𝑝̂ )
𝑚 ( )
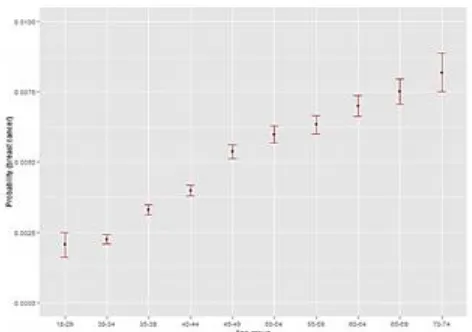
Where, p estimates the probability of breast cancer in women in each combined group and m counts the total number of observation in each combined group.[11] Since age is known as the most important risk factor, it might be useful to see the effect of age in developing breast cancer.[10] It can be clearly seen from Figure 2 that the risk of breast cancer increases with age i.e. the probability of developing breast cancer goes up as women get older. Women aged between 70-74 have the highest risk of breast cancer compared to other age groups. Looking at the width of confidence interval, it is clear that for old and young age group the width of confidence interval is wider compared to middle age
group. This suggests that the majority of women in this study are from middle age group.
Figure 2 Marginal probabilities of breast cancer according to age group
The graph below compares the probability of breast cancer in four different categories of breast density in the study population. It can be noticed clearly that the group with ―Hetro‖ have the highest risk of developing breast cancer followed by Unknown group and women with dense breast. On other hand, the women with "Fat" breast density are less likely to have breast cancer in comparison to other groups. It can be also assumed that the high probability for Unknown breast density could be because missing data are from ―Hetro‖ or ―Dense‖ group. (Figure 3)
Figure 3 Marginal probabilities of breast cancer according to breast density
illustrated in Figure 4. Women who do not have breast procedure previously have lowest chance of developing breast cancer. The confidence interval for women who does not have previous breast procedure is the narrowest, which suggests that most women are classified in this group.
Figure 4: Marginal probabilities of breast cancer according to previous breast procedure
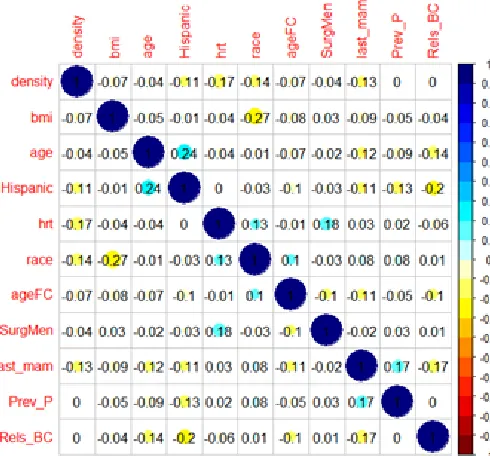
3.2 Correlation plot between the risk factors Correlation is the most common approach used to measure the association between variables. So, to see the nature of correlation between explanatory variables, a matrix plot was created as detailed in Figure 1. As it can be identified that age is negatively correlated with number of first degree relative with breast cancer. The value of the correlation coefficient between these two ordinal variables is -0.14, which suggests weak negative correlation between them. It is also an indication that older group of women have less number of relatives with breast cancer and younger group have more. Similar strength of association can be found between age and last mammogram results. The value of the correlation between age and Hispanic is 0.24 which suggests a moderate correlation between them. There is also a moderate correlation between surgical menopause variable and hormone therapy. Race is also moderately correlated with body mass index. In general, no strong association was found between the risk factors.
Figure 5: Correlation plot for explanatory variables
3.3 Interaction plots between the risk factors Interaction plots of two variables are used in order to show the marginal probabilities of one variable plotted by the levels of other variable. The graphs of 10 most significant interaction terms were plotted using effect package in R. The graph for the interaction between age at first child and surgical menopause shows that women with surgical menopause have the highest probability of developing breast cancer for group of women with no birth. Women with "unknown" category in surgical menopause variable are less likely to develop breast cancer compared to other category regardless their age at first child.
Similarly, the graph for the interaction between age and breast density does not appear to show a parallel relationship. The graph shows that women in dense group act differently in contrast to other levels of breast density variable. The risk of breast cancer in dense group is high between the age 50-54 and it is lower between age 55 to 69 compared to other age group (Figure 7a). Also, there appears to be an interaction between probabilities of developing breast cancer for variable of previous breast procedure across different races. The chance of developing breast cancer in women who had previous breast procedure is high regardless of race (Figure 7b).
Figure 6b: Relatives with breast cancer and previous breast procedure interaction
Figure (8a) shows that women with group of "no" previous breast procedure have lower probability of breast cancer for group with previous negative mammogram results group compared to those who were identified to have false positive results in previous mammographic screening. The interaction between the variable previous breast procedure and number of first degree relatives with breast cancer is visible in Figure (8b). Women who had breast procedure previously have the highest probability of developing breast cancer if they have at least 2 first degree relatives suffered from breast cancer. In contrast women who do not have breast procedure previously have the lowest chance of getting breast cancer if they do not have any first degree relatives suffered from breast cancer. Moreover, the chance of breast cancer in-creases for women who have had previous breast procedure regardless of number of
relatives they have breast cancer as it is evident from the plot.
Figure 7a : Menopause status and previous breast procedure interaction,
Figure 8a: Interaction plot between last mammogram results and Previous breast procedures
Figure 9b: Interaction plot between last mammogram results and Previous breast procedures
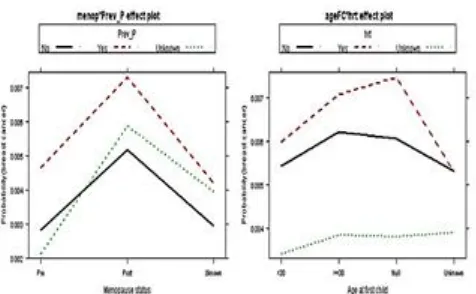
procedure variable. Pre-menopausal women who had previous breast procedure have the highest chance of developing breast cancer (Figure 9a). Also, the marginal probabilities of breast cancer for each category of hormone therapy across all ages of women at first child is plotted to examine the interaction between them. The graph suggests that women who use hormone therapy have highest chance of getting breast cancer regardless their age at first child. The chance of developing the disease increases as the age of women at first child increases for those who did not use hormone therapy (Figure 9a).
Figure 9a: Interaction plot between menopause status and Previous breast procedures
Figure 9b: Age at first child and hormone therapy interaction
The graph of interaction between BMI and hormone therapy shows that Women in group of without hormone therapy appear to have higher probability of breast cancer for women with body mass index of 30-34.99 and >35, but the risk of breast cancer in women with current hormone therapy decreases as the BMI score
increases(Figure 10). On other hand, the graph of interaction between surgical menopause and hormone therapy shows that women in "natural" menopause category have highest risk of developing breast cancer with current hormone therapy users.
Figure10: Interaction plot between BMI and hormone therapy(Left) ,Surgical Menopause and hormone therapy
(Right)
According to Figure 11, there is a visible interaction between previous breast procedure and hormone therapy. High risk of developing breast cancer was found in women who had breast procedure and currently using hormone therapy. Women with ―Unknown" category group in hormone therapy variable was the lowest across all levels of previous breast procedure variable.
Figure 10: Interaction plot between previous breast procedure and hormone therapy
3.4 Model selection
𝐴𝐼𝐶𝑃= 𝑙(𝑀) + 𝑝(𝑀) (4)
Where, l(M) is the log likelihood function of the parameter in model M evaluated at the maximum likelihood estimator and p is the number of parameters in the model. Thus the AIC measures two components: it reflects the model fit through the log likelihood function, where a small value of log likelihood function suggesting a worse fit of the model. Second, it measures the complexity of the model through number of parameters and hence when the complexity increases, the model will be more capable to adapt the characteristics of the data. [6][9] The starting model is the main effects model that contains all variables that were found to be significant from previous study and it can be written in the form:
𝑙𝑜 𝑔 (1 − 𝑝𝑝𝑖
𝑖) = 𝛽𝑜 + 𝛽1𝑥1𝑖+ 𝛽2𝑥2𝑖+ ⋯ + 𝛽12𝑥12𝑖 (3)
Where, pi is the probability of breast cancer in the combined group i, βiis the regression parameter,
x1=menopausal status, x2=age, x3=density of breast,
x4=race, x5=Hispanic, x6=body mass index, x7=age of
women at first child, x8=number of first degree relatives with breast cancer, x9=previous breast procedure,
x10=last mammogram results, x11=surgical menopause,
and x12=current hormone therapy. This full model was
used to predict the probability of developing breast cancer. The results from main effect model showed that at least one level of each risk factor has a significant impact on breast cancer risk. The GLM output for the main effect model is displayed in table1.
Table 1 GLM output of main effect model
However, this model could be improved by suggesting potential interaction terms which may provide a better predictive model than main effects model. So, this paper aims to improve Gail model by taking into account the interaction terms. Forward stepwise regression is used starting with main effects model. Then, interaction term added sequentially to the main effects model based on lowest AIC value. The process continues until none of the remaining interactions cause an improvement to the
model. After treating age as a continuous variable as a polynomial of degree 2, the main effect models has an AIC of 52730. Whereas, the model which includes interaction terms has an AIC of 52446. This indicates that model with interaction terms is better predictive model than the main effects model. And the best predictive model was found to have 33 significant interaction terms which was found using forward selection of interaction terms. The process is shown in table below where the AIC is shown after adding each interaction term. The first interaction term was found to be significant is the interaction between body mass index and current hormone therapy of a woman. Including this interaction term reduce the AIC value to 52684 and so on. Also, the deviance value dropped from 37582 to 37122, which indicates the updated model is better than the main effect model. [1] Table 2 illustrates forward selection procedure displaying
Table 2: Forward selection output for first 10 interaction terms
NO Interaction term AIC Deviance 1 +BMI: Hormone therapy 52684 37382
2 +Age: Density 52647 37337
3 +Age at first child: Surgical Menopause 52623 37302 4 +Surgical Menopause: Hormone therapy 52606 37276 5 + Race: Previous breast procedure 52589 37239 6 + Last mammogram: Previous breast procedure 52570 37212 7 +Relatives with breast cancer: Previous breast procedure 52548 37178
8 +Age: Race 52536 37156
9 +Age: Last mammogram results 52523 37139 10 +Previous breast procedure: Hormone therapy 52514 37122
Moreover, to test if the interaction term contributes to the model, we compare the additive model (simple model) with multiplicative model (complex model) for each of the interaction term. So, we test the null Hypothesis: Simple model is better against the alternative Hypothesis: model with interaction term is better. [12] The p values for testing all 10 interaction terms are displayed in table 3. The p-value between the interaction of BMI and hormone therapy is 0.0000000007, which is highly significant, and therefore it can be concluded that an interaction is
present between these two terms. Also, the p-value between the additive model and multiplicative model also showed that there is significant improvement in the model after adding the interaction term of age and density(p-value=0.00002579). However, age variable was treated as polynomial with degree 2 in order to improve the model.
Table 3 The 10 most significant interactions
So the GLM equation after adding the significant interaction term can be written as:
𝑙𝑜 𝑔 ( 𝑝𝑖𝑗
1 − 𝑝𝑖𝑗) = 𝛽𝑜 + 𝛽1𝑥1𝑖+ 𝛽2𝑥2𝑖+ ⋯ + 𝛽12𝑖𝑗𝑥12𝑖
+ 𝛽13𝑖𝑗𝑥11𝑖𝑥12𝑗+ 𝛽14𝑖𝑗𝑥7𝑖𝑥12𝑗+ 𝛽15𝑖𝑗𝑥11𝑖𝑥12𝑗
+ 𝛽16𝑖𝑗𝑥6𝑖𝑥7𝑗+ 𝛽17𝑖𝑗𝑥4𝑖𝑥9𝑗+ 𝛽18𝑖𝑗𝑥1𝑖𝑥9𝑗
+ 𝛽19𝑖𝑗𝑥2𝑖𝑥3𝑗:𝛽20𝑖𝑗𝑥10𝑖𝑥9𝑗
+ 𝛽21𝑖𝑗𝑥9𝑖𝑥12𝑗 (4)
Where, 𝑝𝑖𝑗 is the probability of breast cancer in women in
group with risk factor of level 𝑖 and level 𝑗 in the other risk factor. Table 4 displays the output generated after fitting equation 4 into the data set. As found earlier from table 1, only some levels of the terms are significant. The AIC for the updated model is 52572 with deviance of 37178 which indicates that adding the interaction terms improved model prediction for estimating the risk of breast cancer. Despite the fact that the predictive model with the interaction terms was found based on AIC values
Interaction term AIC add AIC mul P-Value Age at first
child:Surgical menopause
55310.77 55257.02 3.03e-12 Surgical
menopause:Hormo ne therapy
55163.22 55132.23 Age at first
child:Hormone therapy
55209.6 55180.4 BMI:Hormone
therapy 55232.92 55204.71 Race: Previous
breast procedure 55300.78 55280.2 Menopause:previou
s breast procedure 54648.23 54629.7 2.47e-05 Age:Density 53391.26 53382.26
Last mammogram results: Previous
breast procedure 55293.51 55275.2 Previous breast
procedure: Hormone therapy
54943.74 54927.49 Number of relative
with breast cancer: Previous breast
procedure
of interaction terms. It might be the case that the AIC was identifying those interactions due to their missigness. This was also noticed if we assume that the missing category is not there anymore in the interaction plots of some variables. And hence producing a parallel pattern which suggesting no significant interaction.
Table 4: GLM output after adding the interaction terms
Estimate Standard
. Error P-value
(Intercept)
-6.79691
0.11201
2 0
age1 299.872 36.2958
4
1.43E-16
age2
-5.97866
30.8445 9
0.84630 8
menop1 -0.0212 0.07082 0.76471
menop9 0.00380
7
0.06511
7 0.95338
densityScattered 0.84155
7
0.07833 1
6.35E-27
densityHetero 1.22188
7
0.07802 9
2.87E-55
densityDense 1.28318
6 0.08697
2.88E-49
densityUnknown 1.19173
1
0.07857
7 5.9E-52
raceN-Hisp B -0.2141 0.06122
3 0.00047
raceAsn/PI 0.04441
7
0.05200 7
0.39306 9
raceNat.Am
-0.55418
0.14219 4
9.73E-05 raceHisp 0.07332 - 0.127646 0.565722
raceOther
-0.02458
0.04256 4
0.56366 7
HispanicYes
-0.27601
0.04505 2
8.99E-10
HispanicUnknown
-0.01901
0.03383 7
0.57418 4
bmi25-29.99 0.29263
4
0.05497 5
1.02E-07
bmi30-34.99 0.47553
5
0.06651 8
8.75E-13
bmi>35 0.59667
2
0.08375 7
1.05E-12
bmiUnknown 0.23830
3
0.05133 2
3.44E-06
ageFC>=30 0.17038
8
0.07589 8
0.02477 1
ageFCNull 0.09710
5
0.06752 2
0.15039 8
ageFCUnknown 0.01765 0.04967
7
0.72237 3
Rels_BC1 0.30095
7
0.02569 7
1.11E-31
Rels_BC>=2 0.55458
4
0.08522 7
7.66E-11
Rels_BCUnknown
-0.10538
0.03215 9
0.00104 9 Prev_PYes 0.286341 0.112998 0.011276 Prev_PUnknown -0.2117 0.16146 0.18980
2 last_mamFalse.Pos 0.57900 0.09167
2.68E-2 2 10
last_mamUnknown 0.18785
5
0.02685 2
2.64E-12
SurgMenSurgical 0.01755
4
0.05414 4
0.74577 8
SurgMenUnknown
-0.11459
0.06076 8
0.05934 7
hrtYes 0.43826
7
0.06269 3
2.74E-12
hrtUnknown 0.24464
6
0.09086 8
0.00709 6 ageFC>=30:SurgMenSurgical 0.05743 - 0.137185 0.675508 ageFCNull:SurgMenSurgical 0.04453
5
0.10284 8
0.66500 3 ageFCUnknown:SurgMenSurgical
-0.19698
0.05841 5
0.00074 6 ageFC>=30:SurgMenUnknown
-0.18121 -1.38989
0.16456 4 ageFCNull:SurgMenUnknown 0.15160
6 1.51346 7 0.13016 1 ageFCUnknown:SurgMenUnknow
n 0.08503
1.37409 3
0.16941 3 SurgMenSurgical:hrtYes
-0.18316 -3.26124
0.00110 9
SurgMenUnknown:hrtYes
-0.04264 -0.68832
0.49124 9 SurgMenSurgical:hrtUnknown 0.18589
3
1.64156 1
0.10068 1 SurgMenUnknown:hrtUnknown 0.18296
6
1.94865 3
0.05133 7 ageFC>=30:hrtYes 0.05322
4 0.50567
0.61308 9
ageFCNull:hrtYes 0.11290
6
1.31445 9
0.18869 2
ageFCUnknown:hrtYes
-0.04499 -0.72471
0.46863 3 ageFC>=30:hrtUnknown 0.20133
1
1.42867 7
0.15309 7 ageFCNull:hrtUnknown 0.11199 - -0.984 0.325115 ageFCUnknown:hrtUnknown 0.09435
3 1.24747
0.21222 5
bmi25-29.99:hrtYes
-0.27723 -3.66682
0.00024 6
bmi30-34.99:hrtYes
-0.43203 -4.38987
1.13E-05
bmi>35:hrtYes
-0.35872 -2.82396
0.00474 3
bmiUnknown:hrtYes
-0.21146 -3.11517
0.00183 8 bmi25-29.99:hrtUnknown
-0.23414 -2.87887
0.00399 1 bmi30-34.99:hrtUnknown
-0.45622 -4.19649
2.71E-05
bmi>35:hrtUnknown
-0.52769 -3.74962
0.00017 7
bmiUnknown:hrtUnknown
-0.41554 -6.11078
9.91E-10 raceN-Hisp B:Prev_PYes 0.25994
9
1.95466 9
0.05062 2 raceAsn/PI:Prev_PYes 0.13422 1.3399 0.18027
8 raceNat.Am:Prev_PYes 0.80518
3
2.96653 4
0.00301 2 raceHisp:Prev_PYes 0.60147
6
2.84305 4
0.00446 8 raceOther:Prev_PYes 0.004819 0.07118 0.943254 raceN-Hisp B:Prev_PUnknown
-0.22966 -1.41629
0.15668 9 raceAsn/PI:Prev_PUnknown 0.12853
4
0.44985 9
raceNat.Am:Prev_PUnknown
-0.81206 -2.50539
0.01223 2 raceHisp:Prev_PUnknown
-0.70145 -1.18301
0.23680 6 raceOther:Prev_PUnknown 0.05513
5
0.70581 5
0.48030 3
menop1:Prev_PYes
-0.04767 -0.45331
0.65032 4 menop9:Prev_PYes 0.03764 - -0.26698 0.789482 menop1:Prev_PUnknown 0.18862
2
1.39716 7
0.16236 3 menop9:Prev_PUnknown 0.30041 2.03830
3 0.04152 age1:densityScattered
-64.4893 -1.7358
0.08259 9
age1:densityHetero
-112.606 -3.04948
0.00229 2
age1:densityDense
-145.512 -3.53257
0.00041 2
age1:densityUnknown
-100.974 -2.72828
0.00636 7 age2:densityScattered
-61.3335 -1.91013
0.05611 7
age2:densityHetero
-73.3872 -2.29731
0.02160 1
age2:densityDense
-65.6217 -1.80512
0.07105 6
age2:densityUnknown
-47.4388 -1.4819
0.13836 7 Prev_PYes:last_mamFalse.Pos
-0.24118 -1.77478
0.07593 5 Prev_PUnknown:last_mamFalse.P
os 0.06889
0.36260 9
0.71689 7 Prev_PYes:last_mamUnknown 0.00246
8 0.04745 3 0.96215 2 Prev_PUnknown:last_mamUnkno wn
-0.38125 -4.37344
1.22E-05
Prev_PYes:hrtYes 0.00195
4
0.03805 3
0.96964 5 Prev_PUnknown:hrtYes 0.14683
1
1.27884 5
0.20095 2 Prev_PYes:hrtUnknown 0.06630
2
0.70278 7
0.48218 9 Prev_PUnknown:hrtUnknown 0.15500
7
1.39717 2
0.16236 2
4.
C
ONCLUSIONA binomial generalized linear model was fitted to the study population. Missing values was treated as another category and forward stepwise selection method was used and found that the best predictive model contains 33 interactions between the risk factors but only 10 interaction terns was found to be most significant based on the p values. Age was the most recognised risk factors which has the highest number of interaction with other risk factors. In summary, it was found that including interaction terms in the model improved the model prediction as the AIC values reduced.
REFERENCES
[1]. Anon, (2017). [online] Available at:
http://www.cancerresearchuk.org/cancer-info/prod_consump/groups/cr_common/@nre/@ sta/documents/generalcontent/018070.pdf [Accessed 22 Jun. 2017].
[2]. Barlow, W. E., White, E., Ballard-Barbash, R., Vacek, P. M., Titus-Ernsto , L., Carney, P. A., Tice, J. A., Buist, D. S. M., Geller, B. M., Rosenberg, R., Yankaskas, B. C., and Kerlikowske, K. (2006). Prospective breast cancer risk prediction model for women undergoing screening mammography. JNCI Journal of the National Cancer Institute, 98(17):1204{1214}.
[3]. Bellcross, C. (2009). Approaches to applying breast cancer risk prediction models in clinical practice. Community Oncology, 6(8), pp.373-382.
[4]. Bondy, M. and Newman, L. (2006). Assessing Breast Cancer Risk: Evolution of the Gail Model. JNCI Journal of the National Cancer Institute, 98(17), pp.1172-1173.
[5]. Breast Cancer Care. (2017). Press pack: Facts and Statistics 2015. [online] Available at: https://www.breastcancercare.org.uk/about- us/media/press-pack-breast-cancer-awareness-month/facts-statistics [Accessed 22 Jun. 2017].
[6]. Burnham, K. and Anderson, D. (2010). Model selection and multimodel inference. New York, NY [u.a.]: Springer.
[7]. Chalabi, M. (2017). Breast cancer: worldwide and UK trends. [online] the Guardian. Available at:
[8]. Nhs.uk. (2017). Breast cancer (female) - Diagnosis - NHS Choices. [online] Available at: http://www.nhs.uk/Conditions/Cancer-of-the-breast-female/Pages/Diagnosis.aspx [Accessed 22 Jun. 2017].
[9]. Salkind, N. (2007). Encyclopedia of measurement and statistics. Thousand Oaks [u.a.]: SAGE.
[10]. Surakasula, A., Nagarjunapu, G. C., & Raghavaiah, K. V. (2014). A comparative study of pre- and post-menopausal breast cancer: Risk factors, presentation, characteristics and management. Journal of Research in Pharmacy
Practice, 3(1), 12–18.
http://doi.org/10.4103/2279-042X.132704
[11]. Usersfsu.edu. (2017). Logistic Regression.
[online] Available
at:http://userwww.sfsu.edu/efc/classes/biol710/lo gistic/logisticreg.htm [Accessed 20 Jul. 2017].