Experimental investigations and numerical simulations of methane
cup-burner flame
P. Bitala1, M. Kozubková2, P. Kadeřábek3, V. Nevrlý1,4, J. Dlabka1, E. Kozubek5, O. Štěpánek2, M. Bojko2, P. Kubát6 and Z. Zelinger6
1
VŠB-Technical University of Ostrava, Faculty of Safety Engineering, Lumírova 13, 700 30 Ostrava-Výškovice, Czech Republic
2
VŠB-Technical University of Ostrava, Faculty of Mechanical Engineering, 17. listopadu 15, 708 33 Ostrava-Poruba, Czech Republic
3
Česká spořitelna, a.s., Olbrachtova 1929/62, CZ-14 000 Prague 4, Czech Republic 4
Institute of Thermomechanics, v.v.i., Academy of Sciences of the Czech Republic, Dolejškova 5, 182 23 Prague 8, Czech Republic
5
VŠB-Technical University of Ostrava, Faculty of Metallurgy and Materials Engineering, 17. listopadu 15, 708 33 Ostrava-Poruba, Czech Republic
6
J. Heyrovský Institute of Physical Chemistry, v.v.i., Academy of Sciences of the Czech Republic, Dolejškova 3, 182 23 Prague 8, Czech Republic
Abstract. Pulsation frequency of the cup-burner flame was determined by means of experimental investigations and numerical simulations. Simplified chemical kinetics was successfully implemented into a laminar fluid flow model applied to the complex burner geometry. Our methodical approach is based on the monitoring of flame emission, fast Fourier transformation and reproduction of measured spectral features by numerical simulations. Qualitative agreement between experimental and predicted oscillatory behaviour was obtained by employing a two-step methane oxidation scheme.
1 Introduction
Nonpremixed flames involve complex phenomena of fluid flow physics closely coupled to chemical reactions leading to the consumption of fuel, formation of combustion products and heat release. Our investigations are focused on a methane cup-burner flame [1,2] under ultra-low initial Froude number conditions resulting from the combination of low fuel inlet velocity and geometry of the burner characterized by a relatively large fuel nozzle diameter. In the presence of gravitational force, periodic pulsations (described as varicose mode instabilities [3]) are induced in buoyant nonpremixed flames.
This work describes quantitatively this type of hydrodynamic instabilities observed in our experimental setup. Furthermore, mathematical modelling employing computational fluid dynamics (CFD) was performed at the complex geometry of the cup-burner apparatus.
2 Experimental setup
A cup-burner apparatus providing an axi-symmetric co-flow nonpremixed flame is widely known in the fire
safety community as testing device for the determination of minimum extinguishing concentrations of fire suppression agents. The original design of the cup-burner apparatus described by ISO 14520 [4] and NFPA 2001 [5] standards was partly modified for the given purpose.
The co-flowing air was supplied to our modified burner through three horizontally mounted inlets with an angular shift of 120°. Above these inlets, steel wire mesh was laid, on which a 6 mm glass bead layer was put. The flame and the co-flow were separated from the surrounding air by a borosilicate glass chimney with a 200 mm height above the burner exit.
Fuel was supplied by the central tube lying along the vertical axis of the burner. The burner body was made of stainless steel. The steel fuel cup was filled with 3 mm glass beads covered with two layers of stainless steel wire mesh (41 Mesh, 0.22 mm wire diameter). This modification was adopted from [1, 2] in order to achieve a uniform inlet velocity profile of gaseous fuel. The dimensions of the cup-burner device given by the standards [4, 5] remained unchanged.
Flow rates of the fuel (CH4, 99.95%; SIAD) and compressed air (in-house system) were precisely controlled by mass flow controllers (Bronkhorst). The
C
Owned by the authors, published by EDP Sciences, 2013
flow rate of methane applied in the frame of this study (554 ± 11.1 ml/min) corresponds to the initial velocity of 1.5 cm/s at the fuel inlet. The flow rate of the co-flowing air stream was maintained at 40 ± 0.8 l/min. The uncertainties given above are estimated by adding 1% of the actual value of flow rate and 0.5% of the full scale (maximum flow rate for the given MFC) as declared by the manufacturer.
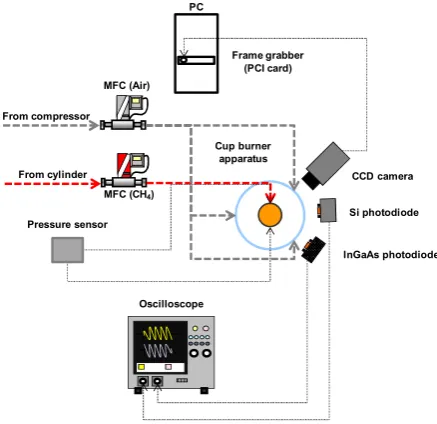
The broadband flame emission was monitored by Si (Thorlabs, PDA36A) and InGaAs (Thorlabs, PDA10D) photodiodes sensitive to visible and near-infrared radiation with spectral response maxima at 950 nm and about 2300 nm, respectively. These detectors were placed in a horizontal position 62 mm from the burner axis and approximately 120 mm above the burner lip. Signals from the detectors were recorded by a digital oscilloscope (LeCroy, WaveSurfer 42Xs).
Moreover, sequences of images were obtained from a monochrome CCD camera (EverFocus, EQ 2700) in order to characterize reaction zone instabilities with spatial resolution. The greyscale images from the analog camera were captured and digitized at 25 frames per second and 10-bit depth using an image acquisition card (National Instruments, PCI 1410) by the MATLAB Image Acquisition and Image Processing toolbox.
A pressure difference sensor (Ahlborn, FD8612DPS) was utilized for the initial specification of the porous layer inside the fuel nozzle. These measurements were performed in the cold methane flow, meaning that we employed the cup burner apparatus under nearly identical conditions as described above but without the burning flame (methane not ignited).
Complete experimental setup employed in the frame of this study is depicted in figure 1.
MFC (Air) PC
Frame grabber (PCI card)
InGaAs photodiode Si photodiode
CCD camera Cup burner
apparatus
Oscilloscope MFC (CH4) From cylinder From compressor
Pressure sensor
Fig. 1. Schematic overview of the experimental setup.
3 Mathematical model
Two-dimensional CFD simulations were performed by the ANSYS Fluent 14.0 software tool using an axisymmetric computational domain with a non-uniform grid, see figure 2.
Fuel (CH4)
Chimney (Borosilicate glass)
Fuel (CH4) Oxidizer
(air)
Chimney (glass)
Glass beads (Ø 3 mm)
uf
≈
1
.5
c
m
/s
uo
x
=
1
0
.7
c
m
/s
g
=
9
.8
1
m
/s
2
Fig. 2. Physical dimensions of the cup burner apparatus and illustration of the computational domain used for numerical
simulations.
A mathematical model included balance equations for the conservation of mass, momentum, energy (enthalpy) and species mass fractions with the source term of chemical reactions. Thermodynamic properties of gaseous species were defined as the temperature dependent 5-th order polynomial expressions. Transport properties were determined from the kinetic theory of gases.
A laminar flow model together with finite-rate chemistry assumption was applied, which excluded the effects of turbulence and the influence of turbulence-chemistry interactions. Radiative heat transfer was neglected at this level of modelling complexity. The combination of the stiff chemistry solver with the SIMPLE iteration scheme was used in order to facilitate the process of convergence.
Parameters of heat transfer and fluid flow affecting the preheating of fuel and air before entering into the reaction zone were recognized to have a considerable effect on hydrodynamic instabilities and behaviour of flame envelope. Material properties of nozzle tube are known to have a significant effect on flame structure [6].
Glass beads inserted inside the fuel nozzle to smooth the velocity profile and to obtain the uniform flow field are of key importance in this sense. Following the fundamental theory, the permeability (α) of an arbitrary porous layer along the z-axis (in vertical direction) can be determined from the relationship of Darcy-Wiesbach (1).
∆pz = − (µ/α) vz (1)
where ∆pz is the pressure drop along the z-axis direction
Global chemistry models of methane oxidation were used in the frame of our modelling efforts in order to describe, in a simplified manner, the phenomena of combustion chemistry in connection with the fluid flow physics. The predicative capabilities of simplified chemical kinetic models of methane oxidation were previously tested by means of one-dimensional flame simulations [7]. In this work, a selected one-step and two-step global chemistry models were utilized for estimating the structure and oscillatory behaviour of the methane cup-burner flame.
Source terms of chemical species appropriate for finite-rate reactions are formulated by temperature and concentration dependent equations. The reaction rate of one-step methane oxidation (CH4 + 2 O2 → CO2 + 2 H2O) is described by expression (2) using the a proposed by Puri and Seshadri [8] with the increased preexponential factor modified by Renner [9]:
r1 = 3×10
22
exp ( − 4.5×10⁴/RT) [CH4][O2]2 (2)
where r1 is the reaction rate (in mol.cm -3
), R is the molar gas constant (cal.mol-1.K-1), T is the temperature (in K) and [CH4] and [O2] methane and oxygen concentrations, respectively (given in mol.cm-3).
The two-step methane oxidation scheme includes a reversible reaction of carbon monoxide with oxygen (CO + 0.5 O2 → CO2 and CO2 → CO + 0.5 O2) and initial fuel decomposition (CH4 + 1.5 O2 → CO + 2 H2O). The Arrhenius constants used for this scheme are equal to those estimated by Bibrzycki and Poinsot [10]. Following expressions (3)-(4) describe the reaction rates:
r2 = 2×10¹⁵ exp ( − 3.5×10⁴/RT) [CH4]0.9[O2]1.1 (3)
r3 = 2×10⁹ exp ( − 1.2×10⁴/RT) [CO][O2]0.5 (4)
where r2 and r3 are the rates (in mol.cm-3) of above mentioned reactions and [CO] is the carbon monoxide concentration ( in mol.cm-3).
All the kinetic parameters are reported in the “cgs” unit system, which is broadly preferred in the community of combustion scientists and engineers. The conversion of preexponential factor to the “SI” unit system (if necessary) should be handled carefully considering properly the reaction order.
4 Results and discussion
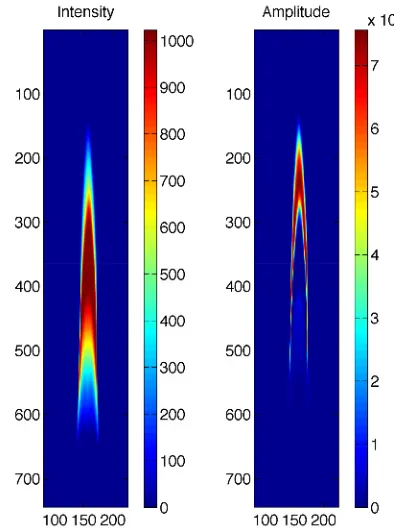
Sequences of 200 images from the CCD camera (see figure 3) were post-processed using MATLAB script for obtaining the two-dimensional plots of temporally averaged intensity and FFT amplitude (see figure 4). The time step of 40 ms between the subsequent images is consistent with the sampling frequency (fsam = 25 Hz) corresponding to the fixed framerate of the standard PAL systems. This framerate is lower than twice the frequency of the observed phenomenon (fphe). Due to the aliasing effect (sub-Nyquist sampling rate), the strongest peak in FFT spectra (main pulsation frequency) was observed at
fobs= fsam−fphe (i.e. at about 9.5 Hz).
Precisely determined frequency spectra of the methane cup-burner flame were obtained as the average of five FFT curves from individual 20 second scans taken by point (Si and InGaAs) detectors. These scans were acquired at the sampling rate of 500 samples per second. Gaussian peak profile fitting was additionally performed at the strongest spectral feature in order to determine the main pulsation frequency.
τ0 τ0+ 40 ms τ0+ 80 ms τ0+ 120 ms
Fig. 3. Four representative subsequent instantaneous flame images acquired by the analog CCD camera.
The set of model parameters including the data describing the porous layer is required to be adjusted at the beginning of numerical studies. The coefficient of porosity (ε) was initially estimated from the experimental data describing the dependence of fuel flowrate on pressure drop (∆p) in the range of relevant fuel inlet velocities (vz). Based on the linear fit of measured data
(see figure 5), a slope function parameter A = 2121.4 was determined. This parameter was utilized together with values of the layer thickness (tz = 0.025 m), glass bead
diameter (Dp = 0.003 m) and dynamic viscosity of
methane (µCH4 = 1.026×10⁻⁵ Pa.s) in relationship (5).
|∆pz /vz| = µCH4 /α = A =150·tz·(µCH4 /Dp2)·(1− ε)2/ε
3
(5)
y = 2121.4x
0 0.005 0.01 0.015 0.02 0.025
0 10 20 30 40 50
Cold flow velocity (m/s)
P
re
s
s
u
re
d
ro
p
(
P
a
)
Measurement
Linear fit
Fig. 5. Results of pressure drop measurements in cold methane flow and linear fit of experimental data.
Employing the Blake-Kozeny equation [11] given by the last expression of (5), the coefficient of porosity
ε ≈ 0.12 was approximated by iterative numerical solution. However, the parameter describing the properties of the porous layer was finally determined by calculating a ratio between the free space and the complete volume of cylindrical nozzle filled with the glass beads. The value of ε = 0.62 was obtained for the coefficient of porosity based on the total number of spherical beads inside the nozzle. This value was further used for cup-burner flame simulations reported here. Nevertheless, it should be noted that the variation of this parameter was observed to have a serious impact on the predicted flame height and the shape of reaction zone.
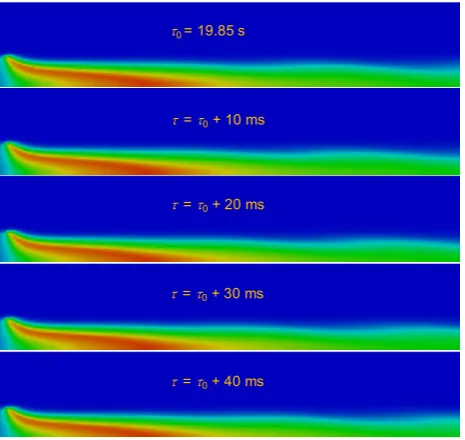
The one-step and two-step chemical kinetic models describing the oxidation of methane were successfully implemented into the unsteady numerical simulations by specifying the appropriate reaction rates in ANSYS Fluent 14.0. Flame oscillatory behaviour was captured in qualitative agreement with experimental data, when using the two-step methane oxidation scheme, see figure 6.
It is important to point out that the imaging data describe the flame emission, which can mainly be attributed to the continuum radiation from the hot soot particle present in the environment of methane flame.
The contours of soot emission maxima are expected to correlate fully neither with the maxima of local temperature in the flame (depicted in figure 6), nor with the exact position of the reaction zone.
τ0 = 19.85 s
τ= τ0+ 10 ms
τ= τ0+ 20 ms
τ= τ0+ 30 ms
τ= τ0+ 40 ms
Fig. 6. Results of numerical simulation of the cup-burner flame employing the two-step methane oxidation model describing local temperatures (blue colour corresponds to 300 K and red colour is representing the maxima reaching nearly 2400 K).
As we took into account neither soot formation, nor soot oxidation processes in the simulation, we consider the temperature as the relevant parameter describing the dynamic behaviour of the flame. These data are easily amenable by recording the convergence history of numerical simulation. For this purpose, temperature at the burner outlet (upper boundary of computational domain) was acquired throughout the simulation. Calculated FFT spectra corresponding to the simulation time τ > 19 s, when the oscillatory behaviour was evidently stabilized, were directly compared quantitatively with the experimental data, see figure 7.
Fig. 7. Comparison of measured (black line) and calculated FFT spectra determined from the convergence history of numerical
simulations employing the one-step (red line) and two-step (blue line) methane oxidation models.
models under the given conditions [7]. This temperature difference is responsible for a change in density gradients formed at both sides of the reaction zone in comparison with real conditions. A systematic shift in oscillatory behaviour can be a result of a change in chemical kinetics, thermochemistry and transport parameters due to the overpredicted temperature.
Other sources of errors are expected to arise from uncertainties in the reaction rates, thermodynamic data, and transport properties (in the simplified chemistry assumption) as well as from the material properties and parameters of the porous layer used for these calculations.
5 Conclusions
Based on the results of numerical simulations we can conclude that the detailed specification of burner geometry and material properties as well as the proper set-up of parameters describing the porous layer at the fuel nozzle inlet are important factors influencing the height and morphology of the methane cup-burner flame. The one-step chemical kinetic model provides reasonable estimates of the temperature and velocity fields.
Nevertheless, a more complex combustion mechanism is required in this case for obtaining reliable information about hydrodynamic instabilities and characteristic pulsation of the flame. The oscillatory behaviour of the cup-burner flame was predicted in reasonable agreement with the experimental data when employing the two-step chemical kinetic mechanism of methane oxidation. Additional measurements and numerical studies have been recently prepared under different experimental conditions for testing the performance of the given model in more detail.
Acknowledgments
This work was supported by the Ministry of Education, Youth and Sports of the Czech Republic via the projects LD11012 and LD12020 (both in the frame of the COST CM0901 Action) and by the Ministry of Interior of the Czech Republic via the project VG 20102015059.
References
1. F. Takahashi, G.T. Linteris, V.R. Katta, Proc. Combust. Inst. 31, 1575-1582 (2007)
2. F. Takahashi, G.T. Linteris, V.R. Katta, Proc. Combust. Inst. 31, 2721-2729 (2007)
3. B.M. Cetegen, Y. Dong, Exp. Fluids 28, 546-558 (2000)
4. International Organization for Standardization, ISO 14520-1: Gaseous Fire-Extinguishing Systems -
Physical Properties and System Design (Geneve,
2005)
5. National Fire Protection Association, NFPA 2001: Standard for Clean Agent Fire Extinguishing System
(Quincy, 2008)
6. O. Gülder, K. Thomson, D. Snelling, Combust. Flame 144, 426-433 (2006)
7. M. Kozubková, E. Kozubek, V. Nevrlý, P. Bitala, O. Štěpánek, J. Dlabka, M. Vašinek, M. Bojko, Z. Zelinger, P. Kubát, E. Grigorová, Procedia
Engineering42, 2001-2017 (2012)
8. I.K. Puri, K. Seshadri, Combust. Flame 65, 137-150 (1986)
9. J.E. Renner, Numerical and experimental studies of
the dynamics of diffusion flame sheets Ph.D. thesis
(Northwestern University, 2008)
10. J. Bibrzycki, T. Poinsot, Working note ECCOMET
WN/CFD/10/17 (CERFACS, 2010)