Abstract— Software testing is an essential and integral part of the software development process. The testing effort is divided into three parts: test case generation, test execution, and test evaluation. Test case generation is the core of any testing process and automating it saves much time and effort as well as reduces the number of errors and faults. This paper proposes an automated approach for generating test cases from one of the most famed UML diagrams which is the activity diagram. The proposed model introduces an algorithm that automatically creates a table called Activity Dependency Table (ADT), and then uses it to create a directed graph called Activity Dependency Graph (ADG). The ADT is constructed in a detailed form that makes the generated ADG covers all the functionalities in the activity diagram. Finally the ADG with the ADT are used to generate the final test cases. The proposed model includes validation of the generated test cases during the generation process to ensure their coverage and efficiency. The generated test cases meet a hybrid coverage criterion in addition to their form which enables using them in system, regression as well as integration testing. The proposed model saves time and effort besides, increases the quality of generated test cases. The model is implemented on three different systems and evaluated to show its effectiveness.
Index Term— Automatic test case generation, Model-Based Testing (MBT), Cyclomatic complexity and testing coverage criteria.
I. INTRODUCTION
Model-Based Testing (MBT) is a type of testing strategy that depends on extracting test cases from different models [1,2]. Models are categorized into three categories: requirements models, usage models, and models constructed from source code. The test derivation approaches applied on the different model types are sometimes classified into specification-based testing (or black-box testing) that depends on requirements models, and program-based testing or white-box testing) that uses source code as the underlying model. As a result test cases can be derived from requirements models or behavioral models, which makes model-based testing usually seen as one form of black-box testing [3,4]; It perfectly suites being used in system, acceptance, and regression testing [5,6].
Model-based testing depends on three key technologies: the notation used for the model, the test-generation algorithm, and the tools that generate supporting infrastructure for the tests [7]. The test cases derived from the behavioral model are functional tests on the same level of abstraction as the model. Many types of models are used to derive test cases [1,4,7,8];
Unified Modeling Language (UML) models are one of the highly ranked types of models used [9,10,11,12,13].
UML is the most dominant standard language used in modeling the requirements [2,14] and considered an important source of information for test case design. Therefore if it is satisfactorily exploited it will reduce testing cost and effort and at the same time improve the software quality.
Several researchers during the last decade have been using different UML models to generate test cases [15,16,17,18,19,20,21]. Activity diagrams are one of the important UML models used in representing the workflows of stepwise activities and actions with support for choice, iteration and concurrency. Moreover, Activity diagrams can be utilized to describe the business and operational step-by-step workflows of components in a system [22]. It shows the overall flow of control between activities as well as the activity-based relationships among objects as it has all the characteristics that can improve the quality of the automatically generated test cases as well as using these test cases for system, integration, and regression testing [5]. Different sets of test cases used in those types of testing should have certain parameters or characteristics; they normally consist of a unique identifier, preconditions, a series of steps (also known as actions) to follow, input, and expected output, and sometimes post conditions [23]. Having this form still doesn‟t ensure that all test cases can be used and provide expected results as the quality of the generated test cases is the threshold.
Quality of test cases depends on how far they would cover all the functionalities in a system under test [24,25]. The test cases should be validated against some known quality standards [26,27,28] to ensure that they are in an acceptable form as well as ensure that they cover all the functionalities of a system. Several metrics have been discussed seeking to measure the quality of the test cases being generated like time, cost, effort, coverage criteria and many others [29,30,31,32,33]. A software metric called Cyclomatic complexity provides a quantitative measure of the logical complexity of a program [5,34]. When used in the context of a basis path testing method, the value computed for Cyclomatic complexity defines the number for independent paths in the basis set of a program [35].
Cyclomatic complexity function, , is an important criteria because of its two properties: It is an upper bound for
A Proposed Test Case Generation Technique
Based on Activity Diagrams
the number of test cases that are necessary to achieve full branch coverage. Besides it is a lower bound for the number of test cases needed in order to achieve a full path coverage which is equal to the number of all possible paths that can be taken. Thus,
Coverage criteria are one of the important set of metrics established to check the quality of test cases generated from behavioral models [33,36,37]. Coverage criteria include many types which differ according to the UML model being used in generating the test cases. Some of the test coverage criteria examples are: Branch coverage criteria [38] applied on Control flow graphs, Full predicate coverage criteria [39] applied in test case generation methods using the state chart or the communication diagrams, condition coverage criteria [39] covered by communication diagrams based techniques and all basic paths coverage criteria [20] covered in activity diagrams based techniques.
This paper is organized as follows: section II describes the architecture of the proposed model. In section III, the implementation is explained reinforced with a case study for demonstration. In section IV, experimental evaluation is established for the proposed model. The last section includes concluding remarks.
II. ARCHITECTURE
The proposed model studies the activity diagrams as a building block in launching the automated algorithm of generating test cases. This model constructs an intermediate table called the Activity Dependency Table (ADT). The produced ADT table automatically generates a directed graph called Activity Dependency Graph (ADG). The ADG is then examined using the Depth First Search (DFS) [40] in order to extract all the possible test cases. The ADT‟s form makes the ADG cover all the functionalities in the activity diagram. The generated test cases should go through all the branches in the activity diagram. Thus, it applies the branch coverage criterion. They also justify all the conditions /predicates that might be established in the activity diagram as well as all the basic paths (which are paths that cover loops zero or one time) because the model checks all the loops only once. The generated test cases are validated against the Cyclomatic complexity technique [34,35,36] to check all the test cases generated by that technique. Thus, we can claim that the Cyclomatic complexity coverage criterion has been verified as well.
The proposed model applies a hybrid coverage criterion that combines the branch coverage criterion, the condition coverage criterion, the all-basic paths coverage criterion, and the full-predicate criterion in addition to the cyclomatic complexity criterion. This hybrid criterion can be defined as follows: “A set of activity paths P satisfies the hybrid coverage criterion if and only if P contains all start-to-end activity paths in an activity diagram, all predicates/conditions in an activity
diagram and all test cases produced by Cyclomatic complexity technique”.
The proposed model is composed of four main modules as shown in Fig. 1
Fig. 1. The Proposed Model Architecture
The Activity diagrams are the input to the proposed model. Each activity diagram will be utilized to automatically generate its ADT which is specially designed to contain all necessary details that enable the model to examine all the activity diagram‟s functionalities and capabilities. The ADT will then be used to automatically generate the ADG. The ADG will be accessed using the DFS to extract all the possible test paths. Therefore, all the details are added to each test path using the ADT to have the final test cases. Each activity diagram should pass through all the four modules to generate at the end a set of highly efficient test cases meeting the hybrid coverage criterion for the whole system. The description of each module will be illustrated as follows:
Module 1: Generation of ADT
Each activity diagram is used to automatically generate the Activity Dependency Table (ADT) with all the activities involved in it including decisions, loops and synchronization along with the entity performing the activity. This aims to showing the activities that having transfer in control to other entities which can be useful for system, regression and integration testing. It also includes the input and the expected output values for each activity. Dependency of each activity on others is also shown clearly in ADT. Symbols are given for each activity to ease referencing it in determining dependences and using it in the other involved modules. To decrease the search space of the generated ADG (that will be explained later in this section), repeated activities are grouped into one symbol only instead of having several symbols for the same activity.
Module 2: Generation of ADG
each activity are used to name the nodes in the ADG where each node represents an activity in the activity diagram. Since repeated activities are given the same symbol in the ADT, only one node is created for them no matter how many times they are used in the activity diagram. This will decrease the search space in the ADG. The transitions from one activity to another are represented by edges in the ADG. The presence of an edge from a node to another is determined by checking the dependency column in the ADT for the current node‟s symbol. Specifically, if it contains the previous node‟s symbol then an edge from the previous node to the current one is drawn in the ADG; Otherwise, we backtrack in the ADG until finding the node whose symbol is mentioned in the current node‟s dependency column and create an edge from it to the current node and so on until all the rows in the ADT are finished. Synchronization, decisions and loops are demonstrated using edges as well.
Module 3: Test cases Generation
Depth First Search (DFS) is applied on the ADG generated in module 2 to obtain all the possible test paths. A test path is composed of steps represented by successive symbols/nodes (representing the activities) forming a complete path from the start node in ADG to the end node separated by arrows. Details are then extracted from the ADT and added to each node in the test path to obtain all the final test cases. Each node in the test case is accompanied with its input and expected output. Besides, the whole test case will be accompanied with its initial input and final expected output.
Module 4: Validate generated test cases
Each activity diagram is subjected in this module to basically compute the minimum number of test paths that must be covered to check their correctness in order to test the activity diagram‟s functionalities. The Cyclomatic complexity technique is used to perform this computation. However, this computation requires a flow graph showing all the nodes in the activity diagram, thus a table is generated from each activity diagram called Cyclomatic Activity Table (CAT) but without grouping the repeated activities like what we do in ADT; we need the full number of nodes and edges in calculation. The CAT is composed of three columns specified as one for the activity name, the second for the symbol given to it, and the third is for the dependency (the symbol(s) of the activities which the activity depends on). A flow graph is then generated automatically from the CAT in the same way the ADG was generated; it is called Cyclomatic Activity Graph (CAG). The CAG is then used for computing the minimum number of test paths. After that the proposed model‟s generated test paths are validated against this lower bound criterion to ensure meeting the Cyclomatic complexity coverage criteria. Since the Cyclomatic complexity is considered an upper bound for the branch coverage criterion and the predicate/condition coverage criterion as well as being the lower bound for the full path coverage criterion, then this module also ensures that the generated test cases meet the hybrid coverage criterion. Thus we can prove that the proposed methodology produces highly efficient test cases.
III. IMPLEMENTATION
The proposed model is applied on three different case systems with different sizes and in different areas in order to demonstrate its flexibility and applicability over different domains. The three selected different systems are: University system, Library system, and ATM system. The ATM Withdraw case study from the ATM system is selected to illustrate the implementation of the proposed model‟s modules.
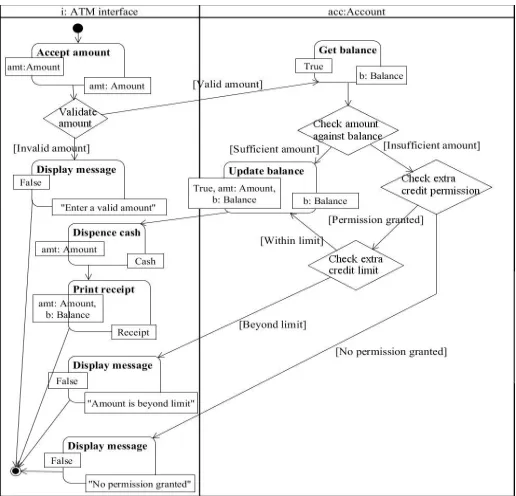
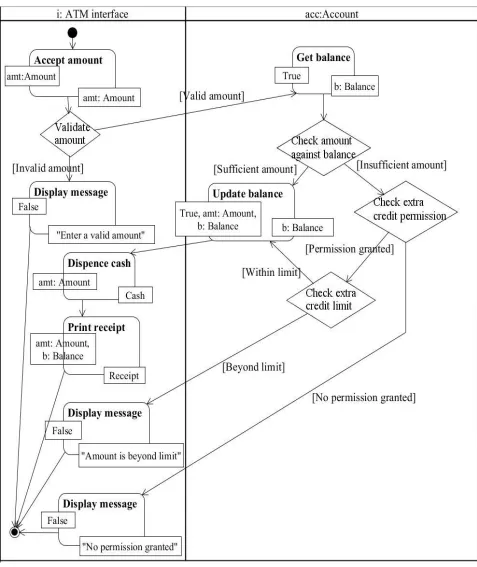
An activity diagram for the ATM Withdraw use case is used as shown in Fig. 2. First the user enters the amount she/he wants to withdraw. Second, the system checks whether the value entered is valid or not, in case it is valid, the system will retrieve the balance of the user then check whether the balance is sufficient to withdraw from or not; otherwise, the system displays an error message for the user to enter an appropriate value. In case the balance is sufficient the system completes the withdraw process successfully by updating the balance, dispensing the cash and finally printing a receipt for the user. In case the balance isn‟t sufficient, the system checks whether the user has permission to overdraft. If permission is granted then the system compares the amount required with the maximum allowed limit for overdraft and in turn completes the withdraw operation successfully if the amount needed is within limit. Finally, an error message is displayed for the user if she/he has no overdraft permission or the amount to be withdrawn exceeds the maximum allowed limit. The Control transfer points are handled by using swim lanes. Two swim lanes are considered, one for the ATM interface and another for the account entity of the client using the ATM. The input and output of each activity are shown using activity parameter nodes.
A. Module 1: Generation of Activity Dependency Table (ADT)
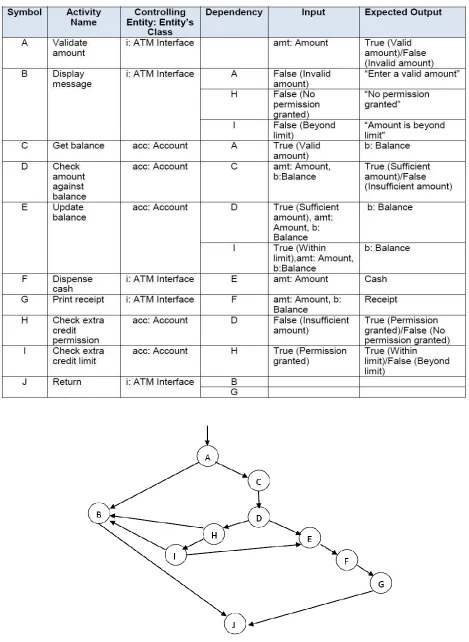
The ADT table is generated automatically from each activity diagram to fully contain all its details. The ADT has seven columns and they are explained as follows:
Symbol: An alphabetic letters is given for each activity involved in the Activity diagram.
Activity Name: The name of the activity established in the Activity diagram.
Controlling Entity: Entity‟s Class: The name of the object currently in control and the name of the class to which it belongs.
Dependency: The Symbol(s) of each activity that the current activity depends on. For example, Activity „C‟ depends on activity „A‟ which means that in order to get balance the amount should be validated first. Input: The input to the current activity. The input can
be any type of values, like Boolean, strings, integers and database records. For example, the input to activity „C‟ as shown in the activity diagram is a true value which shows that the value was validated successfully. The input parameter acts as a precondition. In other words, if activity „C‟ receives a false value as an input it shouldn‟t execute.
Expected Output: The expected output from the current activity. The expected output can be also any type of values, like Boolean, strings, integers and database records. For example, the output of the activity „C‟ as shown using an output parameter in the activity diagram is an instance of the Balance class called „b‟. The output parameter acts as a post condition. In other words, we must ensure that b is successfully returned at the end of the activity „C‟.
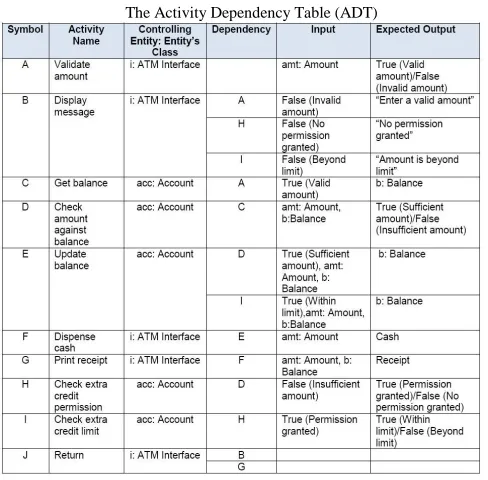
The ADT for the ATM withdraw activity diagram is shown in Table I.
Table I
The Activity Dependency Table (ADT)
Let‟s take the “Dispense Cash” activity as an example. It is given the symbol F. An object from the ATM interface is the object having the control; it is represented as i:ATM Interface (objectName:ClassName). The balance would be reduced by the amount the user seeks to withdrawn and updated before the cash is dispensed. Thus it depends on the activity “Update Balance” which is given the symbol E. The input to this activity is the amount to be dispensed and the expected output is the Cash dispensed.
Activities that are demanded several times in the activity diagram but with different input and output parameters such as the “Display Message” activity, or can depend on more than one activity, such as the “Return” activity, are shown in the table only once and in return the symbols of the activities which they receive input from or depend on are registered in their dependency column. This reduces the number of repeated items in the table and in turn the number of nodes that will be established in the ADG, generated in module 2. Consider the “Display Message” activity as an example, the symbols „A‟, „H‟ and „I‟ are inserted under its dependency column in the ADT shown in Error! Reference source not found. which means that activity „B‟ can be called after activities „A‟ or „H‟ or „I‟ and with each activity it will give different output and sometimes have different input.
B. Module 2: Generation of Activity Dependency Graph (ADG)
This module uses the symbol and the dependency columns of the Activity Dependency Table (ADT) to generate the Activity Dependency Graph (ADG). Each symbol is represented by a node and each edge represents the transition from one activity to another as shown in Fig. 3. The presence of an edge from a node to another is determined by checking the dependency column in the ADT for the current node‟s symbol. Specifically, if it contains other nodes‟ symbols, we keep backtracking in the ADG till we find each one of them and then draw an edge from it to the current node representing a transition from its corresponding activity to the current node‟s activity.
Fig. 3. The Activity Dependency Graph (ADG)
C. Module 3: Test cases generation
The Final Test cases are generated using a particular suggested algorithm called GeneratingTestCasesSuite. The suggested algorithm for generating the test cases suite is presented in Fig. 4. The steps of the algorithm are as follows:
1. Pass on all ADGs and for each one get all the possible test paths using the depth first search technique. 2. Create a table TC with six columns (Test case Number,
Test path Node, Node Input, Node Expected Output, Test case Input, and Test case Expected Output) to be filled with the final test cases.
3. Initialize counters to be used for indexing the list of nodes in each path and for indexing the table of final test cases TC.
4. For each test path fetch the input and the expected output for each node from the corresponding ADT and add it to the corresponding cells (Node Input, Node Expected Output) in a new test case row. 5. Add to this new test case row from the ADT, the input
of the first node in the current test path to the “Test case Input” cell and add the output of the final node in the current test path to the “Test case Expected Output” cell, then add the test case row to the TC. 6. Return the TC table after all the paths are being
updated and added in TC.
Fig. 4. The GeneratingTestCasesSuite Algorithm
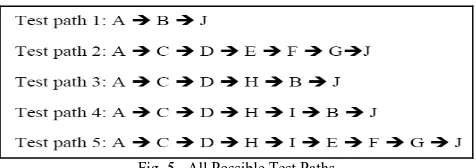
The application of the first step in the proposed algorithm on the case study which only has one ADG results in having five test paths. The five test paths are shown in Fig. 5.
Fig. 5. All Possible Test Paths
Table II
The Final Generated Test Cases
D. Module 4: Validation of the generated test cases
The Cyclomatic complexity function [5,34,35], is introduced to validate the generated test cases. First, the Cyclomatic Activity Table (CAT) is generated from each activity diagram that was the initial input in our proposed model. This table is only composed of three columns one is called “Activity Symbol”, the second is called “Activity Name”, and the third is called “Dependency”. The CAT contains all the activities‟ names in an activity diagram along with symbols given to each one of them. The dependency has the same function of the dependency column in ADT. In the ATM case study, the CAT generated from our ATM withdraw activity diagram is shown in table III. Notably, that the number of rows in this table is much more than those in the ADT because in ADT, we have merged all the activities that are demanded several times in only one entry which is the “Display Message” activity as well as we grouped its dependencies.
Table III
The Cyclomatic Activity Table (CAT)
Second, a flow graph is generated from the CAT called Cyclomatic Activity Graph (CAG). It is created by the same way the ADG was created. The generated CAG is shown in
Fig. 6.
Fig. 6. Cyclomatic Activity Graph (CAG)
Third, we compute the minimum number of test cases that should be covered for each activity diagram using one of the following two ways:
1. Cyclomatic complexity, for the flow graph CAG, is defined as:
Where E, is the number of edges; N is the number of nodes.
2. Cyclomatic complexity, for the flow graph CAG is also defined as:
the form of decision nodes as well, thus this computation will still be useable.
Therefore, We can see that the number of predicates are four, edges E are 16 and nodes N are 13, then the will be as follows:
Test cases
Test cases
Then the upper bound of test cases that ensures the full activity path coverage is 5 test cases which were produced by the proposed model. Since,
Hence, the generated test cases apply the branch coverage criteria, and the Cyclomatic complexity coverage. In some cases the generated test cases exceed the Cyclomatic complexity criterion which means that the proposed model‟s test cases apply the full-path coverage criteria. Thus, the proposed model applies the hybrid coverage criterion.
IV. EXPERIMENTAL EVALUATION
The proposed model is evaluated against a technique established in the research [16] which generates test cases using both activity and sequence diagrams while our model proves that only activity diagrams are sufficient. It creates a general sequence diagram for each use case; from each sequence diagram it re-creates several intermediate tables and flow graphs. All the flow graphs are merged together and used to create test sequences. The final test cases are extracted from those test sequences.
The proposed model solves a large number of problems in the previously mentioned research. First, the research [16] uses a general sequence diagram for each use case which is used to create afterwards an activity diagram for each method that only causes a transfer in control in the sequence diagram. Next, it creates an intermediate table for the sequence diagram and from it a number of graphs are being created. The number of created graphs is equal to the number of activity diagrams (previously created for certain methods). Thus the number of the activity diagrams for each sequence diagram is unknown and can increase rapidly with the number of methods in the sequence diagram. In turn, the number of the graphs is unknown too and will increase with the same ratio. On the other hand our proposed model uses only one detailed activity diagram per use case and uses no sequence diagrams. Moreover, we generate only one ADT and one ADG for each use case and no any possibilities that either the number of activity diagrams or ADGs will increase during the generation process.
Moreover, in research [16] all the graphs are merged together to form one large graph that is used to extract the test sequences. The merging process can take so long if we have too many graphs, besides some nodes can be replicated if mentioned in several graphs. In our proposed model no replication of nodes because no merging is needed in first place.
Another type of repetition takes place but in the number of the algorithms steps this time. The initial number of steps in the research is eight. Each extra creation of any table or graph is counted as an extra step in the algorithm. And since the number of those generated tables and graphs are unknown and may also increase continuously, then the number of the algorithm‟s steps keeps increasing proportionally as well as the time elapsed in each. This may increase the overall test cases generation time and cost. Our proposed model has only four steps to go through and they are constant nevertheless the size or the domain of the use case was, the only thing that increase is the time needed to accomplish them, which can be also predicated in terms of the use case size.
The research [16] uses an abstract sequence diagram relying on the further activity diagrams extracted to cover the missing details, thus this may cause missing important methods. Also creating activity diagrams only for methods that cause transfer in control can miss others that do not but are still complicated and require further demonstrating activity diagrams. Our proposed model doesn‟t have to go through all this since we don‟t use sequence diagrams but on the other hand we use a detailed activity diagram. So, our model is not affected by the number of messages/functions causing control transfer. It goes through the same number of steps without the need to repeat any of them.
The number of generated test paths in research [16] is sometimes less than the minimum number that must be covered and estimated by the cyclomatic complexity technique. When validating them against the cylcomatic complexity technique, they happen to be less than the minimum estimated number of test paths missing by that some essential test paths that could affect the logic of the use case. On the other hand, the proposed model produces test paths that always cover the cyclomatic complexity criterion and by that covers the full branch, the full predicate and full condition criteria. In some cases the number of the proposed model‟s test paths exceeds that of the cylcomatic complexity trying to cover the full path coverage criteria as well.
An evaluation approach is built to evaluate the proposed model and to compare its performance with the research in [16]. An application is built for this purpose. It compares their performance while generating test cases for a sample 30 use cases taken from three different systems that differ in size and domain according to some factors described as follows:
The total number of activity diagrams used for each use case in both models.
The number of generated test paths against the cyclomatic complexity in both models.
The complexity of each methodology in terms of effort or time in both models.
The constructed application draws comparison graphs for those factors. The graphs depict the improvement in performance as well as the high quality of the test cases generated by the proposed model.
A. The total number of activity diagrams used for each use case in both models.
Only one activity diagram has been utilized per each use case/ functionality within the proposed model whereas in the other model it increases proportionally with the number of control transfer messages in the sequence diagram which causes an increase in the number of generated activity diagrams. The comparison graph is shown in Fig. 7.The yellow color is given for our proposed model while the other color is for the research [16].
Fig. 7. Total Number of Activity Diagrams per Use Case
B. The total number of steps in both models
In the proposed model, it is constant and equals to four steps, including the Validation step which is not included in the other model. On the other hand, the other model has minimum number of total steps equals to eight steps and they increase proportionally with the increase in number of control transfer messages in the sequence diagram which, therefore, causes an increase in the number of activity diagrams which in turn increase the number of intermediate tables and graphs generated. The comparison graph is shown in Fig. 8.
Fig. 8. Total Number of Steps
C. The number of generated test paths against the cyclomatic complexity technique
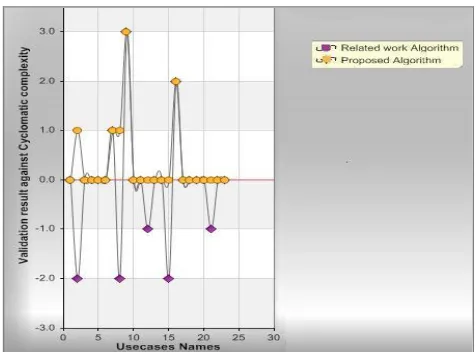
Validation is considered a basic and important component in the proposed model and its main functionality is to verify the correctness of all number of generated test paths. Notably, the model in research [16] doesn‟t have a validation module. The number of test paths generated from the proposed model covers a hybrid coverage criteria by covering the branch coverage criteria, the predicate/condition coverage criterion, the cyclomatic complexity coverage criteria, and the full-path coverage criteria whereas the other model sometimes fails to cover the cyclomatic complexity coverage criteria, which means it fails to cover the branch coverage criteria, and in turn fails to cover the full-path coverage criteria. The comparison between the cyclomatic complexity coverage in the proposed model against the other model is shown in Fig. 9.
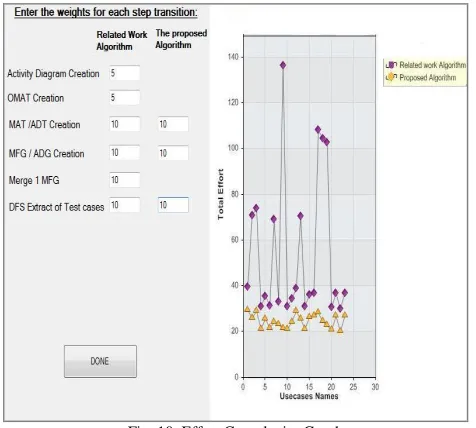
D. The complexity of each methodology in terms of effort or time in both models
The complexity of the proposed model in terms of time or effort spent is compared with that of the other model. Scales are put for each of the key steps that contribute in the generation of the final test cases in terms of discrete values. The value ten represents the maximum time or effort spent and the value five is the minimum. The overall time/effort complexity of generating test cases for each of the 30 use cases is computed in terms of weights using our model and the research [16] model. The resulted graph is shown in Fig. 10. The graph demonstrates that the proposed methodology performs better and takes less overall time and effort than the other model.
Fig. 10. Effort Complexity Graph
V. CONCLUSION
The proposed approach can generate highly efficient test cases with the minimum number of steps saving time, effort and yet increasing the quality of generated test cases thus improving the overall testing process performance. The proposed model uses only activity diagrams as input. It generates automatically for each activity diagram an intermediate table called Activity Dependency Table (ADT) and a directed graph called Activity Dependency Graph (ADG). The ADG is visited using Depth First Search (DFS) to extract all the possible test paths. The test paths are finally updated using the details in the ADT to generate automatically the final test cases. Since the ADT considers the objects in control as well as the dependencies between the objects, the proposed algorithm generates all the possible test cases in a detailed form where each step in the test path is accompanied with its input and expected output. This detailed form of test cases makes them capable of being used in system, regression and integration testing as well.
Validation of the generated test cases is accomplished by implementing the Cyclomatic complexity technique. A table called Cyclomatic Activity Table (CAT) is generated
automatically from the activity diagrams to be used in generating a flow graph called the Cyclomatic Activity Graph (CAG). The CAG is finally used to compute the lower bound for our generated test cases using the Cyclomatic complexity technique. The generated test cases meet a coverage criterion which is a hybrid of the branch coverage criterion, condition/ predicate coverage criterion, the Cyclomatic complexity coverage criterion and the full path coverage criterion. The proposed model was applied on three different case studies in three different domains; a University system, a Library system, and an ATM system. The ATM Withdraw functionality was used to illustrate the four modules of our proposed model.
An evaluation was completed to evaluate the proposed model‟s performance. It displayed many comparison factors such as the total number of steps, the number of generated test cases, the total effort/time spent, and the total number of activity diagrams used for each use case.
ACKNOWLEDGMENT
P. N., N. B., M. H. and M. T thank Professor Ahmed M. Hamad for his great and continuous support which contributed to the improvement of this work.
REFERENCES
[1] B. Berenbach, D. Paulish, J. Kazmeier, A. Rudorfer. “Software and Systems Requirements Engineering in practice”. The McGraw-Hill Companies Inc., USA, 2009.
[2] G.D. Everett, R. McLeod, Jr.” Software Testing: Testing across the Entire Software Development Life Cycle”, IEEE press, John Wiley & Sons, Inc., Hoboken, New Jersey, 2007.
[3] M. Blackburn, R. Busser, A. Nauman. “Why Model-Based Test Automation is Different and What You Should Know to Get Started”, Proceedings of the International Conference on Practical Software Quality and Testing, Washington D.C., USA, 2004.
[4] S.R. Dalal, A. Jain, N. Karunanithi, J.M. Leaton, C.M. Lott, G.C. Patton, B.M. Horowitz. “Model-Based Testing in Practice”, Proceedings of the 21st international conference on Software engineering, New York, USA, 1999.
[5] B.B. Agarwal, S.P. Tayal, M. Gupta. “Software Engineering and testing”, Infinity Science Press, Jones and Bartlett, Hingham, Toronto, 2010.
[6] L. Luo. “Software Testing Techniques,Technology Maturation and Research Strategies”, Class Report, Institute for Software Research International, Carnegie Mellon University, Pittsburgh, USA, 2009. [7] A.C. Dias-Neto, R. Subramanyan, M. Vieira, G.H. Travassos. “A
Survey on Model-based Testing Approaches: A Systematic Review”, Proceedings of the 1st ACM international workshop on Empirical assessment of software engineering languages and technologies in conjunction with the 22nd IEEE/ACM International Conference on Automated Software Engineering (ASE), New York, USA, 2007. [8] A.C. Dias-Neto, G.H. Travassos. “Model-based testing approaches
selection for software projects”, Journal of Information and Software Technology 51 (2009).
[9] Object M. Group, “OMG Unified Modeling Language (OMG UML), Superstructure,V2.1.2”,
http://www.omg.org/spec/UML/2.1.2/Superstructure/PDF/
[10] S.K. Swain, D.P. Mohapatra, R. Mall. “Test Case Generation Based on Use case and Sequence Diagram”, International Journal of Software Engineering, IJSE 3 (2010).
[11] M. Riebisch, I. Philippow, M. Götze. “UML-Based Statistical Test Case Generation”, Revised Papers from the International Conference NetObjectDays on Objects, Components, Architectures, Services, and Applications for a Networked World, Springer-Verlag London, UK, 2003
research conference of the South African Institute of Computer Scientists and Information Technologists on Enablement through Technology (SAICSIT), Republic of South Africa, 2003.
[13] P. Samuel, R. Mall, P. Kanth. “Automatic test case generation from UML communication diagrams”, Information and Software Technology Journal 49 (2007).
[14] B. Hasling, H. Goetz, K. Beetz. “Model Based Testing of System Requirements using UML Use Case Models”, Proceedings of the International Conference on Software Testing, Verification, and Validation, IEEE Computer Society Washington, DC, USA, 2008. [15] M. Sarma, D. Kundu, R. Mall. “Automatic Test Case Generation from
UML Sequence Diagrams”, Proceedings of the 15th International Conference on Advanced Computing and Communications, IEEE Computer Society Washington, DC, USA, 2007.
[16] S.K. Swain, D.P. Mohapatra. “Test Case Generation from Behavioral UML Models”, International Journal of Computer Applications (IJCA) 6 (2010).
[17] H. Kim, S. Kang, J. Baik, I. Ko. “Test Cases Generation from UML Activity Diagrams”, Eighth ACIS International Conference on Software Engineering, Artificial Intelligence, Networking, and Parallel/Distributed Computing (SNPD), Qingdao, China, 2007. [18] M. Chen, P. Mishra, D. Kalita. “Coverage-driven Automatic Test
Generation for UML Activity Diagrams”, Proceedings of the 18th ACM Great Lakes symposium on VLSI, Orlando, Florida, USA, 2008. [19] C. Mingsong, Q. Xiaokang, L. Xuandong. “Automatic Test Case
Generation for UML Activity Diagrams”, Proceedings of the international workshop on Automation of software test, New York, NY, USA, 2006.
[20] W. Linzhang, Y. Jiesong, Y. Xiaofeng, H. Jun, L. Xuandong, Z. Guoliang. “Generating Test Cases from UML Activity Diagram based on Gray-Box Method”, Proceedings of the 11th Asia-pacific Software Engineering Conference (ASPSEC), IEEE Computer Society, Washington, DC, USA,2004.
[21] M. Chen, X. Qiu, W. Xu, L. Wang, J. Zhao, X. Li. “UML Activity Diagram-Based Automatic Test Case Generation for Java Programs”, The Computer Journal 52 (2009) 545-556.
[22] G. Booch, J. Rumbaugh, I. Jacobson. “The Unified Modeling Language User Guide”, Addison-Wesley, 1999.
[23] D. Graham, E. Veenendaal, I. Evans, R. Black. “Foundations of Software Testing ISTQB Certification”, International Software testing Qualifications Board, 2010.
[24] L. Lazić, M. Medan. “Software Quality Engineering versus Software Testing Process”, The Telecommunication Forum TELFOR (Communication Forum), 2003.
[25] K. Smolander. “Quality Standards in Business Software Development”, Master of Science Thesis, Lappeenranta University of Technology, Department of Information Technology, 2009.
[26] IEEE standard for software test documentation, IEEE Std 829-1998, Published by Institute for Electrical and Electronics Engineers, New York.
[27] CMMI Product Team, CMMI for development v 1.3 (CMU/SEI-2010-TR-033), Carnegie Mellon University, Software Engineering Institute, 2010.
[28] S.J. Andriole. “Software Validation, Verification, Testing and documentation”, Petrocelli Books, Princeton, New Jersey, 1986. [29] CY. Huang, JH. Lo, SY. Kuo, M.R. Lyu. “ Software Reliability
Modeling and Cost Estimation Incorporating Testing-Effort and Efficiency”, Proceedings of the 10th International Symposium on Software Reliability Engineering, IEEE Computer Society Washington, DC, USA, 1999.
[30] P.B. Nirpal. K.V. Kale. “A Brief Overview Of Software Testing Metrics”, International Journal on Computer Science and Engineering (IJCSE) 3 (2011).
[31] S.H. Kan, J. Parrish, D. Manlove. “In-process metrics for software testing”, IBM Systems Journal 40 (2001).
[32] Y. Chen, R.L. Probert, K. Robeson. “Effective Test Metrics for Test Strategy Evolution”, Proceedings of the 2004 Conference of the centre for Advanced Studies on Collaborative Research (CASCON), IBM Press, Markham, Ontario, Canada, 2004.
[33] L. Lazic, N. Mastorakis. “Cost Effective Software Test Metrics”, WSEAS Transactions on Computers Journal 7 (2008).
[34] R. Black, “Pragmatic Software Testing: Becoming an Effective and Efficient Test Professional”, John Wiley & Sons, Bulverde, Texas, 2007.
[35] S.H. Kan, “Metrics and Models in Software Quality Engineering”, Addison-Wesley Professional, second ed., 2002.
[36] P. Ammann, J. Offutt. “Introduction to Software Testing”, Cambridge University press, New York, USA, 2008.
[37] J.A. McQuillan, J.F. Power. “A Survey of UML-Based Coverage Criteria for Software Testing”, Technical Report, National University of Ireland, Maynooth, Co. Kildare, Ireland, 2005.
[38] R.V. Binder. “Testing Object-Oriented Systems: Models, Patterns and Tools”, Addison-Wesley, 2000.
[39] A. Andrews, R. France, S. Ghosh, G. Craig. “Test adequacy criteria for UML design models”, Journal of Software Testing, Verification and Reliability 13 (2003) 95-127.
Table I
The Activity Dependency Table (ADT)
Fig. 4. The GeneratingTestCasesSuite Algorithm
Table II
Table III
The Cyclomatic Activity Table (CAT)
Fig. 7. Total Number of Activity Diagrams per Use Case
Fig. 9. Validation against Cyclomatic Complexity