DIABETIC RETINOPATHY USING MACHINE LEARNING
Manisha Laxman Jadhav1, M. Z. Shaikh21. INTRODUCTION
The World Health Organization (WHO) estimates that there are currently 347 million people suffering from diabetes and projects that this disease will be the seventh leading cause of death worldwide in 2030 [1]. Over the years, patients with diabetes tend to show abnormalities in the retina, developing a complication called Diabetic Retinopathy (DR). DR is one of the most serious diseases affecting the eye, and it is considered the most common cause of blindness in adults between 20 and 60 years of age [2]. Studies show that people above the age of 30 years that suffer from diabetes for more than 15 years have 78% chance of also having DR. This rate rises to 97% for people below the age of 30 years that suffer from diabetes for the same period of time [3]. Thus, DR affects adults in working age, being a disease that is strongly associated with inability to work, causing significant costs to institutions and governments. It is estimated that the U.S. government has an annual cost of 500 million dollars in the treatment of visual impairments originated by diabetes [4].The earliest signs of DR are characterized by the appearance of red lesions on the wall of the blood vessels of the retina [5], and these red lesions are classified in two ways: microaneurysms and hemorrhages. The microaneurysms can cause narrowing and sometimes blockage of blood vessels of the retina, besides weakening of the blood vessels wall [6]. These microaneurysms may rupture, causing hemorrhages [6]. According to an international classification of severity levels of DR [7], the microaneurysms are commonly present in the early stages of this disease and the hemorrhages tend to manifest in the later stages. Early detection as well as the periodic screening of DR potentially helps in reducing the progression of this disease and in preventing the subsequent loss of visual capability [8]. The detection and screening of RD are performed by analysis of fundus images. Fundus images are captured through an examination which is usually performed in two ways:
fundus photography or fluorescein angiography. Fundus photography is a noninvasive technique for photographing the fundus eye and is commonly used in current methods for detection of microaneurysms and hemorrhages, such as [2, 4, 5, 9]. Fluorescein angiography is an invasive technique based on intravenous injection of a fluorescent substance, which produces images with enhanced contrast. However, this technique is not recommended for large scale screening of diabetic populations. In addition to possible side effects, such as nausea and vomiting, a mortality of 1:222.000 associated with the intravenous use of fluorescein prohibits the application of this technique for large-scale screening purposes [9].In Fig. 1 is shown a fundus image captured in a noninvasive way, containing microaneurysms and hemorrhages.
1 Department of E&TC Engineering, MET’s Institute of engineering, Nashik.India
2 Principal, Bharti Vidyapeeth’s College of Engineering, CBD, Belapur,Navi Mumbai.India
DOI: http://dx.doi.org/10.21172/1.132.06
e-ISSN:2278-621X
Abstract— In the modern world, diabetic retinopathy (DR) has become one of the most severe complication prevalent among diabetic patients. The success rate of its curability solemnly depends on the early stage diagnosis or else will lead to total blindness. The paper proposes a novel method for the automated identification of diabetic retinopathy in fundus images based on machine learning technique. Approach employs a unique sequential execution of image enhancement, noise removal, blood vessels segmentation followed by optic disc elimination, exudates detection, microannynysms and hemorrhages’ detection to extract fundus image features like area of Microannenysms, exudates and hemorrhages, together with texture feature analysis using Gabor and statistical features. Finally features selected are passed into the well-known support vector machine (SVM) and neural network classifier which classifies the images into normal and abnormal classes. Real time and publicly available database analysis shows really encouraging performance metrics of the proposed method using neural network in terms of accuracy.
Figure 1. Fundus image containing microaneurysms and hemorrhages
As shown in Fig. 1, the microaneurysms are small red spots dispersed on the blood vessels wall. On the other hand, the hemorrhages have a larger size, and are characterized by red swellings. The manual detection of these red lesions is made by ophthalmologists and is a slow and error prone activity. Some lesions have a very small size and may go unnoticed even by trained specialists. In addition, manual detection may be considered unfeasible in government programs for mass screening of diabetic populations, since it would require a huge amount of doctors and examinations. Thus, it is evident the need of methods for automatic detection of red lesions in fundus images.
Diabetic retinopathy detection using blood vessel segmentation can be categorized in various steps as follows. 1. Pre-process the iris images to remove noise using median filtering.
2. Image Enhancement: Green plane Extraction and Adaptive Histogram Equalisation. 3. Optic Disc elimination and Blood Vessels Segmentation
4. Exudates Detection 5. Microannenysms Detection
6. Haemorrhages Detection: Microannenyms with area>500
7. Building an offline database of GLCM, features and area of exudates, Microannenysms and hemorrhages of all training images.
8. Train the SVM, and neural network classifier using the computed features of the training data.
9. Pre-process the candidate retinal image using median filtering to remove noise and obtain GLCM, and area features of the candidate Iris image.
10. Recognize the candidate retinal image using SVM, and neural network classification.
This paper is organized as follows: Section 2 presents the preprocessing for image enhancement and noise removal. Section 3 explains the algorithm used for optic disc elimination. Section 4 explains in details the method for detection of microaneurysms and hemorrhages detection presented in this paper; Section 5 explains the various features extraction for machine learning algorithm. Section 6 deals with the classification algorithms such as SVM and neural network. Section 7 shows the results achieved by the proposed method and, finally, Section 8 presents the conclusion of this article.
2. PERPROCESSING
First, the DIARETDB1 images were resized to 640 x 480 pixels in order to reduce the processing time of the method. Later, it was extracted the green channel of the RGB color space, which has better contrast when compared to the other channels [5]. The grayscale image f1 of each fundus image f was obtained according to Eq. (1).
F1 = GreenChannel(f); (1)
After, a Contrast-Limited Adaptive Histogram Equalization (CLAHE) algorithm was applied [10]. This technique consists in applying histogram equalization for each region in the image, enhancing the local contrast of each region. The resulting image was obtained according to Eq. (2).
F2 = CLAHE(f1); (2)
The resulting images of this stage are shown in Fig. 2.
3. OPTIC DISC ELLIMINATION
Exudate detection is our main purpose; however we have to remove the optic disc prior to the process because it appears with similar intensity, colour and contrast to other features on the retinal image. The optic disc is characterized by the largest high contrast among circular shape areas. While vessels also appear with high contrast, the size of the area is much smaller.
3.1 Blood Vessels Segmentation
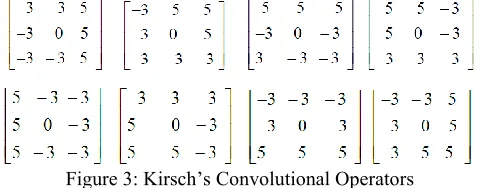
Kirsch templates of size 3x3 are used for the extraction of blood vessels from retinal image Edge detection is a process of identifying the pixel values in order to get frequently and abrupt changes. The generally output of edge detection through Kirsch template is to produce an image containing grey level pixels of value 0 or 255.The value 0 of pixel grey indicates a black pixel and the value 255 indicates a white pixel. Edge information of a particular and target pixel is checked by determining the brightness level of the neighboring pixels. If there is no major difference in the brightness levels then there is no possibility of edge in the image. The described procedure is most common and fundamental approach among all the available edge detection algorithms such as, Prewitt, Sobel etc. In this paper Kirsch template technique is used for the extraction of blood vessels from retinal images. The Kirsch edge detection algorithm uses a single mask of size 3x3 and rotates it in 45 degree increments through all 8 directions as shown in figure 3
Figure 3: Kirsch’s Convolutional Operators
The edge magnitude of the Kirsch operator is calculated as the maximum magnitude across all direction. The matrix contains the information of a pixel and its neighbours. The Kirsch algorithm detects direction of the edge as well as an edge. Accordingly, there are eight possible directions south, east, north, west, northeast, southeast, southwest and northwest as shown in figure 3. Out of the several templates the biggest one is considered for the output value and later the edges are extracted. Kirsch template can set and reset the threshold values to obtain most suitable edge of images. Kirsch template works well for images having clear distinction between the foreground and background. Since the retinal blood vessels can be considered as required foreground information from fundus images, Kirsch algorithm can effectively applied.
Major steps of the method consist of four steps as edge detection, false edge exclusion, vessel junction restoration, and vessel labeling.
1. Detection: Apply Kirsch template to the input retinal image to establish a rule in which it checks the condition for edge detection if it finds positive then it can execute condition further.
2. False edge removal: If condition is no satisfied, then it cannot go ahead.
3. Vessel junction restoration: Fix broken junctions intro-duced by Kirsch template. At a broken junction, track and find the direction of a vessel. Extend the vessel in the opposite direction for a certain length. If another vessel is found, bridge the gap and restore the vessel junction.
4. Vessel labeling: A typical vessel is represented by two parallel edges. vessel labeling step fills the interior pixels of a vessel. The challenging task is to differentiate the area within a vessel and the area between two different vessels that are parallel to each other. Literally it is a comparison method which is used effectively
3.2. Algorithm for Optic Disc Removal
1. Applying a grayscale closing operator (φ) on the intensity channel (fI) will help eliminate the vessels which may remain in the optic disc region. A flat disc-shaped structuring element with a fixed radius of eight (B1) was used.
OP1 = φ (B1)(fI) (1)
2. The resulting image was binarized by thresholding (α1), and the thresholded image was then used as a mask. All the pixels in the mask were inverted before they were overlaid on the original image to remove candidate bright regions.
3. The morphological reconstruction by dilation, R, was then applied on the previous overlaid image.
OP3(x) = RfI(OP2) (2)
4. The dilations of marker image (OP2) under mask image (fI) were repeated until the contour of marker image fits under the mask image.
5. The difference between the original image and the reconstructed image was thresholded at grey level α2 using the following equation.
The value of α2 is different from image to image depending on automated selection using the Otsu algorithm.
6. Normally, the optic disc can be easily identified as the largest area. However, in some cases such as the appearance of huge exudates in the image, there might be some areas in the image which are larger than the optic disc. Because the shape of optic disc is round, therefore the optic disc region selection process needs to be made specific to the largest one among the regions whose shapes are circular. Circularity of the shape of the region is defined by the value of compactness, M, as defined using the following equation:
M = 4π×area /perimeter2 (4)
Where area is the number of pixels in the region and perimeter is the total number of pixels around the boundary of each region. The selected result (largest among circular shapes), OP5, was dilated with a binary dilation operator (δ) in Eq. (5) to ensure that all pixels in the optic disc area are covered. This step, a flat disc-shaped structuring element with a fixed radius of six (B2) is used.
OPseg = δ(B2)(OP5) (5)
All optic disc area in the original image was masked out using the previous output. The result is shown in figure 4.
Figure 4: Optic Disc Elimination
4. EXEUDATES DETECTION
Exudates appear as bright yellow-white deposits on the retinal layer. Their shape and size varies gradually with different stages of retinopathy. Initially extracted green channel image is converted into grayscale image and then preprocessed for uniformity. Then morphological closing operation is carried out to remove the blood vessels. Morphological closing consists of dilation followed by erosion. The canny edge detector is used to detect the edges. Canny edge detector is an edge detecting operator that uses multistage algorithm to detect wide range of edges in images. Strong and weak fine blood vessels can be detected using this canny edge detector. In the beginning green channel image first finds the edges using canny method; before removing the circular border to fill the enclosed small area. Then circular border, edges and larger areas are removed. Being the bright spots on the image, adaptive histogram equalization is applied twice followed by image segmentation to make the exudates visible. Obtained bright features are then compared with large area removed image using AND logic in order to get rid of exudates (Figure 5).
Figure 5: Exudates Detection
Algorithm for exudates detection is detailed as follows Input: Green channel retinal fundus image (Ig)
Output : Exudate segmented image (Iexd)
2. Columnwise neighborhood operation (ψ) 3. Thresholding followed by (β) with disk (SE) 4. Applied with canny edge operator ζ
5. Choosing a region of interest (ROI) 6. Removal of optic disk and border.
7. Morphological erosion operator (ρ) with disk (SE) to give final (Iexd) microannenysms and haemorhages detection
4.1. Detection of Microannenysms
All MAs appear as tiny red dots on retinal fundus image. Therefore the red component of the RGB image is used to identify the MAs. Next, the intensity is then inverted. The blood vessels are extracted from the retinal fundus image. The exudates are detected. The retina; fundus image image is then subtracted from the exudates image and blood vessels image. After which, the holes or gaps are filled, resulting in Mas and other unwanted artifacts present. The image with filled holes or gaps then subtracts the image before filled holes or gaps. The resulting image thus has MAs and other unwanted artifacts without the edge.
Input: Red channel retinal fundus image (Ir) Output: Microaneurysms segmented image (Ima) 1. Inversion of (Ir) to (-Ir)
2. Applied exeudates detection algorithm 3. Perform blood vessel extraction
4. Subtract outputs of 2th and 3th steps from retinal fundus image
4.2. Computing Area of Microaneurysms
This is obtained by using two loops to count the number of pixelswith binary 1 (white) in the final segmented microaneurysms image.
4.3. Hemorrhages Detection
The earliest signs of DR are characterized by the appearance of red lesions on the wall of the blood vessels of the retina, and these red lesions are classified in two ways: microaneurysms and hemorrhages.
The microaneurysms can cause narrowing and sometimes blockage of blood vessels of the retina, besides weakening of the blood vessels wall. These microaneurysms may rupture, causing hemorrhages. According to an international classification of severity levels of DR [7], the microaneurysms are commonly present in the early stages of this disease and the hemorrhages tend to manifest in the later stages.
Microannenysms with area greater than 500 are considered as hemorrhages.
5. FEATURES EXTRACTION FOR MACHINE LEARNING
5.1. Area Features
Afterwards the pre-processing stage, the fundus images features viz: area of haemorhages, area of exudates, and area of microaneurysms are extracted along with texture properties. These metrics are later used to classify the images accurately.
5.2. Statistical Features
The gray-level-co-occurrence matrix (GLCM) is a well-known statistical method for examining the textures which takes into account the spatial relationship of pixels. For representing the texture of the image, GLCM functions calculate the frequency of pairs of pixels having specified values and having specific spatial relationship. Then GLCM is created and statistical measures are extracted from matrix.
The features extracted from GLCM matrix are – GLCM contrast, GLCM homogeneity, GLCM correlation and GLCM energy. GLCM contrast deals with measuring the variance in grayscale levels in the image. GLCM homogeneity deals with the similarity of grayscale levels across the image. Thus, if the changes in grayscale are larger, the GLCM contrast is more. Similarly GLCM homogeneity will be less. Finally, the overall probability of having distinctive grayscale patterns in the image is represented by GLCM energy measures.
5.3. Gabor Features
6. CLASSIFICATION USING SVM AND NEURAL NETWORK
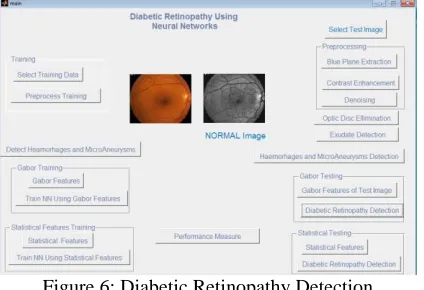
Figure 6 depicts the MATLAB based system designed for diabetic retinopathy detection.
The present work consists of five stages. The main objective is recognition of diabetic retinopathy iris samples. The first step is data collection procedure where diabetic retinopathy iris image samples are taken for further processing and data measurements. Second phase of this experimental study is to pre-process the iris image samples for a standard benchmark and most importantly removal of noises to obtain the enhanced noise free images. Third and one of the most important phases is detection of exudates, hemorrhages and Microannenysms. Then blood vessel segmentation algorithm is followed by optic disc elimination. Then fourth one is feature extraction. Here in this phase Gabor wavelet and GLCM texture based features from the enhanced images are extracted by computing. The area of exudates, hemorrhages and Microannenysms is also considered for features computation. The well-known SVM and Neural network classifiers are trained using these features which are then further used for detection of diabetic retinopathy.
Figure 6: Diabetic Retinopathy Detection
To investigate the effectiveness of the proposed method, entire algorithm was run on all the datasets and results for diabetic retinopathy detection were collected.
Table 1 lists the datasets used in this study to evaluate the performance.
Dataset Name Number of
Normal Images
Number of Diabetic Retinopathy Images
Total Images
DIARETDB0 - Standard Diabetic Retinopathy Database[11]
55 61 116
HRF Dataset[12] 15 15 30
Navkar Hospital,
Nashik(India) 55 79 134
DRIMDB[13] 55 125 180
Sahyadri Hospital,Pune
(India) 45 46 91
Table 1: Datasets Used
7. RESULTS AND PERFORMANCE EVALUATION
As shown in Table 2, the accuracy neural network classifier increases comparatively when we consider the gabor features and area of exudates, hemorrhages and microannenysms for all the datasets under consideration. The neural networks are found to be more promising for recognition of diabetic retinopathy.
Neural Network SVM
55 normal database 79.1667 74.1667
HRF database 46.6667 50
Navkar Hospital, Nashik 88.806 88.806
DRIMDB database 91.6667 91.6667
Sahyadri Hospital, Pune(India) 83.5165 74.7253
As shown in Table 3, the accuracy neural network classifier increases comparatively when we consider the statistical features and area of exudates, hemorrhages and microannenysms for all the datasets under consideration. The neural networks are found to be more promising for recognition of diabetic retinopathy.
Dataset Name Neural Network SVM
55 normal database 87.5 74.1667
HRF database 96.6667 90
Navkar Hospital, Nashik(India) 100 100
DRIMDB database 100 100
Sahyadri Hospital, Pune(India) 100 91.2088
Table 3: Accuracy Using Statistical Features
8. CONCLUSION
For detection of diabetic retinopathy, we have performed the blood vessel segmentation followed by optic disc elimination. Then we have detected area of exudates, hemorrhages and Microannenysms. After segmentation of blood vessels, instead of considering only area of exudates, hemorrhages and microannenysms of the iris, we have considered the global texture features of the iris image along with area of exudates, hemorrhages and microannenysms Though, the number of images used to evaluate the performance of the proposed system is not more, the performance of the system and the results are interesting. The GLCM and Gabor texture features are considered separately. For classification, we have used SVM and Neural Networks classifier. For the performance evaluation of DRIVE, DIARETDB0 and HRF standard diabetic retinopathy image dataset, the recognition process is carried out. The Neural networks gives more promising results as compared with SVM in both gabor and statistical features.
9. ACKNOWLEDGMENT
The authors would like to thank HRF database center[12], DRIMDB database center[13], Navkar Hospital nashik, Sahyadri Hospital Pune, for their support in providing the retinal images.
10. REFERENCES
[1] World Health Organization, International Diabetes Federation, “Diabetes”,http://www.who.int/mediacentre/factsheets/fs312/en/index.html (Jun. 5, 2013).
[2] T. Walter, P. Massin, A. Erginary, R. Ordonez, C. Jeulin, and J. Klein, (2007) “Automatic detectionof microaneurysms in color fundus images,” Medical Image Analysis, Vol. 11, pp. 555-566.
[3] B. Sujithkumar, and V. Singh, (2012) “Automatic Detection of Diabetic Retinopathy in Non-dilatedRGB Retinal Fundus Images”, International Journal of Computer Applications, Vol. 47, No. 19, pp. 26-32.
[4] S. C. Lee, E.T. Lee, R. M. Kingsley, Y. Wang, D. Russell, R. Klein, and A. Warn, (2001) “Comparison of diagnosis of early retinal lesions of diabetic retinopathy between a computer system and human experts”, Arch. Ophthalmol, Vol. 119, pp. 509–515.
[5] H. F. Jaafar, A. K. Nandi, and W. Al-Nuaimy, (2011) “Automated detection of red lesions from digital colour fundus photographs”, Proceedings: Conf Proc IEEE Eng Med Biol Soc, pp. 6232–6235.
[6] L. Albuquerque, “O que é a retinopatia diabética?”, http://www.institutoprovisao.com.br/diabetes.html/ (Jun. 5, 2013).
[7] T. A. Ciulla, A. G. Amador, and B. Zinman, (2003) “Diabetic Retinopathy and Diabetic Macular Edema: Pathophysiology, screening, and novel therapies”, Diabetes Care, Vol. 26, No. 9, pp. 2653-2664.
[8] D. Saleh, and C. Eswaran, (2012) “An automated decision-support system for non-proliferative diabetic retinopathy disease based on MAs and HAs detection”, Computer Methods and Programs in Biomedicine,Vol. 11, No. 1, pp. 186-196.
[9] M. Niemeijer, B. V. Ginneken, J. Staal, M. S. Suttorp-Schulton and M. D. Abramoff, (2005) “Automatic detection of red lesions in digital color fundus photograph”, IEEE Trans Med Imaging, Vol. 24, No. 5, pp. 584-592.
[10] K. Zuiderveld, (1994 ) “Contrast Limited Adaptive Histogram Equalization,” Chapter VIII.5, Graphics Gems IV. P.S. Heckbert (Eds.), Cambridge, MA, Academic Press, pp. 474–485.
[11] Kauppi, T., Kalesnykiene, V., Kamarainen, J.-K., Lensu, L., Sorri, I., Uusitalo, H., Kälviäinen, H., Pietilä, J., DIARETDB0: Evaluation Database and Methodology for Diabetic Retinopathy Algorithms, Technical report
[12] High-Resolution Fundus (HRF) Image Database: https://www5.cs.fau.de/research/data/fundus-images/