JETIR1612026 Journal of Emerging Technologies and Innovative Research (JETIR) www.jetir.org 177
An ISM-Based Analysis for Modeling Factors
in Food Processing Plant for the
Implementation of Total Productive
Maintenance (TPM)
Rajkumar Sahu1 , Meghraj2, Prof. H R Chandrakar 1,2
Department of Mechanical Engg. (Industrial Engg. & management) M.Tech Scholar Chhatrapati Shivaji Institute of Technology, Durg, India
3Professor in Mechanical Engineering, Chhatrapati Shivaji Institute of Technology, Durg, India
Abstract -In this case study the data collected are analyzed and observed that barriers in the Pet Food Plant
causes have low overall equipment effectiveness as compared to the word-class overall equipment effectiveness which means that it requires to improve in OEE. For the reason of low OEE various tools applied like MICMAC analysis in the Pet Food Plant of IB Group Food Processing Industry. The pillars of TPM is very essential for the development of the Plant because it help to reduce the uncertainty of the Plant up to certain extent as it has used in this case study and the result obtained by the implementation of TPM model the total OEE of the plant increases. The effective implementation of total productive maintenance (TPM) leads to many benefits such as improved productivity, quality, and flexibility and also reduction in cost.
IndexTerms— Total Productive Maintenance (TPM), overall equipment effectiveness (OEE), Barriers,
MICMAC analysis.
I . INTRODUCTION
TPM is a techniques and an effective tool which aimed at increasing the productivity and quality of the product by reducing the breakdown, rejection, proper maintenance and availability of equipment at right time and focusing toward no defect. TPM is a lean tool which establishes a system of productive maintenance, covers all departments, entire life cycle of machines and its surroundings, involves participation of all the employees from the top to bottom i.e., from management to the shop floor of the organization. TPM is such an innovative approach to optimize Overall equipment effectiveness, reduce loses, eliminates sudden breakdowns, and promotes autonomous operator maintenance through day-to-day activities involving the total workforce. TPM needs the involvement of everyone in the organization including operators to senior management for the process of equipment improvement. Total productive maintenance (TPM) is a complete system which has an aims to achieve the maximum production by eliminating the defective products, downtime, unwanted stoppages and accidents.
II . LITERATURE REVIEW
The use of advanced maintenance techniques such as total productive maintenance (TPM) is frequently being used by the industries to have edge on others. Application of total productive maintenance in any industry requires a dedicated team to implement the concept systematically [1]. The ability of employees to control the work and to decide about the way they handle and receive information is a key factor of improving productivity and service quality [2].The author (Parikh and Mahamuni [3]) explained that the TPM is all about teamwork, it is a strategy that can help to achieve a world class level of overall equipment effectiveness (OEE) which is otherwise become difficult to achieve solely by equipments.
The author (Raj and Sanukrishna [4]) investigates the imperfections of the existing maintenance policy of an industry and corrective actions were suggested and implemented accordingly to increase the percentage effectiveness of some critical equipment. The suggestion given is one of crucial and a widespread applied tool of performance measurement in manufacturing industry is Overall Equipment Effectiveness (OEE) [5].
JETIR1612026 Journal of Emerging Technologies and Innovative Research (JETIR) www.jetir.org 178
equipment availability, which is influenced by equipment reliability and maintainability [6]. To minimize the operating cost and production cost as per world class products. Maintenance Practice is considered as an important function to increase the Productivity by maximizing the overall equipment effectiveness [7]. While implementing TPM some barriers found which effect the implementation but it is the only thing between the success and failure for many companies as far as the maintenance is concern and to overcome these failures TPM 8 pillars are used for achieving its goal of success [8].
III .TPM was introduced to achieve the following objectives
1. Avoid wastage by reducing the unwanted operations.
2. Producing goods without reducing product quality of the goods. 3. Reduce the Production cost.
4. Produce a small lot size at the earliest possible time. 5. Produce less number of non defective products.
IV .Methodology
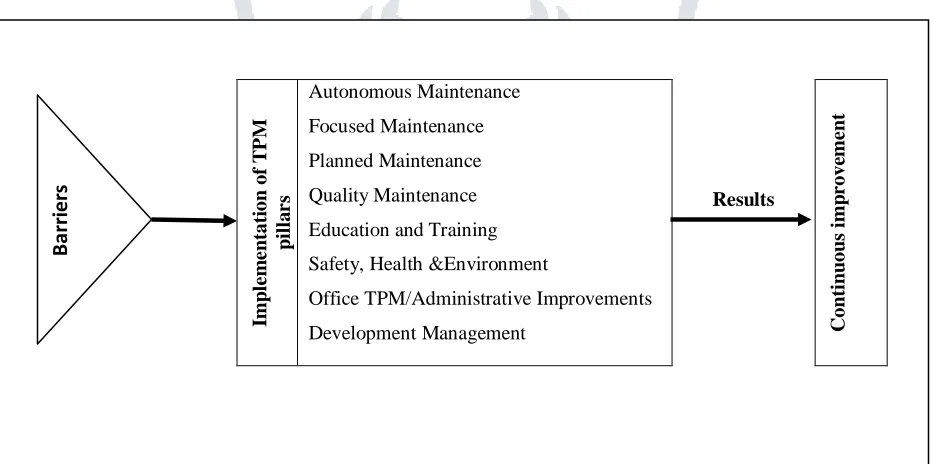
The methodology employed to identifies the existing operations in the facilities with the help of detailed study. Further root cause barriers are pointed out to reduce unproductive time and to increase the overall equipment effectiveness and efficiency of the existing system. After analysis of machines in Food Processing unit some of the barriers are sorted out and on the basis of the analysis 10 main barriers are selected and ISM approach have been used and then TPM pillars is implemented to achieve the objectives of this research and for this the methodology used as Integrated model of TPM Pillars is shown in Figure 1.
Figure 1: Integrated model of TPM Pillars
Barriers of the Plant
The barriers are sorted out by the analysis, views and advice of the employees in whole Food Processing unit during the working shift of the machine, which majorly effecting the production work of the machine and cause unproductive time which leads to delay in finishing of the food product and ultimately it become burden to entire department of Food Processing unit.
1. Large scale competition 2. Burden of taxes 3. Lack of flexibilities 4. Environment factors 5. Misunderstanding
6. Seasonal or off seasonal factors
Imp le m e n tati on of T P M p il la r s Autonomous Maintenance Focused Maintenance Planned Maintenance Quality Maintenance
Education and Training
Safety, Health &Environment
Office TPM/Administrative Improvements
JETIR1612026 Journal of Emerging Technologies and Innovative Research (JETIR) www.jetir.org 179
7. Lack of perseverance 8. Lack of resources 9. Finance problem
10. Uncertain vendor pressure 11. Longer lead time
12. Technical errors 13. Wrong forecast
14. Lack of knowledge of TPM 15. Material handling system 16. Need for training
An ISM approach for modeling of Barriers
The fundamental idea obtain from ISM modelling for converting the complex factors into several sub factors by utilization was developed by J. Warfield to find the complex systematic model. The ISM methodology is interpretive from the fact that as the judgment of the group decides whether and how the variables are related. It is a modelling technique in which the specific relationships of the variables are taken and the overall structure of the system which links to each other are considered as portrayed in a digraph model. The ISM model formed portrays the structure of a complex issue or problem in a carefully designed pattern implying graphics form as well as words (Singh et al. [9]; Ravi and Shankar [10]).
The various steps used in the ISM technique are:
1. Identify the elements which are relevant to the problem. This could be done by a survey.
2. Establish a contextual relationship between elements with respect to which pairs of elements would be examined.
3. Develop a structural self-interaction matrix (SSIM) of elements. This matrix indicates the pair-wise relationship among elements of the system. This matrix is checked for transitivity.
4. Develop a reachability matrix from the SSIM. 5. Partition the reachability matrix into different levels. 6. Convert the reachability matrix into conical form.
7. Draw digraph model as per the relationship given in reachability matrix and remove transitive links. 8. Convert the resultant digraph into an ISM-based model by replacing element nodes with the statements. 9. Review the model to check for conceptual inconsistency and make the necessary modifications.
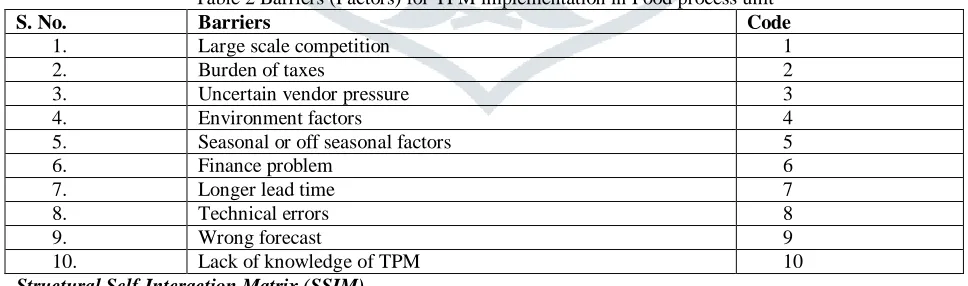
To reach the contextual correlation of barriers for TPM implementation ISM model is developed by following the procedure as shown in steps. ISM method is applied to improve the continuous flow production-Table 2 shows barriers for TPM implementation in Food process industry.
Table 2 Barriers (Factors) for TPM implementation in Food process unit
S. No. Barriers Code
1. Large scale competition 1
2. Burden of taxes 2
3. Uncertain vendor pressure 3
4. Environment factors 4
5. Seasonal or off seasonal factors 5
6. Finance problem 6
7. Longer lead time 7
8. Technical errors 8
9. Wrong forecast 9
10. Lack of knowledge of TPM 10
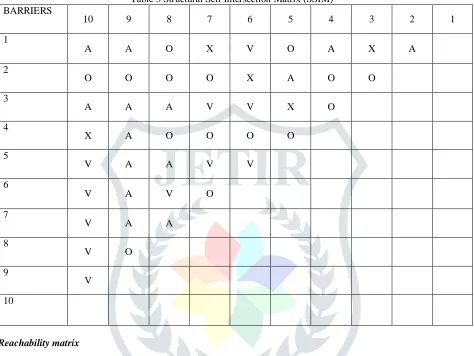
Structural Self-Interaction Matrix (SSIM)
Experts, both from industry and academia, have been consulted in identifying and developing the contextual relationship among the barriers. Following four symbols have been used to denote the direction of the relationship between two enablers (i and j). On the basis of this, contextual relationship between the identified barriers is developed.
JETIR1612026 Journal of Emerging Technologies and Innovative Research (JETIR) www.jetir.org 180
3. X for both direction relations (i.e., barriers i and j will influence each other) 4. O for no relation between the barriers (i.e., barriers i and j are unrelated).
To obtain consensus, the SSIM was discussed in a group of experts and based on their responses, SSIM has been finalized and it is presented in Table 3.
Table 3 Structural Self Intersection Matrix (SSIM) BARRIERS
10 9 8 7 6 5 4 3 2 1
1
A A O X V O A X A
2
O O O O X A O O
3
A A A V V X O
4
X A O O O O
5
V A A V V
6
V A V O
7
V A A
8
V O
9
V
10
Reachability matrix
The SSIM is transformed into a reachability matrix format by transforming the information in each entry of the SSIM into 1s and 0s in the reachability matrix. The substitution of 1s and 0s are as per the following rules:
1. If the (i, j) entry in the SSIM is V, then the (i, j) entry in the reachability matrix becomes 1 and the (j, i) entry becomes 0.
2. If the (i, j) entry in the SSIM is A, then the (i, j) entry in the matrix becomes 0 and the (j, i) entry becomes 1. 3. If the (i, j) entry in the SSIM is X, then the (i, j) entry in the matrix becomes 1 and the (j, i) entry also becomes
1.
4. If the (i, j) entry in the SSIM is O, then the (i, j) entry in the matrix becomes 0 and the (j, i) entry also becomes 0.
Following the above rules, SSIM is transformed into a initial reachability matrix is shown in Table 4.
BARRIERS 1 2 3 4 5 6 7 8 9 10
1. 1 0 1 0 0 1 1 0 0 0
2. 1 1 0 0 1 1 0 0 0 0
3. 1 0 1 0 1 1 1 0 0 0
JETIR1612026 Journal of Emerging Technologies and Innovative Research (JETIR) www.jetir.org 181
Table 4 Initial reachability matrix (IRM)
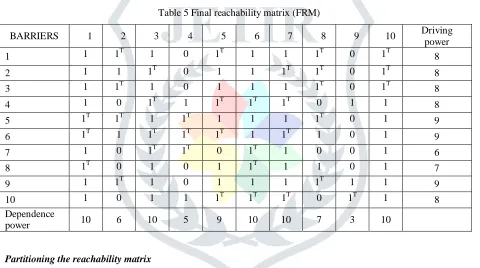
The next step of ISM is prepared the final reachability matrix; the initial reachability matrix is converted into final reachability matrix by using the transitivity principle. The transitivity principle shows that the factors A link from factor B and factor B link from factor C than the factor A should link from factor C [9, 10]. It is shown in Table 5 with driving power and dependence power.
Table 5 Final reachability matrix (FRM)
Partitioning the reachability matrix
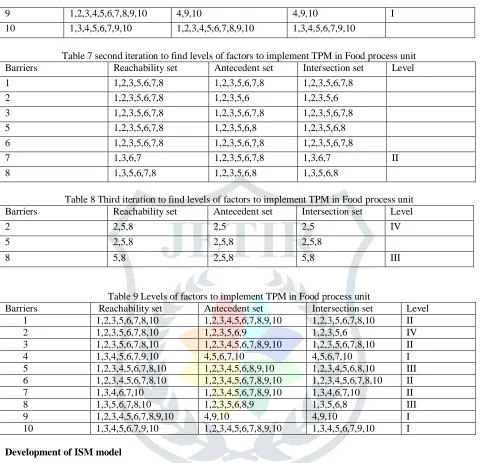
To find out the levels of barriers it is required to partitioned matrix into the reachability set and antecedent set and interaction between them [39]. The four iterations in the ISM model are shown respectively, in the Table 6 – 8. The results of the four iterations in ISM model are amalgamated and shown in Table 9.
Table 6 First iteration to find levels of factors to implement TPM in Food process unit Barriers Reachability set Antecedent set Intersection set Level 1 1,2,3,5,6,7,8,10 1,2,3,4,5,6,7,8,9,10 1,2,3,5,6,7,8,10
2 1,2,3,5,6,7,8,10 1,2,3,5,6,9 1,2,3,5,6
3 1,2,3,5,6,7,8,10 1,2,3,4,5,6,7,8,9,10 1,2,3,5,6,7,8,10
4 1,3,4,5,6,7,9,10 4,5,6,7,10 4,5,6,7,10
5 1,2,3,4,5,6,7,8,10 1,2,3,4,5,6,8,9,10 1,2,3,4,5,6,8,10 6 1,2,3,4,5,6,7,8,10 1,2,3,4,5,6,7,8,9,10 1,2,3,4,5,6,7,8,10
7 1,3,4,6,7,10 1,2,3,4,5,6,7,8,9,10 1,3,4,6,7,10
8 1,3,5,6,7,8,10 1,2,3,5,6,8,9 1,3,5,6,8
5. 0 0 1 0 1 1 1 0 0 1
6. 0 1 0 0 0 1 0 1 0 1
7. 1 0 0 0 0 0 1 0 0 1
8. 0 0 1 0 1 0 1 1 0 1
9. 1 0 1 0 1 1 1 0 1 1
10. 1 0 1 1 0 0 0 0 0 1
BARRIERS 1 2 3 4 5 6 7 8 9 10 Driving
power
1 1 1T 1 0 1T 1 1 1T 0 1T 8
2 1 1 1T 0 1 1 1T 1T 0 1T 8
3 1 1T 1 0 1 1 1 1T 0 1T 8
4 1 0 1T 1 1T 1T 1T 0 1 1 8
5 1T 1T 1 1T 1 1 1 1T 0 1 9
6 1T 1 1T 1T 1T 1 1T 1 0 1 9
7 1 0 1T 1T 0 1T 1 0 0 1 6
8 1T 0 1 0 1 1T 1 1 0 1 7
9 1 1T 1 0 1 1 1 1T 1 1 9
10 1 0 1 1 1T 1T 1T 0 1T 1 8
Dependence
JETIR1612026 Journal of Emerging Technologies and Innovative Research (JETIR) www.jetir.org 182
9 1,2,3,4,5,6,7,8,9,10 4,9,10 4,9,10 I
10 1,3,4,5,6,7,9,10 1,2,3,4,5,6,7,8,9,10 1,3,4,5,6,7,9,10
Table 7 second iteration to find levels of factors to implement TPM in Food process unit Barriers Reachability set Antecedent set Intersection set Level
1 1,2,3,5,6,7,8 1,2,3,5,6,7,8 1,2,3,5,6,7,8
2 1,2,3,5,6,7,8 1,2,3,5,6 1,2,3,5,6
3 1,2,3,5,6,7,8 1,2,3,5,6,7,8 1,2,3,5,6,7,8
5 1,2,3,5,6,7,8 1,2,3,5,6,8 1,2,3,5,6,8
6 1,2,3,5,6,7,8 1,2,3,5,6,7,8 1,2,3,5,6,7,8
7 1,3,6,7 1,2,3,5,6,7,8 1,3,6,7 II
8 1,3,5,6,7,8 1,2,3,5,6,8 1,3,5,6,8
Table 8 Third iteration to find levels of factors to implement TPM in Food process unit Barriers Reachability set Antecedent set Intersection set Level
2 2,5,8 2,5 2,5 IV
5 2,5,8 2,5,8 2,5,8
8 5,8 2,5,8 5,8 III
Table 9 Levels of factors to implement TPM in Food process unit
Barriers Reachability set Antecedent set Intersection set Level
1 1,2,3,5,6,7,8,10 1,2,3,4,5,6,7,8,9,10 1,2,3,5,6,7,8,10 II
2 1,2,3,5,6,7,8,10 1,2,3,5,6,9 1,2,3,5,6 IV
3 1,2,3,5,6,7,8,10 1,2,3,4,5,6,7,8,9,10 1,2,3,5,6,7,8,10 II
4 1,3,4,5,6,7,9,10 4,5,6,7,10 4,5,6,7,10 I
5 1,2,3,4,5,6,7,8,10 1,2,3,4,5,6,8,9,10 1,2,3,4,5,6,8,10 III
6 1,2,3,4,5,6,7,8,10 1,2,3,4,5,6,7,8,9,10 1,2,3,4,5,6,7,8,10 II
7 1,3,4,6,7,10 1,2,3,4,5,6,7,8,9,10 1,3,4,6,7,10 II
8 1,3,5,6,7,8,10 1,2,3,5,6,8,9 1,3,5,6,8 III
9 1,2,3,4,5,6,7,8,9,10 4,9,10 4,9,10 I
10 1,3,4,5,6,7,9,10 1,2,3,4,5,6,7,8,9,10 1,3,4,5,6,7,9,10 I
Development of ISM model
JETIR1612026 Journal of Emerging Technologies and Innovative Research (JETIR) www.jetir.org 183 Figure.2 Digraph showing levels of TPM barriers
Next, the digraph developed as shown in Figure 2 is converted into an ISM model by replacing nodes of the each element with statements as shown in Figure 3. ISM modelling highlights the main factors (barriers) for TPM in Food Process Industry require more attention for tackle these barriers. By replacing the nodes it becomes easy to analysis the barriers that how these barriers are linked with each other and hampering the entire unit of the Food Processing unit.
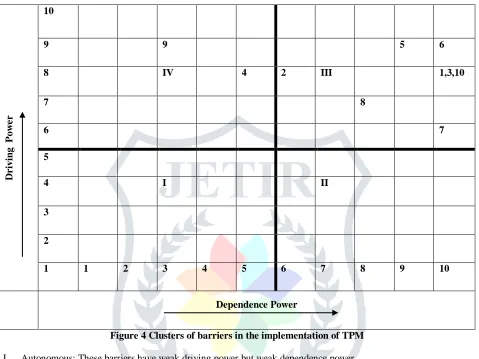
Figure 3 ISM model barriers for TPM in Food Process Industry MICMAC Analysis
JETIR1612026 Journal of Emerging Technologies and Innovative Research (JETIR) www.jetir.org 184
power and dependence power of barriers is shown in Table 4. The driving power and dependence power diagram is drawn as shown in Figure 4. This Figure has been divided into four different clusters. First cluster contains „autonomous barrier‟, second cluster contains „dependent barrier‟, third cluster contains „linkage barrier‟ and fourth cluster contains „independent barrier‟.
D
r
ivi
n
g
P
ow
e
r
10
9 9 5 6
8 IV 4 2 III 1,3,10
7 8
6 7
5
4 I II
3
2
1 1 2 3 4 5 6 7 8 9 10
Dependence Power
Figure 4 Clusters of barriers in the implementation of TPM
I. Autonomous: These barriers have weak driving power but weak dependence power II. Dependent: These barriers have weak driving power but strong dependence power. III. Linkages: These barriers have strong driving power as well as strong dependence power. IV. Independent: These barriers have strong driving power but weak dependence power.
The barriers are identified from the analysis are put into an ISM model to analyze the interaction between them. There are no autonomous barriers seen in the driver-dependence diagram Figure 4. The absence of these barriers brings light to the fact that all the considered barriers influence the TPM in Food Process Industry. But in the II cluster there are no barriers which have a weak driving power, but strong dependence on other barriers. This indicates that it is not requires overcome difficulties in II cluster for successful implementation of TPM in Food Process Industry. Large scale competition, Burden of taxes, uncertain vendor pressure, Seasonal or off seasonal factors, Finance problem, longer lead time, Technical errors, Lack of knowledge of TPM which comes under category of linkage variables. They have strong driver power and strongly dependence power. These enablers should be studied even more carefully than the others. The analysis of IV cluster having Environment factors and Wrong forecast is ranked as Independent enablers as they are having the maximum driver power. This implies that this variable is key barrier in the successful implementation of TPM in Food Process unit.
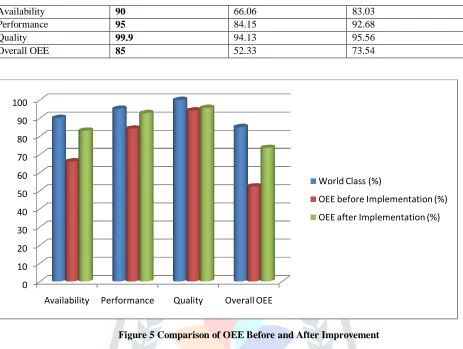
Comparison the result of OEE before and after Improvement
Table 10 Result of OEE before and after Improvement
OEE Factor World Class (%) OEE before
Implementation (%)
OEE after
JETIR1612026 Journal of Emerging Technologies and Innovative Research (JETIR) www.jetir.org 185
Availability 90 66.06 83.03
Performance 95 84.15 92.68
Quality 99.9 94.13 95.56
Overall OEE 85 52.33 73.54
Figure 5 Comparison of OEE Before and After Improvement
Overall equipment effectiveness (OEE) is compared with the before TPM implementation of OEE and world class OEE as shown above in the Table 10 and Figure 5. This table shows that the company is not achieved output as compare to the world class Availability, Performance Rate, Quality Rate and OEE.
V. CONCLUSIONS & DISCUSSIONS
As TPM is a fundamental tool to perform continuous program which provides the maintenance to the machines and plant so that it works efficiently and reduce the unwanted stoppage to achieve the efficiency as per the bench mark set by the world class OEE. So, the company needs to improve their system machines and reduce the waste time and operation. By inspecting in regular interval of time for improvement of system right from the raw materials inventory to the work in process finished with finish goods inventory can help to raise the performance of Pet Food Plant. Overall Equipment Effectiveness has improved from 52.33% to 73.54% indicating the improvement in productivity and improvement in quality of product.
VI.ACKNOWLEDGMENT
I would like to express our sincere gratitude to Mr. Kripa Shankar Dixit (HOD of Pet Food plant IB group) and all the employee of this department for their instructive advices and for delivering the knowledge. Finally I would like to thanks my friend Mr. Meghraj Chandra and my parents for their love and support.
REFERENCES
[1] Yash Dave, “Potential Benefits of TPM (Total Productive Maintenance) Implementation”, International Journal of Latest Research in Science and Technology, Volume 2, Issue 2, Page No.173-174 , March - April (2013), ISSN (Online):2278-5299.
[2] Tamer H. Haddad and Dr. Ayham A.M. Jaaron, “The Applicability of Total Productive Maintenance for Healthcare Facilities: an Implementation Methodology”, International Journal of Business, Humanities and Technology Vol. 2 No. 2, page 148-155, March 2012.
0 10 20 30 40 50 60 70 80 90 100
Availability Performance Quality Overall OEE
World Class (%)
OEE before Implementation (%)
JETIR1612026 Journal of Emerging Technologies and Innovative Research (JETIR) www.jetir.org 186
[3] Yash Parikh and Pranav Mahamuni, “Total Productive Maintenance: Need & Framework”, International Journal of Innovative Research in Advanced Engineering (IJIRAE), Issue 2, Volume 2 (February 2015), Page 126-130, ISSN: 2349-2163.
[4] Nithin Raj and Sanukrishna S S, “Overall Equipment Effectiveness Improvement by Implementation of TPM- A study”, International Journal of Advanced Research ,Volume 2, Issue 12, Page 461-468, 2014, ISSN 2320-5407.
[5] Ratapol Wudhikarn, “A Framework for Integrating Overall Equipment Effectiveness with Analytic Network Process Method”, International Journal of Innovation, Management and Technology, Vol. 4, No. 3, Page 351-355, June 2013.
[6] Mr. Nilesh Ayane and Mr. Mangesh Gudadhe, “Review Study on Improvement of Overall Equipment Effectiveness in Construction Equipments”, International Journal of Engineering Development and Research, Volume 3, Issue 2, Page 487-490, 2015, ISSN: 2321-9939.
[7] Vijay D Kedaria and Prof. Vivek A. Deshpande, “Implementation of Total Productive Maintenance Methodology: A Review”, International Journal of Emerging Technology and Advanced Engineering, Volume 3, Issue 4, Page 644-648, March 2014, ISSN 2250-2459.
[8] Sarang G. Katkamwar, Sadashiv K. Wadatkar and Ravikant V. Paropate, “Study of Total Productive Maintenance & Its Implementing Approach in Spinning Industries”, International Journal of Engineering Trends and Technology (IJETT, Volume4, Issue5, Page1750-1754, May 2013, ISSN: 2231-5381.
[9] MD Singh, R Shankar, R Narain and A Agarwal, “An interpretive structural modeling of knowledge management in engineering industries”, Journal of Advances in Management Research, Volume 01, Issue No. 01, Pp. 28–40, October 2003.