Quantification of Partial Volume Effects in Single Photon
Emission Computed Tomography
Mpumelelo Nyathi, Department of Medical Physics, Sefako Makgatho Health Sciences University, South Africa.
Mpho Enoch Sithole, Department of Physics, Sefako Makgatho Health Sciences University, South Africa.
Abstract-- Introduction: Partial volumes effects (PVEs) are caused by the limited spatial resolution of the imaging system. They hinder accurate quantification of images of organs with diameters less than two-three times the full width half maximum of the imaging system. PVEs can manifest either out or spill-in effects spill-in non-radioactive and radioactive backgrounds respectively. Spill-out effects leads to underestimation of activity counts due "loss" of organ activity, spill-in effects results in overestimation due to movement of background activity counts into the organ. For successful implementation of diagnostic and therapeutic outcomes based on quantitative values, PVEs quantification must be prioritized. The objective of this study was to quantity PVEs in single photon emission computed tomography.
Methods: Images of spheres A, B and C of diameters 26 mm; 20 mm and 16 mm (filled with technitium-99m of activity
concentration 74 kBq/ml) mounted inside a Jaszczak phantom were acquired with a gamma camera. Three background activities (0%; 0.5% and 1% activity of 74 kBq/ml) were used. Images were quantified using ImageJ software.
Results: Underestimation of image counts increased with decrease in sphere size. Quantification errors were: 54%; 55% and 66% in the order of decreasing sphere size for 0% background activity. For background activities 0.5% and 1% overestimation resulted in quantification errors of 65%; 61% and 55% and 58%; 53% and 46% respectively. Spill-out and spill-in effects cancelled out as background activity increased.
Conclusion: Quantification of PVEs should be prioritised when monitoring radionuclide therapy and where quantitative values are required to reach diagnostic conclusions.
Index Term-- Partial volume effects, quantification, spill-out, spill-in effects
1 INTRODUCTION
Image quantification is important for successful implementation of diagnostic and therapeutic outcomes.1 It has been a major objective in nuclear medicine from the early years of use. Quantification of nuclear medicine images acquired using planar, single photon computed tomography (SPECT) and positron emission tomography (PET) techniques allow functional and molecular characterization of in-vivo
processes.2 During treatment of patients with no-Hodgkin B-cell
lympohoma using 90Y, quantification of nuclear medicine images of organs plays a significant role in determining
specific patient internal dosimetry of the targeted organs as well as tumours at several imaging time points thus ascertaining successful therapy.3
Accurate quantification of activity in voxels, tumours as well as in targeted organs is important also for approval of new imaging agents. SPECT images of tumours are required to evaluate the success of therapy and also in cases where monitoring of therapy is essential in order to arrive at a decision on whether to continue or discontinue therapy based on patient benefit. Therapy usually is discontinued in cases where toxicity to patient outweighs benefit. Accurate quantification of SPECT images is however hindered by partial volume effects (PVEs). The latter are attributed to the limited spatial resolution of the imaging system. PVEs may result in either loss or gain in activity counts within a targeted structure leading to failure to obtain accurate quantitative values from nuclear medicine images. Section 1.1 discusses PVEs in detail. Failure to prioritise PVEs when monitoring treatment of smaller tumours may portray them as less aggressive compared to a bigger ones when they are actually more aggressive.4 Pharmacokinetics studies also rely on quantification of activity for approval of new radiopharmaceutical drugs.5
PVEs quantification can also be applied to optimise treatment of neuroendocrine tumours using Lutetium-177 (Lu-177) radionuclide.6 In order to optimize treatment whilst minimizing toxicity to kidneys, SPECT images of kidneys may be quantified so as to determine the radiation risks associated with the treatment. Without quantification of PVEs, quantitative values from kidney SPECT images remain inaccurate. They cannot be confidentially used to arrive at an informed decisions on the kidney toxicity. Ability to accurately quantify the accumulation of Lu-177 in the kidneys would enable clinicians to measure kidney toxicity and optimize treatment. Lu-177 emits a beta particles hence their excessive accumulation in the kidneys may lead to radiation injury.6
resolution of the imaging system, patient motion, PVEs and statistical noise due to low photon count or detection.5
Photon attenuation and scatter have since been successfully accounted for resulting in improved quantification.57 Attenuation correction relies on obtaining spatial distribution of attenuation coefficients to model the imaged object, often derived from computed tomography data to compensate for non-uniform attenuation. Scatter correction techniques for SPECT imaging include the use of the dual window method. The method makes use the energy window abutting the photo peak in lower energy, in order to estimate the scatter fraction in the photo peak. Choosing of a narrow energy window within a photo peak have the potential to minimize scatter contributions and achieves a better contrast of the image.8 Strategies have also been introduced to account for patient and organ motion, these include reduction of scanning time and increase in sensitivity of the detector. Much interests and effort have since been directed on cardiac respiratory gating. Although not available in routine imaging advanced techniques have made it possible to remove motion blur by combining all gates whilst keeping sensitivity.2
A large number of improvements in the gamma camera imaging system, dedicated research that have been coupled with introduction and successful implementation of photon attenuation and scatter as well as strategies to account for
patient motion have made quantification a reality in nuclear medicine. However, accurate quantification of activity distribution in small structures or organs with diameters less than a 2-3 times the full width half maximum (FWHM) of the imaging system still remains elusive due to the limited spatial resolution of the imaging system.
1.1 Partial volume effects
The limited spatial resolution contributes to formation of blurred images and underestimation of activity in small targeted organs,2,7 a phenomenon commonly referred to as PVEs.7 Apparent loss of radioactivity is due to increase in spatial resolution-related effects from loss due to tissue function and limited spatial resolution of the imaging system.9,10,11 Underestimation or overestimation of activity also depends on the effects of spill-out and spill-in respectively.2,10
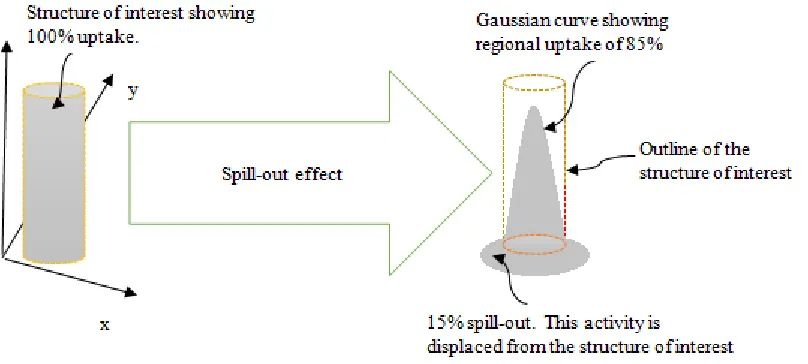
The PVEs may manifests as spill-out effects in a non-radioactive background or as both spill-out and spill-in effects in a radioactive background. Spill-out effects are a result of “loss” of activity from the organ of interest into the background resulting in underestimation of the regional distribution of organ activity. Figure 1 below, shows the concept of spill-out effect.
Fig. 1. Spill-out results in “loss” of activity from the organ or structure of interest hence apparent decrease in activity in the structure
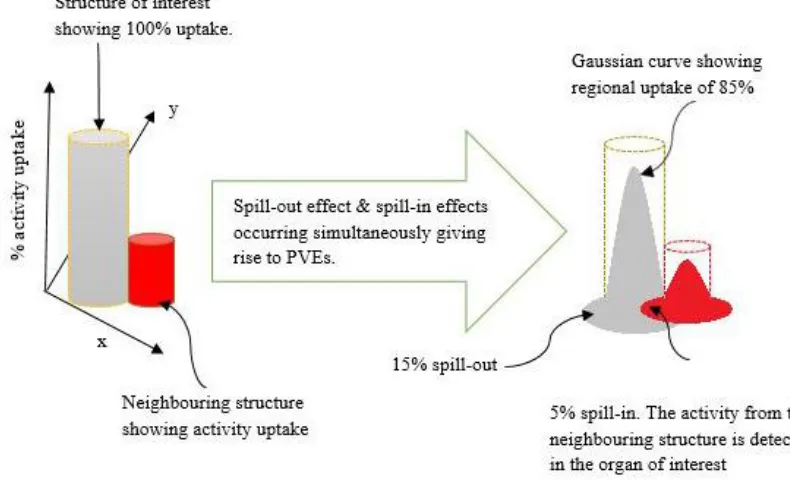
Spill-in effects occur when activity from the neighboring structure or background blurs into the organ of interest leading to overestimation of the detected nuclear medicine signal. This effect occurs simultaneously with the spill-out effect in a radioactive background leading to cancellation of some spill-out and spill-in activity counts hence reduction in quantitative
Fig. 2. Spill-out and spill-in effects occurring simultaneously in the presence of radioactive neighbouring organ.
The cancellation between spill-out and spill-in effects shown in figure 2 depends on the object size, the activity levels within the structure and background activities as well as the spatial resolution of the gamma camera.
In order to achieve accurate quantitative values of the
distribution of the radiotracer it is agreeable that some form of PVEs quantification must be implemented.13,15,16 Previously several PVEs correction techniques have been implemented. These were designed for PET.13,14,16 However, none of them have since been co-opted into routine clinical imaging or may be considered as gold standard. Majority of these PVEs correction techniques originally intended for PET have since been applied in SPECT. Use of these PVEs correction techniques that were intended for PET will indeed not yield to absolute results when used in SPECT since PET and SPECT have fundamental differences. In PET the point spread function (PSF) is assumed to invariant yet it SPECT it is well known to vary with the distance from the collimator.10 For this reason, a PVEs correction technique designed for PET cannot be expected to yield desired results when used in SPECT imaging. This study therefore was aimed at implementing a PVEs quantification technique using ImageJ software specifically intended for SPECT images reconstructed using filtered back projection technique (FBP) technique.
1.2 The gamma camera
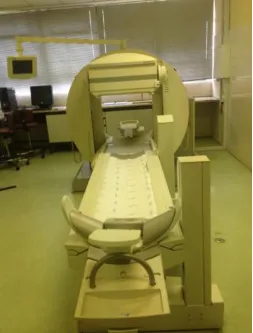
The quality of Nuclear Medicine images more than any imaging system relies on the skilful manipulation of the gamma camera by the nuclear medicine technologist. Furthermore, a gamma camera can only acquire good quality images if the medical physicists runs an effective quality control (QC) programme. The gamma cameras are manufactured by various companies among which include Siemens and Philips. Figure 3 shows a Siemens E-Cam dual head gamma camera. Although manufactured by different companies all gamma cameras are based on the scintillation principle by Hal O. Anger.1,7,18,19
Fig. 3. Siemens E-Cam dual head gamma camera
1.2.1 The gamma scintillation cameras are widely used in clinical imaging and research. During clinical imaging two dimensional (2D) or three dimensional (3D) images are acquired. These may be analysed quantitatively or quantitatively to answer a patient problem. All the nuclear medicine images are acquired from a process that involves introduction of a minute radionuclide into the body either by intravenous injection or inhalation or ingestion techniques. The radionuclide of choice should be organ specific, such that after complete biodistribution it accumulates mainly in the targeted organ. Decaying photons leaving the patient which originate from the targeted organ are then detected by the gamma camera mounted above the patient.20,21
The photons absorbed by the gamma camera crystal are converted into electrical signals by the electronic system before they are sent to the computer which comes interfaced to the gamma camera. These electrical signals are then converted into different intensities of varying radioactivity from varying colours and shades of grey to build images.
Quantification of these images give numerical values from which the patient diagnosis is completed.
A gamma camera can be used to acquire either planar or SPECT images depending on the imaging protocol used. During planar imaging, the gamma camera head is held in a fixed position above the patient.24 In this position, images in 2 D format are acquired. A single or dual head gamma camera may be used to acquire a static image. However, dynamic images may also be acquired. In this case, the gamma camera acquires a series of planar images showing the motion of the tracer over a short interval of time usually 1 to 10 s per frame. Acquisition of many projections makes it possible to observe animation of the tracer movement.20,21,22
During SPECT imaging, the gamma camera is rotated
2.1 Materials and Methods
Three hollow spheres A, B and C of diameters 26 mm; 20 mm, 16 mm were filled with technetium-99m (99mTc) activity of
concentration 74 kBq/ml. 99mTc was selected because this
study served as a validation for a study in which SPECT images with PVEs quantification were used to evaluate the function of salivary glands (imitated using spheres) post radiation therapy of head and neck tumours.24 99mTc accumulates in the salivary glands soon after intravenous administration thus facilitating imaging of the major pairs of glands. The spheres were mounted inside Jaszczak phantom adjacent to the walls forming a V-shape (figure 3 shows top
view of the Jaszczak phantom showing positioning of spheres
A, B and C). The spheres were mounted adjacent to the walls further away from the centre of rotation because spatial resolution is better on the edges of the phantom. Three measurements were conducted, first with the phantom filled with activity free water, secondly with the phantom filled with a solution of water and 0.5% activity of the 99mTc solution
filled inside the spheres. Lastly the phantom was filled with a solution of water and 1% activity of the 99mTc solution filled
into the spheres. New activity concentration was prepared for each experiment.
Fig. 3. Top view of Jaszczak phantom show spheres A, B and C mounted adjacent to the phantom walls forming a V-shape
During each of the three experiments, the phantom was imaged whilst laid on supine position using Siemens E-Cam dual head gamma camera as shown in figure 4. The Siemens E-Cam dual head gamma camera was fitted with low energy high resolution collimators. A Saturn nuclear medicine computer linked to the Siemens E-Cam dual head gamma camera collected the data.
Fig. 4. Jaszczak phantom placed on supine position on the gantry of a Siemens E-Cam dual head gamma camera.
2.2 Image quantification
The images were reconstructed using FBP reconstruction technique. A Butterworth filter, cut-off frequency 0.9 and order of 9 was used.17 These parameters were deduced in an earlier study in which all default filters supplied with the Siemens E-Cam dual head camera were applied on the images of the three spheres leading to selection of the filtering parameters that gave the best FHWM for the central transaxial image slice.
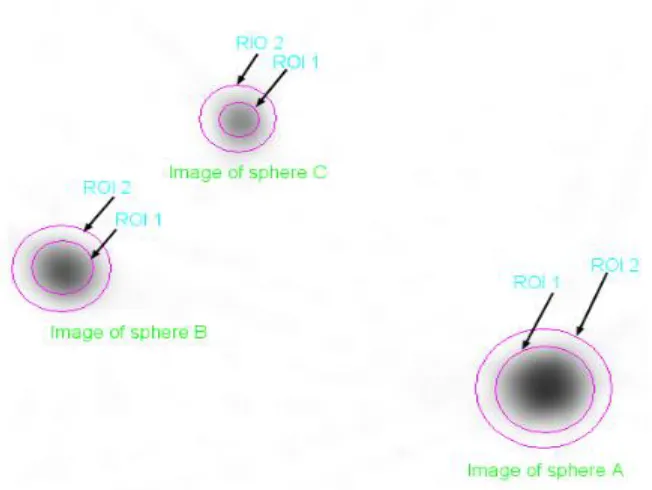
Two regions of interests (ROI 1 and ROI 2) were drawn on each 2D transaxial SPECT image slice of each of the three spheres. ROI 1 was drawn tightly on the boundary of the image slice whilst ROI 2 was added such that it extended from the boundary of ROI 1 by the FWHM of the Siemens E-Cam dual head gamma camera. The FWHM was measured and found to be 4.2 pixels.
Fig. 5. ROI 1 and ROI 2 drawn on the 2D transaxial SPECT image slice reconstructed using FBP techniques.
2D transaxial SPECT images of the sphere acquired when the background activity in the Jaszczak phantom was 0.5% and 1% of the activity concentration added into the spheres.
3. RESULTS
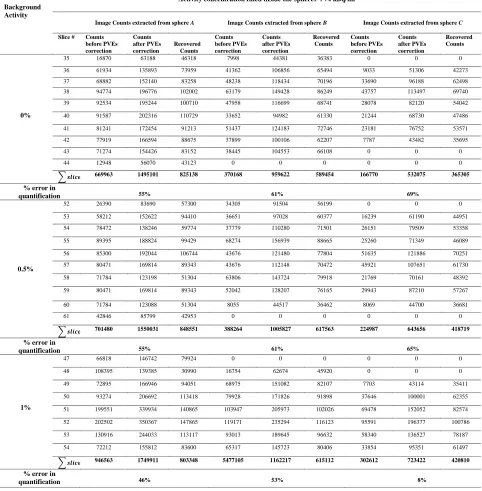
Table 1 Image counts extracted pre and post PVEs
quantification of 2D transaxial slices of spheres A, B and C
acquired when filled with 99mTc solution of activity concentration 74 kBq/ml.
4. DISCUSSION
We have presented an economic method for PVEs quantification that uses ImageJ, a licence free software. The method is applicable to SPECT transaxial images reconstructed using FBP technique. The method relies on the knowledge of the spatial resolution of the imaging system which was measured and found to be 4.2 pixels. This method is based on the assumption that the activity is uniformly distributed within the sphere, a scenario which may not be highly likely within tissues during clinical imaging. However, the procedure would still give good estimate values.
During quantification of image counts, ROI 2 was found to recover image counts that were spread outside the pixels of the image. In the absence of a radioactive background it was found that spill-out effects were responsible for underestimation of image counts (Table 1). Spill-out resulted in the spread of image counts outside the image pixels of spheres A, B and C. The column denoted recovered counts gives the image counts that were spread outside image pixels. These counts were responsible for the underestimation of the regional distribution of the activity in three spheres. The recovered image counts are obtained by subtracting ROI 1 image counts from ROI 2 image counts.
The study showed that the underestimation of the image counts increased with decrease of sphere size. The following quantification errors were found 55%; 61%and 69% in the order of decreasing sphere size for 0% background activity. For background activities 0.5% and 1% an overestimation of image counts was registered. This was attributed to the movement of background image counts into the peripheral boundaries of the sphere images. ROI 2 thus encompassed image counts and background activity counts thus resulting in overestimation quantification errors of 55%; 61% and 65% and also 46%; 53% and 58% respectively for background activities 0.5% and 1% respectively in the order of decreasing sphere size. From these results it became obvious that spill-out and spill-in effects cancelled as background activity increased. This is observed as the background was increased from 0.5% through to 1%. From the results of this study, it was also observed that as the background activity increased from 0.5% to 1%, the quantification errors attributed to overestimation decreased. This can be explained by the fact that more activity counts from the background (due to spill-in effects) cancelled with the activity counts from the spheres that spread to the outside the boundary of the sphere due to spill-out effect.
4.1 Comparison of ImageJ with other PVEs correction
techniques
ImageJ software is specifically designed to quantify PVEs in nuclear images reconstructed using FBP technique. The software is licence free, can be installed on a personal laptop thus making it accessible to a large community of clinicians. Extra information required is only the spatial resolution of the imaging system which can be easily determined. This technique is also applicable to planar images. To our best knowledge this is the only economical quantification procedure specifically designed for quantification of PVEs in SPECT imaging.
Elanderson and Hutton, also came up with a partial volume correction technique designed for SPECT called p-PVC which also took into account the distance blurring associated with SPECT. The p-PVC method is however dependent on anatomical acquired using computed tomography (CT) and magnetic resonance imaging (MRI). This makes the procedure inaccessible to the large community owing to the cost of the registered systems that would give a structural image co-registered with the SPECT data.. Furthermore the p-PVC technique is prone to mistakes arising from a series of data processing steps such as realignment of the image, parcelation and segmentation.10 This leaves PVEs quantification with ImageJ software as the only economically viable technique.
Quantification of PVEs using ImageJ remains favorable to
previous partial volume correction (PVC)
techniques.9,10,11,13,25,26,27 Some of the PVC techniques use anatomical information and they have been categorized as volume-of-interest, 13,25 and voxel-based methods.26,27 One of the strengths of PVEs quantification using ImageJ is that it is specifically designed for SPECT images whilst previous PVC techniques were designed for PET. 9,10,11,13,25,26,27 These methods have been applied to SPECT. However, they cannot give good approximate values of PVEs since in SPECT spatial resolution varies as you move away from the collimator yet it is well known that in PET spatial resolution is considered as invariant.21 This leaves our method as the most suitable since it takes into account the distant dependent blurring effect in SPECT.
5 CONCLUSION
ImageJ software provides the most economic means of quantifying PVEs in SPECT imaging. It is suitable for SPECT images reconstructed with FBP technique. However, presence of a radioactive background results in overestimation of quantitative values in an ideal clinical imaging scenario. This can be overcome by timing imaging such that it is performed when the radiopharmaceutical has reached its final biodistribution, this will guarantee minimum background activity (blood pool activity) and minimal errors due to overestimation.
REFERENCES
[1] Buvat I. Quantification in emission tomography: challenges, solution, and performance. Nuclear Instruments and Methods in Physics Research A 571 (2007)10-13.
[3] Minarik D. Applications of quantitative nuclear medicine image. MSc thesis. Lund University 2010.
[4] Nyathi M. Assessment of salivary gland function pre and post radiation therapy. MSc thesis. University of Surrey.UK. 2008. [5] Frey EC, Humm JL, Ljungberg M. Accuracy and Precision of
Radioactivity Quantification in Nuclear Medicine Images. Seminars in Nuclear Medicine volume 42,Issue 3 ,May 2012 :208-218.
[6] Kam BLR, Teunissen JJM, Krenning EP. Lutetium-labelled peptides for therapy of neuroendocrine tumours. European Journal of Nuclear Medicine and Molecular Imaging (2012) 39 (Supplementary 1): S103 – S112.
[7] Bardies M,Buvat I,Dosimetry in nuclear medicine therapy:What are the specifics in image quantification in dosimetry? J Nucl Med Mol Imaging 2011;55:5-20.
[8] Brian F Hutton, Buvat I .Beekman FJ. Review and current status of SPECT scatter correction.Phys. Med. Biol. 56(2011) R85–R112. [9] Erlandsson K, Thomas B,Dickson Hutton BF.Partial Volume
correction in SPECT reconstruction with OSEM. Nuclear Instruments and Methods in Physics Research A . 2011; 646:S85-S88.
[10] Erlandsson K, Hutton BF. Partial Volume Correction in SPECT Using Anatomical Information and Iterative FBP. Tsinghua Sci Technol. 2010; 15:50-55.
[11] Buvat I.Partial volume effect issue: Instrumental and biological components. Taormina workshop. August 31, 2012.
[12] Hoettjes NJ, van Velden FHP, Hoekstra OS, Krak NC, Lammersta AA, Boellaard R. Partial volume correction strategies for quantitative FDG in oncology. Eur J Nucl Med Mol Imaging. 2010 Aug; 37(9):1679-1687.
[13] Rousset OG., Ma Y, Evans AC. Correction for partial volume effects in PET: principle and validation. J Nucl Med. 1998; 39:904–911.
[14] Erlandsson K, Buvat I, Hendrik Pretorius PH, Benjamin A, Thomas BA, Hutton BF. A review of partial volume correction techniques for emission tomography and their applications in neurology, cardiology and oncology. Phys Med Biol.2012; 57:R119–R159.
[15] Lehnert W, Gregoire MC, Reilhac A, Meikle SR. Characterisation of partial volume effect and region-based correction in small
animal positron emission tomography (PET) of the rat brain. Neuroimage.2012; 61:2144-2157.
[16] Hoettjes NJ, van Velden FHP, Hoekstra OS, Krak NC, Lammersta AA, Boellaard R. Partial volume correction strategies for quantitative FDG in oncology. Eur J Nucl Med Mol Imaging. 2010 Aug; 37(9):1679-1687.
[17] Appreciation. Nuclear Medicine Pioneer, Hal O. Anger 1920-2005. J Nucl Med Technol. 2005; 33:250-253.
[18] Zaidi H, Hasegawan BH. Quantitative Analysis in Nuclear Medicine Imaging. New York: Springer Science + Business Media; 2006.
[19] Pani R, Cinti MN, Pellegrini R, Bennati P, Beti M, Victorini F, Mattioli M, Trota G, Orsolini C, Scafe R, Navarria F, Bollini D, Moschini G, Notaristefani F. LaBr3 : Ce scintillation gamma camera protype for X and gamma ray imaging. Nucl Instrum Methods. 2007; A576:15-18.
[20] Singha M, Waluchb V. Physics and instrumentation for imaging in-vivo drug distribution. Advanced Drug Delivery Reviews. 2000; 41:7-20.
[21] Cherry SR, Sorenson JA, Phelps ME. Physics in Nuclear Medicine. 3rd ed. Philadelphia: Elsevier Science; 2003.
[22] Singh M, Waluch V, Physics and instrumentation for imaging in-vivo drug distribution. Adv Drug Deliv Rev. 2000; 41:7-20. [23] Deconick F. Nuclear Imaging in the realm of medical imaging.
Nucl Instrum Meth Phys Res. 2003; A509:213-228.
[24] Nyathi M. Quantitative evaluation of the parotid and submandibular salivary glands function post radiation therapy of head and neck tumours. PhD thesis. 2015. Ga-Rankuwa. South Africa.
[25] Tohka J, Reilhac A. Deconvolution-based partial volume effects in PET: Principle and Validation. J Nucl Med. 1998; 39:904-911. [26] Yang J, Haung SC, Mega M, et al. Investigation of partial volume
correction methods for brain FDG PET studies. IEEE Trans. Nucl Sci. 1996;43:3322-3327.
[27] Mlttzer CC, Leal JP, Mayberg HS, et al. Correction of PET data for partial volume effectsin human cerebral contex by MR imaging. J Comput Assist Tomogr. 1990; 14:561-570.
[28] Bushberg JT, Seirbert JA, Leidholdt EM, Boone JM. The Essential Physics of Medical Imaging. Baltimore, Maryland:
Table 1
Image counts extracted pre and post PVEs quantification of 2D transaxial slices of
spheres A, B and C acquired when filled with
99mTc solution of activity concentration 74
kBq/ml.
Table 1 shows image counts extracted from 2D transaxial SPECT images of the spheres A, B
and
C acquired whilst mounted inside the Jaszczak phantom. Sphere images were acquired
under three different background activities (0%; 0.5% and 1%) compared to the activity
concentration of 74 kBq/ml filled into the spheres. The total image counts for each sphere
was given by the sum of counts extracted from 2D transaxial slices that make up the sphere.
Slices with negligible image counts were ignored.
Background Activity
Activity concentration filled inside the spheres : 74 kBq/ml
Image Counts extracted from sphere A Image Counts extracted from sphere B
Image Counts extracted from sphere C
Slice # Counts before PVEs correction
Counts after PVEs correction
Recovered Counts
Counts before PVEs correction
Counts after PVEs correction
Recovered Counts
Counts before PVEs correction
Counts after PVEs correction
Recovered Counts
0%
35 16870 63188 46318 7998 44381 36383 0 0 0
36 61934 135893 73959 41362 106856 65494 9033 51306 42273
37 68882 152140 83258 48238 118434 70196 33690 96188 62498
38 94774 196776 102002 63179 149428 86249 43757 113497 69740
39 92534 195244 100710 47958 116699 68741 28078 82120 54042
40 91587 202316 110729 33652 94982 61330 21244 68730 47486
41 81241 172454 91213 51437 124183 72746 23181 76752 53571
42 77919 166594 88675 37899 100106 62207 7787 43482 35695
43 71274 154426 83152 38445 104553 66108 0 0 0
44 12948 56070 43123 0 0 0 0 0 0
𝒔𝒍𝒊𝒄𝒆𝒔 669963 1495101 825138 370168 959622 589454 166770 532075 365305 % error in
quantification 55% 61% 69%
0.5%
52 26390 83690 57300 34305 91504 56199 0 0 0
53 58212 152622 94410 36651 97028 60377 16239 61190 44951
54 78472 138246 59774 37779 110280 71501 26151 79509 53358
55 89395 188824 99429 68274 156939 88665 25260 71349 46089
56 85300 192044 106744 43676 121480 77804 51635 121886 70251
57 80471 169814 89343 43676 112148 70472 45921 107651 61730
58 71784 123198 51304 63806 143724 79918 21769 70161 48392
59 80471 169814 89343 52042 128207 76165 29943 87210 57267
60 71784 123088 51304 8055 44517 36462 8069 44700 36681
61 42846 85799 42953 0 0 0 0 0 0
𝒔𝒍𝒊𝒄𝒆𝒔 701480 1550031 848551 388264 1005827 617563 224987 643656 418719 % error in
quantification 55% 61% 65%
1%
47 66818 146742 79924 0 0 0 0 0 0
48 108395 139385 30990 16754 62674 45920 0 0 0
49 72895 166946 94051 68975 151082 82107 7703 43114 35411
50 93274 206692 113418 79928 171826 91898 37646 100001 62355
51 199551 339934 140865 103947 205973 102026 69478 152052 82574
52 202502 350367 147865 119171 235294 116123 95591 196377 100786
53 130916 244033 113117 93013 189645 96632 58340 136527 78187
54 72212 155812 83600 65317 145723 80406 33854 95351 61497
𝒔𝒍𝒊𝒄𝒆𝒔 946563 1749911 803348 5477105 1162217 615112 302612 723422 420810 % error in
quantification