Application of 3D Laser Scanning Measurement
on CMMs of Highly Precision Progressive Die
Process Part
Sanya Kumjing
Abstract– The goal of this research is the application of the process of laser inspection to three-dimensional parts by coordinating the measurements of a laser probe to produce quality specimens. The complex progressive die was precision manufactured from cold-rolled steel sheet material grade JIS 270-35 with a thickness of 1.8 mm. The results indicated that the specimens produced were similar to the original prototype, as the check points matched accurately. The thickness dimensions were acceptable, with P-values greater than the significance levels of 0.05 (P-Value>α). Advanced CMM-laser measurements resulted in a decrease in the percentage error of the size and thickness by 60.59% and 38.36% compared to conventional measurements, respectively. Moreover, the data are reliable, with a statistical confidence level of 95%; as a result, manufacturers can save time, reduce costs and minimise the risk of errors in the inspection of finished parts using the proposed approach, thereby directly providing quality for the customers.
Index Term
–
Laser scanner, auto part, progressive, 3D, measurement, CMMI. INTRODUCTION
Each piece of a three-dimensional product is important. Moreover, the tolerance of each dimension is a key factor in the process of quality control of a workpiece to meet the specification. The production of auto parts via a progressive die for the automotive industry requires a series of continuous, sophisticated and highly accurate processes. It is essential that the parts be designed and manufactured to a high standard to meet the requirements of the customers. However, workpieces of complex sizes, shapes and surfaces often cause the most problems in measuring quality check pieces, as errors or instability always occur after forming each piece. To achieve satisfactory results, one must start with minimal errors. In general, the errors primarily involve personal error, systematic errors and statistical errors. However, the statistical errors are random errors, i.e., the number of measured data or different distributions from a number of possible maximum values. The author obtained inspection results using statistical analysis.
Moreover, to determine the actual values, measurements must be performed several times to obtain an average or to apply statistical analysis. Thus, to make the results as accurate as possible, we should improve our measurement skills. Learning to perform data recording and learning the proper use
Department of Industrial Engineering, Faculty of Engineering and Architecture, Rajamangala University of Technology Suvarnapbumi,
Nonthaburi 11000, Thailand. (e-mail: [email protected])
of measuring tools will reduce the amount of personal errors to a minimum.
However, the process requires a lot of time, as the action must be repeated several times in a measurement, and has a high cost.
From the relevant literature, it is revealed that works regarding laser scanning using a coordinate measuring machine mainly concentrated on result inspection, dimension measurement, thickness measurement and geometrical measurement.
Hemant Ramaswami et al. [1] designed an advisor for the optimal inspection of circularity tolerance by adopting a method of selecting an optimum inspection strategy for a coordinate measuring machine (CMM)-based inspection; this approach has become very important. The inspection error resulting from CMM inspection is greatly affected by the profile irregularities and the sampling strategy, which includes the sample size, sampling methods, and algorithms used for the evaluation.
Tae Jo Ko et al. [2] studied on-machine measurement (OMM) using a noncontact sensor based on a computer-aided design (CAD) model. An inspection process was performed to check whether the part was within dimensional tolerances. A coordinate measuring machine (CMM) is a general metrological device for assessment of dimensions on the shop floor. However, CMM measurements require significant resources in terms of operating time and cost. This requirement has led to many studies of OMM systems.
C.-Y. Hwang et al. [3] studied the efficiency of CMM inspection planning to minimize the number of part setups, probe orientations and inspection feature sequences. Their proposed method was successfully implemented and tested using a machine spindle cover part.
Hemant Ramaswami et al. [4] studied inspection advisors to determine the form error in cylindrical features. In addition to the hardware capabilities, some of the critical factors that affected the accuracy and inspection precision using CMMs included the sample size, the sampling technique and the form evaluation methods. Selecting an optimal inspection plan for CMM is vital to improve the quality of measurements while simultaneously minimizing inspection costs and time.
Susana Martinez et al. [6] analysed laser scanning and strategies for dimensional and geometrical control. They analysed the applicability of scanning systems to measure and control tolerances. Two different scanning systems were analysed: a laser triangulation sensor and a touch trigger probe. Both systems were mounted on a coordinate measuring machine. Several test parts were designed; these included different canonical features of planes, spheres, cylinders, holes (outer and inner) and conical surfaces. A common alignment method was defined to compare the geometry generated for both scanning systems.
Nick Van Gestel et al. [7] studied the effects of a performance evaluation test for laser line scanners on 3D CMMs. Laser line scanners have become popular recently, mainly for free-form inspection tasks and reverse engineering.
The application of an advanced tooling method with high
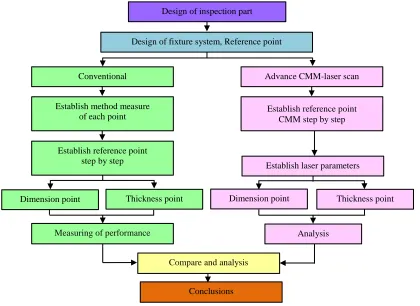
standards is required to measure and adjust systems to standards with reliable minimum error. The inspection process of the parts can also be performed to recognize the standards in all three dimensions simultaneously. Such an advanced tooling method enables easy control of the process, including the design and manufacture of a progressive die with precision, and is the most practical method. This method can be used to produce high-quality parts, thereby adding value to market quickly and enabling on-time delivery in addition to reducing the cost of production to a satisfactory level. Therefore, this paper demonstrates a methodology to select an optimal inspection approach that meets the needs of the user. The application process inspection parts (three-dimensional) using a coordinate measuring machine (CMM) with the probe laser to produce a real quality delivery to customers is shown in Fig. 1.
Fig. 1. Experiment of methodology flow chart
II. EXPERIMENTAL PROCEDURE
A. Material and equipment
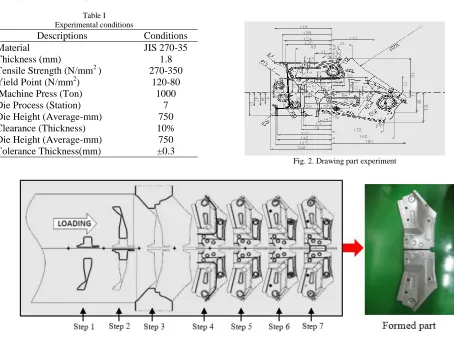
The workpiece material is a JIS 270-35 cold-rolled steel sheet; such sheets are involved in many popular applications in the automotive industry. The measurement conditions are described in Table 1. The characteristic feature is the complexity of the workpiece level. Quality parts have tolerances at a sophisticated level because there are three work stations for producing the complex parts. As the specimen size is large, the station die formation process requires more than
three steps. Therefore, we applied our system to produce a metal transfer die; there must be an element of the machine and tools in production that is completely automated for the system to work effectively. The die was generated by the system, and the working principle of the system progressive die was performed to the standards of our customers. The precision inspection of the experiment for each specimen involves using measuring instruments, such as a CMM-laser scanner, micrometer, dial gauge and Vernier calliper, and to record the details of the investigation according to a check sheet. Random sampling of the specimens is performed at 15
Design of inspection part
Design of fixture system, Reference point
Conventional
Establish method measure of each point
Establish reference point step by step
Dimension point Thickness point
Measuring of performance
Compare and analysis
Conclusions
Advance CMM-laser scan
Establish laser parameters
Dimension point Thickness point
Analysis Establish reference point
min/h. Functional tests of the workpiece were performed on 350 pieces/lot, and the random number of pieces available was 25 pieces/lot. Moreover, the size of the specimen was checked in various positions. The details of the check sheet describe how to meet the standards and customer requirements. A workpiece (drawing part) is shown in Fig. 2. In the experiments, to evaluate a part in terms of dimension and thickness, the measurement system analyses the manual measurement compared with the laser scanner results.
For contact digitizing, a reference point of the part system was considered. However, in the process of laser scanning digitizing, the 3D coordinates of the captured points are related to the machine reference system. To compare the accuracy of the laser method with that of the conventional method, both point clouds must be referred to the same reference system with the minimum possible error (point clouds alignment matching) [6–8]. There are several methods
to perform these alignments [8, 9]. One of the most common and simple methods consists of placing three reference spheres that are digitized at the same time as the artefact surfaces. The surfaces of the spheres are then reconstructed, and their centres are used to establish a unique reference system.
The results showed that all of the test surfaces (laser) had negative Z coordinates with regard to the corresponding reference surfaces. In addition, the test spheres had larger diameters than those in the reference spheres. Analysis of the deviation between the test surfaces and the reference surfaces led to the conclusion that a unique value could not be established for all of the surfaces of the artefact. Therefore, the accuracy of matching the contact by laser might be incorrect, as the laser system suggested different coordinates (usually on the Z axis) compared to those obtained from the contact probe. This effect was analysed previously [2, 10].
Table I Experimental conditions
Descriptions Conditions
Material JIS 270-35
Thickness (mm) 1.8
Tensile Strength (N/mm2 ) 270-350
Yield Point (N/mm2) 120-80
Machine Press (Ton) 1000
Die Process (Station) 7
Die Height (Average-mm) 750
Clearance (Thickness) 10%
Die Height (Average-mm) 750
Tolerance Thickness(mm) ±0.3
Fig. 2. Drawing part experiment
Fig. 3. Die process station design
B. Experimental procedure
1) The system diagrams, high-precision progressive die, and design diagrams are determined from the motion system sheet feeder forming the workpiece. The main consideration is the relationship between stroke and the die height and stroke to stop.
2) Determining the workstations process involves seven die process stations based on each work station, including the following production process (Fig. 3): 1 Piercing
production steps, 2 Piercing production steps, 3 Trimming production steps, 4 Shallow drawing production steps, 5 Forming production steps, 6 Piercing and Trimming production steps, and 7 Cutting-off production steps.
to enhance the performance of the system.
4) Finite element forming analysis to study specimens involved die process design and analysis. To study the specimen under tension, this procedure is designed to stamp up the feed stations in seven steps. The settings in the workflow from creation to step mesh blank stamp cutting edges are required to analyse the mechanical properties of the material before die building and testing are applied in practice.
5) Dies are designed and created according to the terms and conditions for operation of the machine press steel sheet feeding system. The workpiece by feeder in relation to each work station of the die process is shown in Fig. 3.
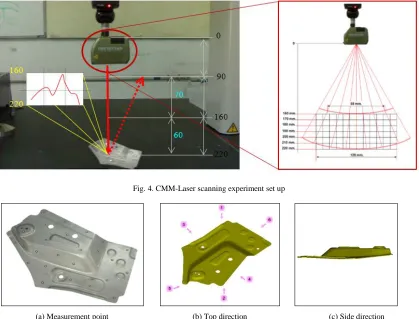
6) A quality check of the specimen from the forming process of a progressive die involves measuring the dimensions on each workpiece side, including dimension, geometry and thickness. In the inspection process, the accuracy of measurements obtained using a laser scanner compared with those obtained via conventional instruments by a worker are shown in Fig. 4.
7) For the methodology of the measurement for laser scanning using a PULSTEC system, model TDS-1622 ph, both systems were mounted on the same CMM, a Mitutoyo Beyond Crysta-C model. The CMM provides three controlled displacements along its axes (X,Y,Z) and is equipped with a motorized head (Renishaw PH10MQ), which rotates around two axes, A (horizontal axis) and B (vertical Axis), to adopt
the appropriate orientation. The uncertainty of the CMM in contact digitizing is given by the following expression, which is included in the ISO 10360-2 standard: MPEE (μm) =2.2 + 3 • L/1, 000, where L (mm) is the magnitude to be measured for noncontact tests and the software was PULSTEC SCANNER according to the maker recommendation. Commercial applications were used for reconstruction of surfaces, particular UG NX 5 and Geomagic V9 (Studio and Qualify). As is known, UG NX is one of the most common and powerful computer-aided design (CAD)/computer-aided manufacturing applications. Geomagic Studio is an application used in reverse engineering for surface reconstruction, and Geomagic Qualify is used for inspection and quality control.
The outline of the method is shown in Fig. 4. The procedure consists of the following steps:
1. Experiment set up by design of the auto parts test 2. Experiment set up by design of a fixture and a reference point on the workpiece system
3. Experiment set up of the contact scanning strategy 4. Experiment set up of the noncontact scanning strategy
5. Reconstruction of the canonical surfaces in CAD data
6. Data comparison of the reconstructed surfaces of the workpiece
7. Results analysis and conclusion
Fig. 4. CMM-Laser scanning experiment set up
(a) Measurement point (b) Top direction (c) Side direction
Fig.6. A normal distribution error of the manual measurement
III. RESULTS AND DISCUSSION A. Inspection workpiece results
From inspection of the specimens after the test of formation of a progressive die in terms of size according to the standards set in a position by a check sheet, we found that there are some minor problems, such that the specimen is not in accordance with the defined dimensions.
This can be a problem of specific points and timely production. The test piece stamping at each step is characterized, as shown in Fig. 5 (a), and the measuring point, top direction and side direction are sampled, as shown in Fig. 5 (b) and Fig. 5 (c), respectively. Next, inspections are performed using a Vernier calliper at each position, the thickness of the parts is determined, and then it is determined whether the tolerance control is < 0.3 mm, as shown in Fig. 6. Moreover, it is found that the error of the measurement is not within the control tolerance and the coordinates on the bottom. Therefore, a comparison of the measurements less than the standard size is not acceptable.
B. CMM-Laser scanning analysis
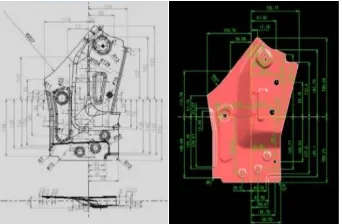
Next, the size of the specimen is determined via CMM-laser scanning. This method is checked with the size of the specimen determined after repeated measurements with a Vernier calliper. To confirm a piece with advanced tracking, comparison with the traditional order master drawing revealed the values obtained by measuring the size and thickness, as shown in Fig.7.
Specimens were characterized by checking the size dimensions of the workpiece on both sides using advanced CMM-laser scanning; the overall size was close to the size of the master drawing, as shown in Figs. 7 (a) and (b). In addition, the overall thicknesses of the specimen, both front and back, are similar in size to the size of Position the inspection with laser scanner in Figs. 8 (a) and (b). As observed by the colour, the specimen was analysed and compared with the colour scheme with a colour tone that is within the acceptable range. This result shows that checking the size of the specimen with advanced CMM-laser scanning can precisely determine the size and thickness of the workpiece progressive die forming process. Thus, the advanced measurement process is suitable for production of highly complex parts that are difficult to measure by conventional processes.
Inspection with advanced measuring instruments such as CMM-laser scanning is a method to confirm the results of statistical values. We found that the thickness of the specimen can be used to determine the position of the front and back of the piece. The sizes are based on a defined scope. The results show that application of the simulation technology has the ability to produce drawing and die designs of progressive die technology with high accuracy. The precision of the measuring instrument is determined by the smallest unit to which it can measure. The precision is said to be the same as the smallest fractional or decimal division on the scale of the measuring instrument. The tolerance is the greatest range of variation that is allowed [11-12].
(a) Master drawing, dimensions left side (b) Master drawing, dimensions right side
Fig. 7.Master drawing
-0.25 -0.15 -0.05 0.05 0.15 0.25
1 2 3 4 5 6 7 8 9 10 11 12 13 14 Sample Measure Mean (CL) UCL LCL
LCL UCL
T
o
le
ra
n
ce
Er
ro
r
(a) Dimension
-0.25 -0.15 -0.05 0.05 0.15 0.25
1 2 3 4 5 6 7 8 9 10 11 12 13 14 Sample Measure Mean (CL) UCL LCL
LCL UCL
T
o
le
ra
n
ce
Er
ro
r
(a) Thickness of top side (b) Thickness of bottom side
Fig. 8.Position the inspection with laser scanner
(a) Top side (b) Bottom side
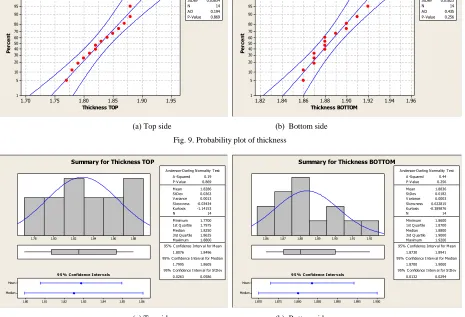
Fig. 9.Probability plot of thickness
(a) Top side (b) Bottom side
Fig. 10.Summary for thickness
The accuracy of the data obtained from the measurements of the thickness of the specimen at the top and bottom was checked via advanced CMM-laser scanning. The experiment found that for each measurement, the value is in the range of acceptable values, as shown in Fig. 9. When tested by statistical analysis based on the residual probability plot of thickness, the data of the residual follow the straight-line graph, showing the characteristics of a normal distribution of thickness on the top and bottom. In Figs. 9 (a) and (b), the
P-values are 0.869 and 0.256, respectively, which are greater than the significance level of 0.05 (P-Value> α or 0.869 > 0.05 and 0.256 > 0.05), indicating that the data from the experiment have a normal distribution and the data are reliable at a confidence level of 95%, thus validating the overall conclusion of the values obtained from measurements using CMM-laser scanning. Fig. 10 shows that the results of the measurement are quite accurate compared to a real piece of work after the test. This can be viewed as a process forming a highly precise 1.95 1.90 1.85 1.80 1.75 1.70 99 95 90 80 70 60 50 40 30 20 10 5 1 Thickness TOP P e rc e n t Mean 1.829 StDev 0.03634 N 14 AD 0.194 P-Value 0.869
Probability Plot of Thickness TOP
Normal - 95% CI
1.96 1.94 1.92 1.90 1.88 1.86 1.84 1.82 99 95 90 80 70 60 50 40 30 20 10 5 1 Thickness BOTTOM P e rc e n t Mean 1.884 StDev 0.01823 N 14 AD 0.435 P-Value 0.256
Probability Plot of Thickness BOTTOM
Normal - 95% CI
1.88 1.86 1.84 1.82 1.80 1.78 Median Mean 1.86 1.85 1.84 1.83 1.82 1.81 1.80
1st Q uartile 1.7975
Median 1.8250
3rd Q uartile 1.8625
Maximum 1.8800
1.8076 1.8496
1.7995 1.8605
0.0263 0.0586
A -Squared 0.19
P-V alue 0.869
Mean 1.8286
StDev 0.0363
V ariance 0.0013
Skew ness -0.03434
Kurtosis -1.14153
N 14
Minimum 1.7700
A nderson-Darling Normality Test
95% C onfidence Interv al for Mean
95% C onfidence Interv al for Median
95% C onfidence Interv al for StDev
9 5 % Confidence Intervals
Summary for Thickness TOP
1.92 1.91 1.90 1.89 1.88 1.87 1.86 Median Mean 1.900 1.895 1.890 1.885 1.880 1.875 1.870
1st Q uartile 1.8700
Median 1.8800
3rd Q uartile 1.9000
Maximum 1.9200
1.8730 1.8941
1.8700 1.9000
0.0132 0.0294
A -Squared 0.44
P-V alue 0.256
Mean 1.8836
StDev 0.0182
V ariance 0.0003
Skew ness 0.622815
Kurtosis -0.389876
N 14
Minimum 1.8600
A nderson-Darling Normality Test
95% C onfidence Interv al for Mean
95% C onfidence Interv al for Median
95% C onfidence Interv al for StDev
9 5 % Confidence Intervals
progressive die, with high precision at each step and in terms of the size of the test specimen.
C. Comparison of the percent error
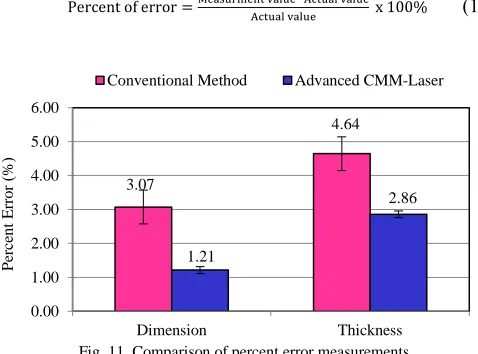
Meanwhile, accuracy is a measure of how close the result of the measurement comes to the "true", "actual", or "accepted" value. Moreover, tolerance is the greatest range of variation that is allowed, and tolerance errors in measurements may be represented by a tolerance interval (margin of error). Machines used in manufacturing often set tolerance intervals or ranges in which product measurements will be tolerated or accepted before they are considered flawed [11]. To determine the tolerance interval in a measurement, add and subtract one-half of the precision of the measuring instrument to the measurement. In an experiment, if a measurement is made with a metric unit is 1.86 mm and the tolerance has a precision of 0.3 mm, then the tolerance interval in this measurement thickness is 1.80? 0.3 mm, or from 1.65 mm to 1.95 mm. Any measurements within this range are "tolerated" or perceived as correct. Moreover, an error in measurement may also be expressed as a percent of error. The percent of error is found by multiplying the relative error by 100 %, as shown in Equation 1.
(1)
Fig. 11. Comparison of percent error measurements
Measurements obtained using the conventional method result in errors of measurement higher than the errors associated with measurements obtained using advanced laser scanning, which also results in the need to take time to check the specimen to perform repeated measurements in the case of parts with high precision. The result of the analysis is that there is a difference, as shown in Fig. 11, found in the relative error of the measurement, i.e., the percent error rates measured by the laser scanner system differ from that of the conventional measurement [13,14].
Fig. 11 illustrates that the conventional method of measuring the size and thickness results in a percentage of error of 3.07 and 4.64%, respectively, and after having been checked repeatedly by the Advanced CMM-Laser, the percentage errors of the size and thickness measurements are 1.21 and 2.86%, respectively. In addition, the percentage error
of the measurements of the size and thickness overall of the advanced CMM-Laser were found to have decreased by 60.59% and 38.36%, respectively, compared to the conventional method. The advanced CMM-Laser measurement can be complicated and difficult to measure with efficiency and high accuracy. It has a value close to that of a master drawing, or a real piece of work, and the standard error of the measurement process is minimal [15,16].
IV. Conclusion
1. A system performing repeated measurements several times can achieve a good average value. However, the effect of time and cost are high in the validation process.
2. An application of simulation technology for the forming process, using finite element analysis and design, is beneficial for progressive die technology. This technology can enable a precision metal stamping process and achieve a job that meets the required standards.
3. Application of a laser scanner to perform combined coordinate measuring machine measurements under controlled conditions. If the workpieces being measured can change size depending upon climatic conditions, make sure to measure the workpiece under the same conditions each time. This process may apply to your measuring instruments as well. Moreover, perform the measurement with an instrument that has the highest level of precision. The smaller the unit, or fraction of a unit, on the measuring device is, the more precisely the device can measure. The precision of a measuring instrument is determined by the smallest unit to which it can measure.
4. The accuracy of the data is determined by monitoring the quality of the test specimen with the P-Value in each position being checked. Determine if the P-value is greater than the significance level of 0.05 (P-Value>α) and if the data are reliable statistical confidence level of 95%. Moreover, a subsequently restated highly precise progressive die can provide a summary of advanced CMM-Laser measurement with a percentage error of the size and thickness decreasing by 60.59% and 38.36%, respectively, compared to conventional means.
V.ACKNOWLEDGEMENTS
The authors thank the Thai-German Institute’s research funds and the Rajamangala University of Technology Suvarnapbumi for its kind support in supplying materials and equipment used in this research.
REFERENCES
[1] Marcello Colledani, Tullio Tolio, Anath Fischer, Benoit Iung,Gisela Lanza, Robert Schmitt and Jo´ zsef Va´ncza, 2014. “Design and management of manufacturing systems for production quality.” CIRP Annals - Manufacturing Technology 63, pp.773–796.
[2] Helen H. Lou and Yinlun L. Huang, 2003. “Hierarchical decision making for proactive quality control: system development for defect reduction in automotive coating operations.” Engineering Applications of Artificial Intelligence 16, pp.237–250.
[3] G. Michalos, S. Makris, N. Papakostas, D. Mourtzis and G. Chryssolouris, 2010. “Automotive assembly technologies review: challenges and outlook for a flexible and adaptive approach.” CIRP Journal of Manufacturing Science and Technology 2, pp.81–91. 0.00
1.00 2.00 3.00 4.00 5.00 6.00
Dimension Thickness
Conventional Method Advanced CMM-Laser
3.07
1.21
4.64
2.86
P
er
ce
n
t
Er
ro
r
(%
[4] Nagur Aziz Kamal Bashah, Norhamidi Muhamad, Baba Md Deros, Ahmad Zakaria, Shaharum Ashari, Achmed Mobin and Mohd Safuan Mohd Abdul Lazat, 2013. “Multi-regression modeling for springback effect on automotive body in white stamped parts.” Materials and Design 46, pp.175–190.
[5] Valtteri Tuominen, 2011. “Virtual clamping in automotive production line measurement.” Expert Systems with Applications 38, pp.15065– 15074.
[6] Igor Beˇsic´, NickVanGestel, Jean-PierreKruth, PhilipBleys and Janko Hodolicˇ, 2011. “Accuracy improvement of laser line scanning for feature measurements on CMM.” Optics and Lasers in Engineering 49, pp.1274–1280.
[7] Claus P. Keferstein, Michael Marxer, Reto Götti, Rudolf Thalmann, Thomas Jordi and Matthias Andräs, Jürgen Becker, 2012. “Universal high precision reference spheres for multisensor coordinate measuring machines.” CIRP Annals - Manufacturing Technology 61, pp.487–490. [8] J.O. Harris, A.D. Spence, 2004. “Geometric and quasi-static thermal error compensation for a laser digitizer equipped coordinate measuring machine.” International Journal of Machine Tools & Manufacture 44, pp. 65–77.
[9] Nagur Aziz Kamal Bashah, Norhamidi Muhamad, Baba Md Deros, Ahmad Zakaria, Shaharum Ashari, Achmed Mobin and Mohd Safuan Mohd Abdul Lazat, 2013. “Multi-regression modeling for springback effect on automotive body in white stamped parts.” Materials and Design 46, pp.175–190.
[10] Amit Jaisingh, K. Narasimhan, P.P. Date, S.K. Maiti and U.P. Singh, 2004. “Sensitivity analysis of a deep drawing process for miniaturized products.” Journal of Materials Processing Technology 147, pp.321– 327.
[11] Donald J. Wheeler and David S. Chambers, 2010. “Understanding Statistical Process Control.” SPC Press, Knoxville, Tennessee. [12] Recep Yenitepe, 2015. “Experimental investigation and optimization of
control factors for the formability of al 1050 sheet conducted by a prototype computer aided hydraulic press.” International Journal of Engineering Science and Technology (IJEST), Vol. 7 No.1 Jan 2015, pp. 21-31.
[13] Paweł J. Swornowski, 2014. “A new concept of continuous measurement and error correction in Coordinate Measuring Technique using a PC.” Measurement 50, pp.99–105.
[14] Rubayet Karim, 2013. “Impact of Changeover time on productivity: A case study.” International Journal of Engineering & Technology IJET-IJENS Vol:13 No:06, pp.42-48.
[15] Gaoyan Zhong, Chaoqun Wang, Shoufeng Yang, Enlai Zheng and Yanyan Ge, 2014. “Position geometric error modeling, identification and compensation for large 5-axis machining center prototype.” International Journal of Machine Tools and Manufacture, S0890-6955(14)40007-5.