FUZZY LOGIC BASED APPROACH FOR
SHORT TERM TRAFFIC FLOW PREDICTION
Minal Deshpande1 and Dr. Preeti Bajaj2
I.INTRODUCTION
As the traffic flow exhibits stochastic characteristics, it can be modeled and prediction can be done using stochastic predictors. Different approaches were employed for predicting traffic flow on short term basis which accounts for prediction in the time interval of 5 minutes to half an hour. The approaches are based on time series models[1,2] , non-parametric methods[3,4], Kalman filter theory[5], simulation models[6], spectral analysis[7], Bayesian networks[8], fuzzy-neural approach[9,10] and neural networks[11,12]. But the conclusion cannot be drawn like one technique clearly outperforms the other techniques. But short term traffic flow prediction is critical as accurate traffic flow information helps to optimize the signal timings and gives decision taking capability to the transport users regarding mode of travel, time of travel and to choose route of travel.
In reference [13] traffic flow forecasting is proposed based on type-2 fuzzy logic. Time period of 5 to 10 am and 2pm to 8 pm is considered for analysis. In the first case only historical information is used and in second case both historical and real time information is used for rule construction. Upper and lower membership function of interval type-2 fuzzy set can be used to generate a prediction interval. In reference [14] traffic flow prediction of single intersection is reported using fuzzy logic. Minimum and maximum number of vehicles within 5 minutes is defined to be equal to 60 and 200. In reference [15] traffic volume prediction model is presented based on fuzzy logic. Input variables considered are ‘day’ of a week and ‘time’ of a day for the fuzzy logic system. Fuzzy rules are defined using traffic volume data on hourly basis. Using extensive data sets if MAPE error is required to be minimized then future extension will be to use fuzzy neural network.
Traffic flow at any road segment or a location is dependent upon the traffic flow conditions at the same location in the past and present scenario. Hence in this work short term traffic flow prediction problem is proposed considering the effect of past samples in prediction of future traffic flow. Because traffic flow prediction is a function estimation or regression problem so it can be expressed as
1
Department of Electronics Engineering G. H. Raisoni College of Engineering, Nagpur, Maharashtra, India
2
Director G. H. Raisoni College of Engineering, Nagpur, Maharashtra, India
DOI: http://dx.doi.org/10.21172/1.82.033
e-ISSN:2278-621X
Abstract- Short term traffic flow prediction is one of the critical needs in the area of intelligent transportation system (ITS). It helps to reduce the congestion thereby resulting in avoidance of a longer travelling time, reduces fuel consumption and pollution and avoids economic losses. In addition to that, traffic flow prediction helps the transport users to plan their time of travel and also in selecting the travelling path depending on the predicted information. Fuzzy logic is a multi-valued logic which defines the intermediate values that can occur between conventional evaluations such as high/low, true/false or yes/no. It approaches the human logic more closely allowing the measure of possibility as a replacement for the measure of probability. The present work proposes the application of fuzzy logic to traffic flow prediction problem by defining fuzzy sets for traffic flow variables and its corresponding membership functions. Performance is evaluated using various performance measures.
X(t+1)= f ( X(t-1), X(t-2),……, X(t-d)) where X(t+1) is the predicted traffic flow in future and d is the no of past samples used .
II.DATACOLLECTION
The three fundamental fields of traffic flow are traffic count, density and velocity. As the proposed work focuses on traffic flow prediction, the measure of interest is traffic flow count. Rest of the fields like speed and density doesn’t affect the prediction performance. Data set used in this work is acquired from IIT, Chennai. It is recorded at a location near Perungudi toll plaza in IT corridor in Chennai. The TIRTL (The Infrared Traffic Logger) is used for traffic data collection [16]. It is situated on opposite sides of the road perpendicular to the flow of traffic. Its working is based on infrared light based technology. The data were reported at every time instant the vehicle passed through the detector section.
Figure 1. Traffic flow pattern of study area
Figure 1 shows the traffic flow pattern of three days where it can be observed that nearly two peaks exists in a day variation and also there are certain time intervals when no vehicles are recorded. The total time period of three days will be 3x24x60=4320 minutes. The IITM dataset has to be preprocessed with a special initial stage in which the rows with the same minute are counted and recorded as the per minute vehicle count for the traffic activity at the toll plaza.
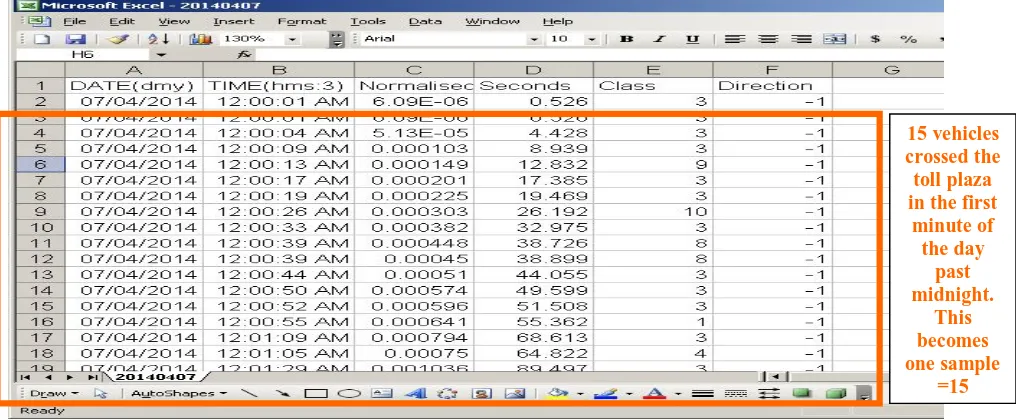
Figure 2. Required data fields of TIRTL aggregated on 1 min basis
15 vehicles crossed the toll plaza in the first
minute of the day
past midnight.
This becomes one sample
As can be seen from figure 2 that only Date, Time, Class and direction are retained and rest of the fields recorded using TIRTL are not used for implementation. The direction which is dominant is considered for use. After choosing required data fields, data pre- processing is done which includes deletion of null entries and to delete redundant entries and also to arrange the available data in 1 min time interval. The data were aggregated into 5 min, 10min and 15 min interval through pre-processing stage and processed.
III. FUZZYLOGICSYSTEM
The prediction system using fuzzy logic is proposed which uses different fis files depending on the number of past samples used for prediction history. Figure 3 shows the FIS editor using ‘Five1.fis’ file, which we use in the case of Prediction history being five.
A. Input and Output Variables
The first step is to define the input and output variables. The input variables are 5 past samples of traffic flow count for prediction history selected=5 and predicted traffic flow count in the next interval is output variable.
Figure 3. Prediction system using fuzzy logic for (5,1)
B. Membership Functions and Linguistic Variables
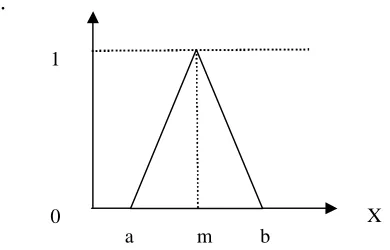
The road traffic categorized into 9 levels/sets as per the traffic count over the sampling interval without any crisp boundary between these. Every input variable has 9 linguistic variables [Very very heavy, Very heavy, Heavy, Slight Heavy, Medium, Slight Low, Low, Very Low, very very low]. The membership function used for input and output variable is ‘trimf’ represented by
.
Vt=xk1
Vt-1=xk2
Vt-2=xk3
Vt-3=xk4
Vt-4=xk5
Predict ed Traffic
flow count
Vt+1
X 1
0
a m b
Figure 4. Triangular membership function
name: 'Five1'
type: 'mamdani'
andMethod: 'min'
orMethod: 'max'
defuzzMethod: 'centroid'
impMethod: 'min'
aggMethod: 'max'
input: [1x5 struct]
output: [1x1 struct]
rule: [1x9 struct]
Figure 5. FIS Structure
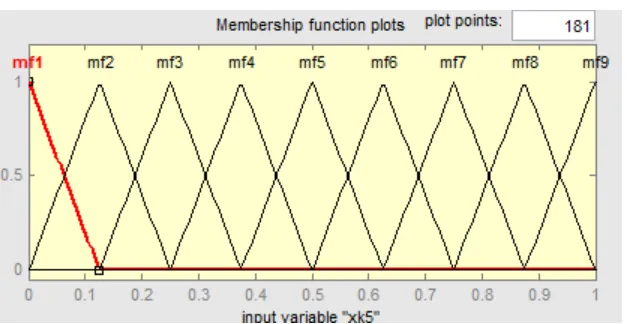
Figure 6. Membership function plot for input and output variables
Parameters of membership function of input and output variable
Very very heavy [-0.125, 0, 0.125]
Very heavy [0, 0.125, 0.25]
Heavy [0.125, 0.25, 0.375]
Slight heavy [0.25, 0.375, 0.5]
Medium [0.375, 0.5, 0.625]
Slight low [0.5, 0.625, 0.75]
Low [0.625, 0.75, 0.875]
Very low [0.75, 0.875, 1]
Very very low [0.875, 1, 1.125]
C. Rules Definition
The next stage after defining membership functions is rules definition. One simple rule can be:
If all the counts in prediction history considered fall in the Heavy category then the prediction for the output is heavy.
Nine different rules are used by the fuzzy systems which are mentioned below:
1.If (xk5 is mf1) and (xk4 is mf1) and (xk3 is mf1) and (xk2 is mf1) and (xk1 is mf1) then (yk is mf1) (1) 2. If (xk5 is mf2) and (xk4 is mf2) and (xk3 is mf2) and (xk2 is mf2) and (xk1 is mf2) then (yk is mf2) (1) 3. If (xk5 is mf3) and (xk4 is mf3) and (xk3 is mf3) and (xk2 is mf3) and (xk1 is mf3) then (yk is mf3) (1) 4. If (xk5 is mf4) and (xk4 is mf4) and (xk3 is mf4) and (xk2 is mf4) and (xk1 is mf4) then (yk is mf4) (1) 5. If (xk5 is mf5) and (xk4 is mf5) and (xk3 is mf5) and (xk2 is mf5) and (xk1 is mf5) then (yk is mf5) (1) 6. If (xk5 is mf6) and (xk4 is mf6) and (xk3 is mf6) and (xk2 is mf6) and (xk1 is mf6) then (yk is mf6) (1) 7. If (xk5 is mf7) and (xk4 is mf7) and (xk3 is mf7) and (xk2 is mf7) and (xk1 is mf7) then (yk is mf7) (1) 8. If (xk5 is mf8) and (xk4 is mf8) and (xk3 is mf8) and (xk2 is mf8) and (xk1 is mf8) then (yk is mf8) (1) 9. If (xk5 is mf9) and (xk4 is mf9) and (xk3 is mf9) and (xk2 is mf9) and (xk1 is mf9) then (yk is mf9) (1)
D. Defuzzification
In order to handle the need of considering the Prediction history of being 2,3 and 4 apart from 5 as shown above we have different FIS files like “Two1.fis’,‘Three1.fis’ and ‘Four1.fis’ when the past samples used are 2,3,4 respectively.
.
IV. IMPLEMENTATION AND SIMULATION RESULTS
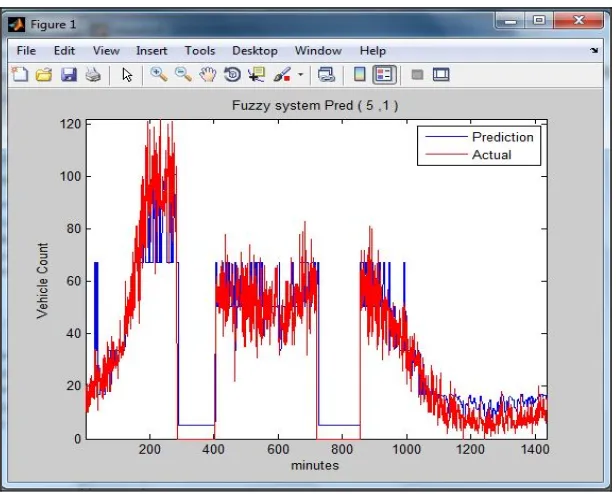
Figure 7. Prediction using fuzzy logic for aggregation interval 1
Figure 7 shows the prediction plot where it can be observed that predicted plot follows the band like structure. Also because of ‘Centroid’ based defuzzification method is followed it does not follow zero count instead it remains to the centroid value within that band. More the number of membership functions used, better will be the prediction as input is divided in more bands and there will less chances of error in such case.
TABLE-1 Performance measures for different values of aggregation interval using fuzzy logic
Effect of Agg. Interval Pred History =5
Method Agg.Interval MSE RMSE Erro Mean Err. Std. dev
Fuzzy Test ( 5 ,1 ): 1 9.11E-03 9.55E-02 1.92E-02 9.35E-02 Fuzzy Test ( 25 ,5 ): 5 1.48E-02 1.22E-01 2.76E-02 1.19E-01
Table 1 shows various performance measures evaluated for aggregation interval of 1 and 5 where it is observed that error value increases with the increase in the aggregation interval.
IV.CONCLUSION
REFERENCES
[1]. Z.M.B. Said M.M. Hamed, H.R. Al-Masaeid. Short-term prediction of traffic volume in urban arterials. Journal of Transportation Engineering, pages 249–254, 1995.
[2]. Anthony Stathopoulos and Matthew G. Karlaftis. A multivariate state space approach for urban traffic flow modeling and prediction.
Transportation Research Part C: Emerging Technologies, 11(2):121 – 135, 2003.
[3]. R.K. Oswald B.L. Smith, B.M. Williams. Parametric and nonparametric traffic volume forecasting. Paper Presented at the 2000 Transportation Research Board Annual Meeting, Washington, DC, 2000.
[4]. Tao Zhang, Lifang Hu, Zhixin Liu, and Yuejie Zhang. Nonparametric regression for the short-term traffic flow forecasting. In Mechanic Automation and Control Engineering (MACE), 2010 International Conference on, pages 2850 –2853, june 2010.
[5]. Iwao Okutani and Yorgos J. Stephanedes. Dynamic prediction of traffic volume through kalman filtering theory. Transportation Research Part B: Methodological, 18(1):1 – 11, 1984.
[6]. R. Chrobok, J. Wahle, and M. Schreckenberg. Traffic forecast using simulations of large scale networks. In Intelligent Transportation Systems, 2001. Proceedings. 2001 IEEE, pages 434 –439, 2001.
[7]. Stathopoulos and M.G. Karlaftis. Spectral and cross-spectral analysis of urban traffic flows. In Intelligent Transportation Systems, 2001. Proceedings. 2001 IEEE, pages 820 –825, 2001.
[8]. Shiliang, Chnagshui and Guoqiang,” A Bayesian Network Approach to Traffic Flow Forecasting”, IEEE Transactions on Intelligent Transportation Systems, Vol.7,No1, March 2006.
[9]. Tong,Fan, Cui and Meng,” Fuzzy Neural Network model Applied in the Traffic Flow Prediction”,IEEE 2007.
[10]. Chai,Michel, Bernard and Seng,” POP-TRAFFIC: A Novel Fuzzy Neural Approach to Road Traffic Analysis and Prediction”, IEEE Transactions on Intelligent Transportation systems, Vol 7, No2, June 2006.
[11]. Long Chen and Philip Chen,” Ensemble learning approach for freeway short-term traffic flow prediction”, IEEE 2007. [12]. Haixiang and Jingjing , “ Prediction of Traffic Flow at Intersection Based on Self-Adaptive Neural Network”, IEEE, 2010.
[13]. Li, Lin and Liu,” Type-2 fuzzy logic approach for short term traffic forecasting”, IEE Proceedings, Intelligent Transportation System, Vol 153, No. 1, March 2006.
[14]. Wen-ge and Yan,” Research on Traffic Flow Fuzzy Time Series Forecasting Algorithm of Single Intersection”, Fourth International Conference on Innovative Computing, Information and Control, 2009.
[15]. Bharti Sharma, Katiyar and Gupta ,” Fuzzy Logic model for the prediction of traffic volume in week days”, International Journal of computer Applications, Volume 107-No 17, December 2014.