110101-5353 IJET-IJENS © February 2011 IJENS
A Linear Programming Technique for the
Optimization of the Activities in Maintenance
Projects
1
Omar M. ELMABROUK
1Department of Industrial and Manufacturing System Engineering Garyounis University, Benghazi-Libya
1
Abstract-- PERT/CPM are two traditional closely related operations research techniques, PERT (program evaluation and review technique) and CPM (critical path method), are available to assist the maintenance project manager in carrying out their responsibilities. Among their responsibility is scheduling of a large number of activities during shutdown and overhauling, since shutdown and overhauling provide unique opportunities to a maintenance department not normally available during standard operation and relatively during a short periods of time. Moreover, the best way to guarantee success of any type of maintenance project is to have a strong, experienced project manager and strong, experienced business analyst. While dealing with maintenance projects, these two indivi duals, working together from the beginning of the project, set the stage for success by accurately planning and clearly defining the expected outcomes. To be on time, it is required to complete the maintenance project within the predetermined deadline to keep cost at lowest possible level by a reliable technique than to rely on a trial and error approach. The deadline to be achieved, some projects require to minimize their completion time by crashing their critical activities. This would direct managers to encounter a decision situation about which activities of the project will be crashed to minimize the total cost of crashing project, since crashing a project represents additional costs, crashing decisions need to be made in a cost-effective way.
This paper mainly provides a framework for crashing total maintenance project time at the least total cost by using Linear Programming (LP) technique. A prototype example of replacing an existing boiler with an energy efficient boiler was used to show how this technique is used for strategic decision making and assisting managers dealing with crashing maintenance projects activities.
Index Term-- maintenance, project management, CPM , PERT, linear programming.
1. INTRODUCTION
British Standard Glossary of terms (3811:1993) defined maintenance as the combination of all technical and administrative actions, including supervision actions, intended to retain an item in, or restore it to, a state in which it can perform a required function. Project management is not a new concept for organizations or managers. The concepts and ideas behind effective project management are however constantly been undergoing modification and improvement. A Dupont engineer, Morgan R. Walker and a Remington-Rand computer expert, James E. Kelly, Jr, initially conceived the
Critical Path Method (CPM). They created a unique way of representing the operations in the system. Their methods involved using ―unique arrow filled diagrams or network methods‖ in 1957. [1,2]
At approximately the same time, the U.S. Navy initiated a project called PERT (Program Evaluation Research Task) in order to provide naval management with an effective manner by which they could periodically evaluate the information of the new Fleet Ballistic Missile.[3]. Moreover, PERT/CPM is effective tool for project planning. PERT stands for Program Evaluation Review Technique. Even though these techniques were develop for defense applications they are useful for many maintenance projects. The conventional "Bat Chart" is adequate for a small straight forward jobs having around 200 activities. But for larger maintenance projects such as plant shut down and overhaul jobs where activities are many PERT/CPM techniques help us to ascertain the logis tics of different resources [4] .
Any maintenance project represented by networks, the network consists of number of activities . These activities are represented in a network by arrows. These activities are clearly definable task to which a know quantity of resources will be applied and hence activities always take time. An activity is represented by an arrow. There are also activities known as dummy activists which are used to indicate a constraint and keep the logic correct or sometimes numbering system unique. Dummy activity are represented by broken arrow. Event is the junction of arrow(s) and as such does not consume time. It represents that point of time when all activities ending at that point are done and all succeeding activities that begin at that point can start. It is represented by a circle. The interdependency of activities indicate relationship between different activities. For any project, the first event represents the starting point and the last event represents the completion point of a project.[4].
110101-5353 IJET-IJENS © February 2011 IJENS 2. LITERATURE REVIEW
2.1. Definition of Project Management
The PMBOK® Guide defines project management as ―the application of knowledge, skills, tools, and techniques to project activities in order to meet project requirements.‖ Project management balances competing demands (scope, time, cost, quality, requirements, expectation of various stakeholders, etc.) throughout the project lifecycle and involves the interaction of three elements: [5]
a. People — People perform the work and determine the success or failure of a project.
b. Processes — Processes specify products or deliverables required for the project and identify who will perform the work and when .
c. Tools — People use predefined tools and techniques to manage the project.
2.2. Benefits of Project Management
Project management fulfills two purposes: (1) It provides the technical and business documentation to communicate the plan and, subsequently, the status that facilitates comparison of the plan against actual performance, and (2) it supports the development of the managerial skills to facilitate better management of the people and their project [6]. In addition, project management helps the project manager bring project in on time, on target, and within budget by defining project’s outcome, accurately estimating the time and resources necessary to complete project successfully, scheduling tasks and resources to avoid conflicts, and planning about anticipated problems [7]
2.3. Process of project management
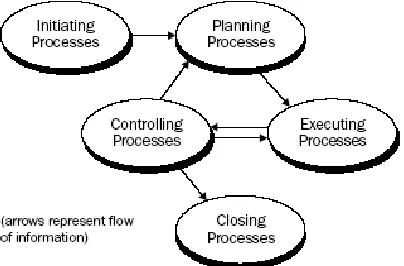
Projects are composed of processes. A process is a series of actions bringing about a result.‖ [8] Project Management Institute organizes project management processes into five groups, these groups are initiating processes, planning processes, executing processes, controlling processes, and closing processes . The process groups are linked by the results they produce-the result or outcome of one often becomes an input to another. Among the central process groups, the links are iterated planning provides executing with a documented project plan early on, and then provides documented updates to the plan as the project progresses. These connections are illustrated in figure 2.1.
Fig. 2.1. Links among process groups in a phase
In addition, the project management process groups are not discrete, one time events; they are overlapping activities that occur at varying levels of intensity throughout each phase of the project. Figure 2.2 illustrates how the process groups overlap and vary within a phase.
Fig. 2.2. Overlap of process groups in a phase
2.4. Tools of project management
2.41. Analysis
(a) Priority-driven goal statement: In the project initiating phase, project manager should answer what the goal of the project is and what the client wants. One of the most common reasons projects fail is a lack of clarity regarding the expected outcomes. It is crucial that all key players in a project have a clear understanding of what the project will produce. Project manager also set the priority of the project. That is, project manager should answer what the most important elements of this goal are. Johnson mentioned time, target, budget, and purpose as project elements. [7]
(b) The Four C’s of an Effective Plan: When project manager plan the project, Johnson recommended the four C’s; clarifies objectives, codifies requirements, contains contingencies , and commits to paper. [7]
(c) Work Breakdown Structure: Any project is easier to manage when broken into smaller task. The work breakdown structure is a checklist of every activity that must be performed to create the end product. (Knutson, 1991) To develop a schedule, the successful project manager must break the project down into small work components. (Ghattas & Mckee, 2001) Johnson recommended to write each task on a sticky note, group tasks in clusters that have common factors, identify tasks, subtasks, and sub-subtasks, and arrange them in hierarchical order. [7]
(d) Task Analysis Worksheet: Project manager identify the resources to accomplish the project goal and plan to use them best. To do this, using task analysis worksheet, project manager identify the dependency, duration, schedule and cost of tasks. [7]
110101-5353 IJET-IJENS © February 2011 IJENS project is moved up. At these times, it is helpful to have an
accurate understanding of the ratio between adding resources to your project to accelerate its completion and the cost of those resources.‖ [7]
(f) What if Analysis: To ensure timely completion of the project, project manager should examine the ―what if‖ that could derail its implementation. What if a delivery of materials is delayed? What if a key member of the team resigns? What if the supplier’s union strikes? What if? It helps to have a strategy for dealing with the most likely ―what ifs.‖ A ―what if‖ analysis can help. To conduct a ―what if‖ analysis: Identify the critical tasks of the project, and use the Pareto principle to select those tasks that will have the greatest likelihood of occurrence and the severest impact on the project. [7]
2.4.2 Chart
(a) Flow Chart: A flowchart is a graphical representation of a process. It represents the entire process from start to finish, showing inputs, pathways and circuits, action or decision points, and ultimately, completion. It can serve as an instruction manual or a tool for facilitating detailed analysis and optimization of workflow and service delivery.
(b) Network Chart: The work breakdown structure defines the tasks of the project and then network chart provides the sequence of the tasks visually. The objective of the network is to portray visually the relationship of work activities to each other. A network demonstrates these relationships and communicates them more clearly to project team members and to managers than any other technique.[6].
The project-charting technique was developed by the Special Projects Office of the US Navy to control the Polaris Weapons Systems project. A PERT chart is a network of circles, or ―nodes,‖ (representing events) connected by arrows (representing tasks). The arrangement of these circles and arrows illustrates flow of work toward project completion, dependent relationship between tasks, and parallel tasks.[7] CPM (Critical Path Method): This project charting technique was developed by the Dupont Company. It is identical to PERT except PERT places tasks on the arrows of the network while CPM places the tasks within the circles.
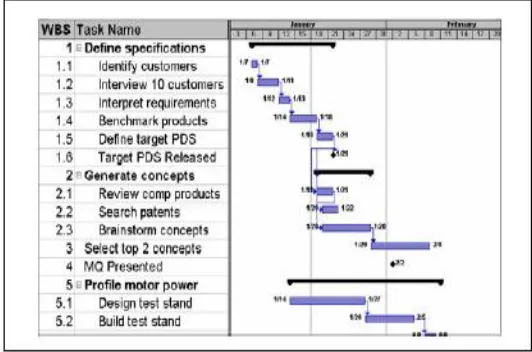
(c) Gantt Chart: A Gantt chart is a bar chart that is a visual representation of the sequencing and duration of activities on any given project. It consists of a list of activities, a time scale, and a bar for each activity. Each activity is assigned a number, and time is plotted along the horizontal axis as shown in figure 2.3. [9]
Fig. 2.3. Example of Gantt chart
2.4.3 Terminology
(a) Critical Path: When tasks are displayed sequentially in a network chart such as CPM or PERT, the various sequences of tasks form pathways through the network. [7]. The critical path is the longest sequential series of tasks leading from the start to the end of the project. [6].This path is critical because each subsequent task depends on its predecessors being completed on time. In other words, the critical path contains no slack time. Therefore, if any task on this path slips and the lost time is not regained, the end date for the project will slip by an equal amount of time. [7].
(b) Dependent Task: A task that cannot begin until a previous task has been completed. [7].The project manager can define the most immediate predecessors for each work task on the work breakdown structure, and then prepare a dependency analysis worksheet that can be translated to a network. The key purpose is to review the relationships among work tasks within the project. Some tasks must be done in a sequential order. [6].
(c) Lag Time: The time delay between the end of one task and the beginning of another in a sequence. [7].It’s another name is float. Float is the leeway time existing within noncritical path tasks. Technically, float is the difference between the late finish and early finish times for tasks on noncritical paths. Float occurs only on noncritical paths. [6].
(d) Earned Value: The percent a project is complete, multiplied by the amount of the budget. [7].Earned value shows how much work has been accomplished and can be used to determine performance standards and to forecast mathematically time and/or dollars needed to complete the project. It can provide much more information than just whether the project is ahead of or behind schedule, over or under budget, and/or being efficient or inefficient with the organization’s money. [6].
110101-5353 IJET-IJENS © February 2011 IJENS Two common types of budget; Fixed budget: The amount of
money is fixed in advance. The project design must confirm to the budget available and under runs are encouraged. Zero -Based-Budget: Each project is budgeted starting at zero. Work activities or outputs are ranked in order of decreasing importance. Resources are allocated top-down.[7]
3. LINEAR PROGRAM M ING APPROCH
We know linear programming is a tool for decision making under certain situation. So, the basic assumption of this approach is that we have to know some relevant data with certainty. The basic data requirements are as follows:
a) We have to know the project network with activity time, which can be achieved from PERT and CPM.
b) To what extent an activity can be crashed.
c) The crash cost associated with per unit of time for all activities. Before formulating the model, let us define some relevant terms. We know, a project is the combination of some activities, which are interrelated in a logical sequence in the sense that the starting of some activities is dependent upon the completion of some other activities. These activities are jobs which require time and resources to be completed. The relationship between the activities is specified by using event. As an event represents a point in time that implies the completion of some activities and the beginning of new ones, the beginning and end point of an activity are thus expressed by two events.
Now let’s define the variable of the problem.
Let Z be the total cost of crashing activities. The problem then is to minimize Z, subject to the constraint that project duration must be less than or equal to the time desired by the project manager. The natural decision variables are :
xj = reduction in the duration of activity j due to crashing this activity, for j = A, B . . . , N.
YFINISH = project duration, i.e., the time at which the FINISH node in the project network is reached.
To help the linear programming model assign the appropriate value to yFINISH, given the values of xA, xB, . . . , xN, it is convenient to introduce into the model the following additional variables
Yj = start time of activity j (for j _ B, C, . . . , N), given the values of xA, xB, . . . , xN.
(No such variable is needed for activity A, since an activity that begins the project is automatically assigned a value of 0.) By treating the FINISH node as another activity (albeit one with zero duration), as we now will do, this definition of yj for activity FINISH also fits the definition of yFINISH given in the preceding paragraph.
The start time of each activity (including FINISH) is directly related to the start time and duration of each of its immediate predecessors as summarized below.
For each activity (B, C, . . . , N, FINISH) and each of its immediate predecessors, Start time of this activity (start time _ duration) for this immediate predecessor.
4. A PROTOTYPE EXAM PLE— REPLACM ENT AN EXISTING BOILER WITH AN ENERGY EFFICIENT
BOILER
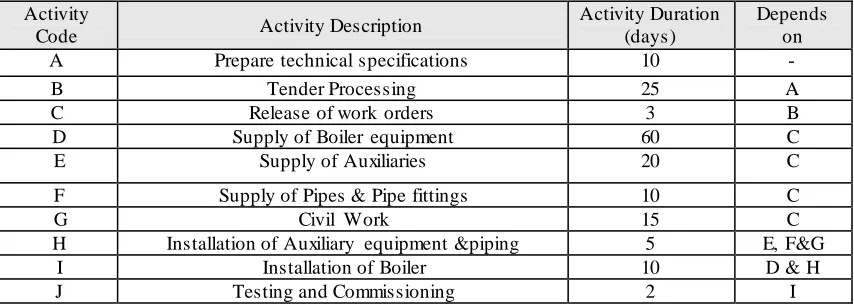
Table 4.1 shows his list of the various activities needed for replacing an existing boiler with an energy efficient boiler. The first column represents the activity cod, the description of each activity is shown in second column, the third column provides the activity duration and forth column gives important additional information for coordinating the scheduling of the replacement activities.
For any given activity, its immediate predecessors,as given in the fourth column of Table 4.1, are those activities that must be completed by no later than the starting time of the given activity. Similarly, the given activity is called an immediate successorof each of its immediate predecessors.
T ABLE4.1
REP LACING AN EXISTING BOILER WITH AN ENERGY EFFICIENT BOILER.
Depends on Activity Duration
(days) Activity Description
Activity Code
- 10
Prepare technical specifications A
A 25
Tender Processing B
B 3
Release of work orders C
C 60
Supply of Boiler equipment D
C 20
Supply of Auxiliaries E
C 10
Supply of Pipes & Pipe fittings F
C 15
Civil Work G
E, F&G 5
Installation of Auxiliary equipment &piping H
D & H 10
Installation of Boiler I
I 2
Testing and Commissioning J
Now, the question arises what will be the extent of crashing project time or what will be the minimum completion date of the project after being crashed. To determine this extent, we have to develop a CPM based on crash time of the activities that will provide us the minimum time beyond which the project cannot be crashed. So, the adjusted deadline of the
110101-5353 IJET-IJENS © February 2011 IJENS TABLE 4.2
REP LACEMENT ACTIVITIES LIST WITH HYP OTHETICAL NORMAL AND CRASH DATA
Crash Cost $
Normal Cost $
Crash Time(Days) Normal Time (Days)
Depends on Activity
Code
6000 4900
8 10
- A
6000 3000
24 25
A B
3300 2000
2 3
B C
3000 1600
58 60
C D
6000 5000
19 20
C E
4000 1800
9 10
C F
8000 6000
13 15
C G
9000 8000
4 5
E, F&G H
4000 3000
9 10
D & H I
2000 1000
1 2
I J
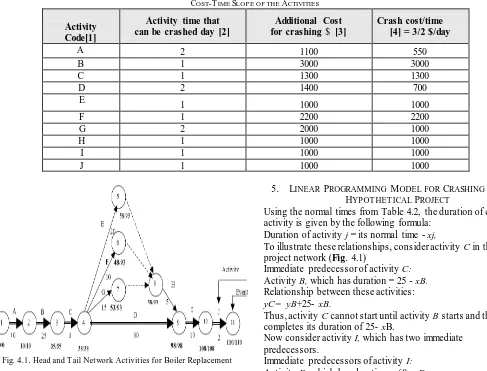
Management of this project wants to complete the project within 105 days. Now, the management wants to know how to crash the activities of the project so that the total cost will be minimized. The cost-time slopes of the activities are shown in Table 4.3
For the purpose of modeling the problem, it is necessary to define the activities in terms of starting and ending event. The head and tail events of activities are shown in Figure 4.1. In
this figure, numerator denotes the earliest event occurrence time and denominator is the latest event occurrence time, the Critical Path for this network is A-B-C-D-I-J.
The events on the critical path have zero slack, dummy activity has no duration and the total duration for the completion of the project is 110 days based on the critical path.
TABLE 4.3
COST-TIME SLOP E OF THE ACTIVITIES
Crash cost/time [4] = 3/2 $/day Additional Cost
for crashing $ [3] Activity time that
can be crashed day [2] Activity
Code[1]
550 1100
2 A
3000 3000
1 B
1300 1300
1 C
700 1400
2 D
1000 1000
1 E
2200 2200
1 F
1000 2000
2 G
1000 1000
1 H
1000 1000
1 I
1000 1000
1 J
Fig. 4.1. Head and T ail Network Activities for Boiler Replacement
5. LINEAR PROGRAMMING MODEL FOR CRASHING T HE HYPOT HET ICAL PROJECT
Using the normal times from Table 4.2, the duration of each activity is given by the following formula:
Duration of activity j = its normal time - xj,
To illustrate these relationships, cons ider activity C in the project network (Fig. 4.1)
Immediate predecessor of activity C: Activity B, which has duration = 25 - xB. Relationship between these activities: yC= yB+25- xB.
Thus, activity C cannot start until activity B starts and then completes its duration of 25- xB.
Now consider activity I, which has two immediate predecessors.
110101-5353 IJET-IJENS © February 2011 IJENS Relationships between these activities:
yI= yH+5- xH yI= yD+60- xD.
These inequalities together say that activity I cannot start until both of its predecessors
finish. By including these relationships for all the activities as constraints, we obtain the complete linear programming model given below.
Minimize Z =550XA + 3000XB + 1300XC + 700XD + 1000XE + 2200XF
+ 1000XG + 1000XH + 1000 XI + 1000 XJ (1)
Subject to
a. Maximum reduction constraints:
XA<=2, XB<=1, XC<=1, XD<=2, XE<=1, XF<=1, XG<=2, XH<=1, XI<=1, XJ<=1
b. Nonnegativity constraints:
X1= 0, X2>= , ………, XJ>=0, Y1= 0, Y2>= , ………, YJ>=0,
c. Start-time constraints:
YB + XA >=10 YC - YB +XB >=25 YD- YC +XC >=3 YE -YC +XC >=3 YF -YC +XC >=3 YG -YC +XC >=3 YH -YG -XG >=15 YH -YF - XF >=10 YH -YE -XE >=20 YI -YH -XH >=5 YI -YD -XD >=60 YJ -YI -XI >=10 YFINISH-YJ+XJ >=2
d. Project duration constraint:
YFINISH <= 105, which means that the manager need to crash the project time 5 days. Using lindo software, the solution of the mathematical model is shown in Table 5.1
TABLE 5.1. SOLUTION OF THE MODEL
REDUCED COST $
Final Value
$
Objective Value
- 3500,000
Z
0.000000 0.000000
XA
2000.0000 0.000000
XB
300.00000 0.000000
XC
0.0000000 2,00000
XD
1000.0000 0.000000
XE
2200.0000 0.000000
XF
1000.0000 0.000000
XG
1000.0000 0.000000
XH
0.000000 0.000000
XI
0.000000 0.000000
XJ
0.000000 0.000000
YA
0.000000 8.000000
YB
0.000000 33.000000
YC
0.000000 36.000000
YD
0.000000 36.000000
YE
0.000000 36.000000
YF
0.000000 74.000000
YG
0.000000 89.000000
YH
0.000000 94.000000
YI
0.000000 104.000000
YJ
0.000000 105.000000
YFINISH
The total cost for crashing will be $ 3500,000 From this approach First of all, the manual approach of crashing time is a time consuming erroneous process. It requires trial and error method to get the optimal result. Linear Programming Model Solution also gives us some flexibility by providing a sensitivity report of the mathematical model.
6. CONCLUSIONS
The data needed for crashing project activities by means of linear programming technique are the time and cost for each activity when it is done in the normal way and then when it is fully crashed (expedited). The project manager can investigate the effect on total cost of changing the estimated duration of the project to various alternative values. .By using linear model presented in this paper, the project manager will be able to determine how much (if any) to crash each activity in order to minimize the total cost of meeting any specified deadline for the project.
REFERENCES
[1] Archibald, R. D. and Villoria, R. L., Network -based management systems (PERT /CPM), Wiley, New York,. 1966
[2] Korman, R., Critical Path Method: Network Logic Was Aided By Mainframe Power ENR, 252, 30, (2004) 7
[3] D.G. Malcolm, J.H. Roseboom, C.E. Clark, Booz, Allen and Hamilton, Chicago, Illinois, and W.Fazar, Special Projects Office, U.S. Navy, Washington, D.C., Application of a T echnique for Research and Development Program Evaluation, April 27, 1959.
[4] PERT / CPM for maintenance, from:
http://criticalchain.co.uk/How/CriticalChainvsCriticalPa.html [5] Caltrans Project Management Handbook October, 2007.
[6] Knutson J., & Bitz I., Project Managem ent. New York: AMACOM, 1991
[7] Johnson, L.,The Art of Managing A Project. (Video) New York: Career T rack. 1988
[8] Project Management Institute [PMI]: A guide to the Project Management Body of Knowledge, Newtown Square. Australian Edition published by Standards Australia International Limited, ISBN 0 7337 4455 9, 2000