Hoi Yan Cheung
City University of Hong Kongand
Alex W.H. Chan
University of Hong KongThe Effect of Education
on Life Satisfaction Across Countries
The study of life satisfaction of diverse countries is becoming increasingly important. Studies have shown that people who are satisfied with their lives are positive about other aspects of their lives such as their health. So it is important to examine the factors that can lead to life satisfaction. This study examines the relationships between education and life satisfaction across countries. Thirty-five countries are included in the study; the results show that life satisfaction is higher in countries where people have more education. Years of education are predicted by enrollment rates at the secondary and tertiary levels. Based on the findings of this study, educators and policy-makers should encourage people to continue their education.
L’étude de la satisfaction de vivre dans divers pays prend de l’importance. La recherche a déjà indiqué que ceux qui sont satisfaits de leur vie sont également plus positifs face à d’autres aspects de leur vie comme leur santé. Il est donc important d’étudier les facteurs qui entraînent la satisfaction de vivre. Ce projet porte sur le rapport entre l’éducation et la satisfaction de vivre dans trente-cinq pays. Les résultats indiquent que la satisfaction de vivre est plus élevée dans les pays présentant des taux de scolarité plus élevés. Les années de scolarité sont évaluées en fonction des taux d’inscription aux niveaux secondaire et tertiaire. Les résultats de cette étude poussent les auteurs à recommander que les enseignants et les décideurs encouragent les gens à poursuivre leur éducation.
Quality of life (QOL) has been much studied. QOL in its simplest form can be understood as what constitutes a good life. According to Ventegodt et al. (2005), QOL is divided into subjective QOL, which includes well-being, satis-faction with life, happiness, and meaning in life; and objective QOL, which consists of biological order, realization of life potential, fulfillment of needs, and objective factors such as cultural norms. However, only in the last few decades have systematic and empirical studies of QOL been conducted. As a result of these, the concept of QOL has been changed from being a judgment that depends on subjective values to being regarded as consisting of the same components for all people (Lyons, 2005). Bramston, Chipuer, and Pretty (2005) deemed QOL to be multidimensional, with personal factors, environmental
Hoi Yan Cheung is an assistant professor in the Department of Applied Social Studies. Her research interests are comparative studies, cross-cultural studies, and educational psychology topics such as teacher efficacy. Most of her studies have involved comparing educational aspects among countries and cultures.
factors, and the interaction between the two playing important roles in deter-mining people’s overall QOL.
As mentioned, a major component of QOL is life satisfaction. Frisch et al. (2005) assert,
Quality of life is often equated with life satisfaction in psychology and psychiatry … when quality of life is not equated with life satisfaction, life satisfaction is usually included as an essential component of a quality of life battery of assessment. (p. 67)
They define life satisfaction as people’s subjective evaluation of how far their most important needs, goals, and wishes have been fulfilled. Diener (1994) defines life satisfaction as the global evaluation by people of their own life.
Compared with the concept of well-being, life satisfaction is less em-phasized in the research. Furthermore, most of the studies that examine life satisfaction have focused on adults (Diener, 1994; Veenhoven, 2000) such as undergraduate students (Benjamin & Hollings, 1997; Disch, Harlow, Campbell, & Dougan, 2000; Wells, 1998) and older age groups (Morganti, Nehrke, Hulicka, & Cataldo, 1988). Many instruments have been developed to try to understand people’s conception of their level of life satisfaction such as the Satisfaction with Life Scale (Diener, Horwitz, & Diener, 1995; Pavot & Diener, 1993), the Subjective Well-Being Inventory (SWBI, Nagpal & Sell, 1985; Sell & Nagpal, 1992), the life satisfaction measure in the Quality of Life Inventory (QOLI, Frisch, 2004), the Life Satisfaction Matrix (LSM, Lyons, 2005), and the Brief Multidimensional Students’ Life Satisfaction Scale (BMSLSS, Zullig, Huebner, Gilman, Patton, & Murray, 2005).
Generally speaking, a low level of life satisfaction is associated with nega-tive events or incidents both at the individual and location levels. Moore, Leslie, and Lavis (2005) found that experiences of negative emotions and well-being were associated with a lower level of life satisfaction, and Zullig et al. (2005) showed a higher level of life satisfaction rating to be negatively corre-lated with sadness, depression, worry, anxiety, and various negative physical and mental conditions. Ratings of life satisfaction are judgments that rely strongly on an individual’s positive experiences, so a low level of life satisfac-tion may be a major risk factor for psychological disturbance (Lewinsohn, Redner, & Seeley, 1991).
Whether education can increase people’s QOL is an important and debatable topic. An interesting study by Hillman and McMillan (2005) showed that the life satisfaction of Australian youths was significantly but weakly associated with their participation in a range of post-school education, training, and labor market activities. The study was subsequently used in the design of various post-school activities to enhance the life satisfaction of students and is a good example of how educational aspects can directly affect overall life satisfaction. Other studies in this area mainly focus on how educational aspects affect the various domains of satisfaction.
affects various areas of satisfaction. For example, the level of education of employees was found to be related to their self-assessed satisfaction with various aspects of their job when the characteristics of the employees were controlled (Vila & García-Mora, 2005). Although the study focused only on the job satisfaction of employees, the level of overall life satisfaction is believed to be derived from satisfaction in various domains of life (Lyubomirsky, King, & Diener, 2005).
When the level of life satisfaction is assumed to derive from a combination of levels of satisfaction in various domains in life, the study of satisfaction with education becomes important, especially because people spend many years of their lives in school. Satisfaction with education has been found to be as-sociated with persistence, graduation, grade achievement, alumnus status, and many other positive aspects and experiences (Einarson & Matier, 2005). Einar-son and Matier indicate that the study of satisfaction and education peaked between the 1970s and the mid-1980s. However, most of the studies conducted at this time focused either on the satisfaction of students with a particular institute or on a particular race or ethnicity, and the findings cannot be gener-alized because institutes and ethnicities may generate differing levels of satis-faction caused by diverse variables. The investigation of the effect of various areas of education on overall life satisfaction, therefore, remains important, as research on this topic is limited.
If education really affects life satisfaction as some studies have claimed, it is important to offer quality education and to encourage more people to study formally. Offering quality education and increasing enrollment have been found to be affected by government expenditure on education (Jones & Zim-mer, 2001). Cheung and Chan (2008) showed that education expenditure predicts the enrollment rate and quality of education across countries. Other studies have found that education expenditure is determined by governments and authorities (Falch & Rattso, 1999) and also a country’s cultural dimensions (Cheung & Chan). Although the government of each region decides the specific amount that will be spent on education, the real budget increases or decreases in line with the amount that is earned by a country each year, or the GDP. Methods of Measuring Life Satisfaction
coun-tries and found that most work-role inputs had a significant effect on well-being.
Aims of the Study
This study aimed to find out if merely participating in various levels of educa-tion can lead to higher overall life satisfaceduca-tion. In an effort to fill this gap, this study takes the bottom-up approach to study life satisfaction and its rela-tionship with education in 35 countries. The eight educational variables in-cluded are the overall enrollment rate of students in primary, secondary, and tertiary education; the enrollment rate of female students in primary, secon-dary, and tertiary education; and the expected number of years that will be spent in all three levels of education. The study also aims to determine whether the percentage of GDP that is spent on education affects the seven educational variables and thus the rating of life satisfaction across the countries.
Methodology
The dataset shown in Table 1 was collated from various sources. The data on life satisfaction across countries were taken from the Average Happiness in 91 Nations 1995-2005, World Database of Happiness Rank Report. This report measured the level of happiness in 91 countries from 1995 to 2005 and includes life satisfaction as a category, which was assessed by means of surveys among samples of the general population of the countries (Veenhoven, 2006). The scores are based on responses to the question All things considered, how satisfied or dissatisfied are you with your life as a whole now? which were rated on a numerical scale that ranged from 0—dissatisfied to 10—satisfied.
Several other studies have used data from the World Database of Happiness. Heylighen and Bernheim (2000) point out that the World Database of Happiness
has compiled the results of hundreds of surveys to test something similar to global QOL. The data were collected by various institutions in the countries using varied methodologies, but the results are comparable because they were compiled to a common standard; and although the quality of the input data varies somewhat, no systematic biases can be found in the methodology. In terms of the question All things considered, how satisfied or dissatisfied are you with your life as a whole now? answers are generally comparable to the results of an ACSA (Anamnestic Comparative Self-Assessment) score of global QOL (Bernheim, 1999; Bernheim & Buysc, 1984).
The data on the six education variables (overall primary, secondary, and tertiary enrollment and female primary, secondary, and tertiary overall enroll-ments) were collected from the World Development Indicator (WDI) 2006 database (World Bank, 2006). The database aims to provide quality statistics (both national and international) to improve the capacity of member countries to produce and use statistical information for studies and to enhance their development. As the titles of the variables suggest, primary, secondary, and tertiary female enrollment measure the enrollment rates of women in each country at these three educational levels; and overall primary, secondary, and tertiary enrollment measure the overall enrollment rates at these three educa-tional levels.
The data on expected number of years of education were collected from the
education is the total number of years of education for both men and women in each country for all levels of education (primary and lower secondary educa-tion, upper secondary educaeduca-tion, postsecondary non-tertiary educaeduca-tion, and tertiary education) excluding children under the age of 5. The dataset shown in Table 1 combines data from the Average Happiness in 91 Nations 1995-2005 from the World Database of Happiness Rank Report, the WDI 2006 database, and the World Education Indicators Programme 2005 for the 35 countries under study.
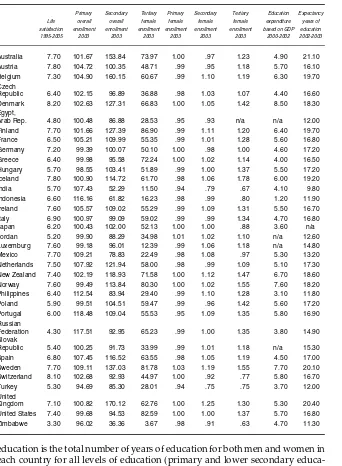
Table 1
Dataset for the 35 Countries
Primary Secondary Tertiary Primary Secondary Tertiary Education Expectancy
Life overall overall female female female female expenditure years of
satisfaction enrollment enrollment enrollment enrollment enrollment enrollment based on GDP education
1995-2005 2003 2003 2003 2003 2003 2003 2000-2002 2002-2003
Australia 7.70 101.67 153.84 73.97 1.00 .97 1.23 4.90 21.10
Austria 7.80 104.72 100.35 48.71 .99 .95 1.18 5.70 16.10
Belgium 7.30 104.90 160.15 60.67 .99 1.10 1.19 6.30 19.70
Czech
Republic 6.40 102.15 96.89 36.88 .98 1.03 1.07 4.40 16.60
Denmark 8.20 102.63 127.31 66.83 1.00 1.05 1.42 8.50 18.30
Egypt,
Arab Rep. 4.80 100.48 86.88 28.53 .95 .93 n/a n/a 12.00
Finland 7.70 101.66 127.39 86.90 .99 1.11 1.20 6.40 19.70
France 6.50 105.21 109.99 55.35 .99 1.01 1.28 5.60 16.80
Germany 7.20 99.39 100.07 50.10 1.00 .98 1.00 4.60 17.20
Greece 6.40 99.98 95.58 72.24 1.00 1.02 1.14 4.00 16.50
Hungary 5.70 98.55 103.41 51.89 .99 1.00 1.37 5.50 17.20
Iceland 7.80 100.90 114.72 61.70 .98 1.06 1.78 6.00 19.20
India 5.70 107.43 52.29 11.50 .94 .79 .67 4.10 9.80
Indonesia 6.60 116.16 61.82 16.23 .98 .99 .80 1.20 11.90
Ireland 7.60 105.57 109.02 55.29 .99 1.09 1.31 5.50 16.70
Italy 6.90 100.97 99.09 59.02 .99 .99 1.34 4.70 16.80
Japan 6.20 100.43 102.00 52.13 1.00 1.00 .88 3.60 n/a
Jordan 5.20 99.90 88.29 34.98 1.01 1.02 1.10 n/a 12.60
Luxemburg 7.60 99.18 96.01 12.39 .99 1.06 1.18 n/a 14.80
Mexico 7.70 109.21 78.83 22.49 .98 1.08 .97 5.30 13.20
Netherlands 7.50 107.92 121.94 58.00 .98 .99 1.09 5.10 17.30
New Zealand 7.40 102.19 118.93 71.58 1.00 1.12 1.47 6.70 18.60
Norway 7.60 99.49 113.84 80.30 1.00 1.02 1.55 7.60 18.20
Philippines 6.40 112.54 83.94 29.40 .99 1.10 1.28 3.10 11.80
Poland 5.90 99.51 104.51 59.47 .99 .96 1.42 5.60 17.20
Portugal 6.00 118.48 109.04 55.53 .95 1.09 1.35 5.80 16.90
Russian
Federation 4.30 117.51 92.95 65.23 .99 1.00 1.35 3.80 14.90
Slovak
Republic 5.40 100.25 91.73 33.99 .99 1.01 1.18 n/a 15.30
Spain 6.80 107.45 116.52 63.55 .98 1.05 1.19 4.50 17.00
Sweden 7.70 109.11 137.03 81.78 1.03 1.19 1.55 7.70 20.10
Switzerland 8.10 102.68 92.93 44.97 1.00 .92 .77 5.80 16.70
Turkey 5.30 94.69 85.30 28.01 .94 .75 .75 3.70 12.00
United
Kingdom 7.10 100.82 170.12 62.76 1.00 1.25 1.30 5.30 20.40
United States 7.40 99.68 94.53 82.59 1.00 1.00 1.37 5.70 16.80
Finally, the data on the percentage of GDP spent on education were col-lected from the Human Development Report 2005, which is published by the United Nations Development Programme (UNDP, 2005). Over the years, Human Development Reports have received an excellent worldwide reputa-tion and have played a crucial role in understanding and setting key develop-ment policies. The 2005 Report has many sections, but this study uses the Commitment to Education: Public Spending section to derive the data for this variable. A major reason for selecting these datasets is because they were compiled by well-known and reputable organizations such as UNESCO and the World Bank.
Results
The correlation results for the nine variables show that life satisfaction is significantly correlated with all the other variables except overall primary enrollment. The highest two correlations were between expected years of edu-cation and overall secondary and overall tertiary enrollment, with r=.89 and r=.84 respectively. Table 2 shows the correlation results for the variables.
Regression analysis was conducted to predict the level of life satisfaction in the 35 countries. All models applied the stepwise method. First, all the vari-ables (overall primary, secondary, and tertiary enrollment; female primary, secondary, and tertiary female enrollment; expected years of education; and percentage of GDP spent on education) were entered as independent variables. Table 3 shows that only expected years of education was included in the final model and that it predicted 36% of the total variance in life satisfaction with a positive slope at the p<.001 significance level.
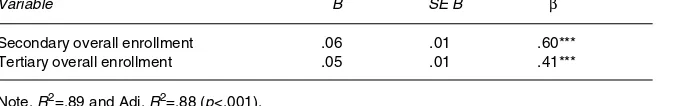
To determine the factors that predict expected years of education, overall primary, secondary, and tertiary enrollment; female primary, secondary, and tertiary enrollment; and percentage of GDP spent on education were entered as independent variables. Table 4 shows that overall secondary and tertiary en-rollment were included in the final model as both were able to predict 89% of the total variance in expected years of education with positive slopes at the p<.001 level.
Table 2
Correlations Among the Nine Variables
Variables (N=35) 1 2 3 4 5 6 7 8 9
1. Life satisfaction -2. Primary overall enrollment .03 -3. Secondary overall enrollment .57** –.03 -4. Tertiary overall enrollment .48** –.01 .73** -5. Primary female enrollment .41* –.13 .43** .52** -6. Secondary female enrollment .43** .26 .62** .46** .57** -7. Tertiary female enrollment .38* .07 .59** .70** .42** .63** -8. Expectancy years of education .63** –.12 .89** .84** .56** .59** .67** -9. Education expenditure GDP .50** –.25 .53** .59** .39* .38* .58** .65**
To predict the rate of overall secondary and tertiary enrollment, female primary, secondary, and tertiary enrollment, and percentage of GDP spent on education were entered as independent variables. Table 5 shows that female secondary enrollment and percentage of GDP spent on education predicted 49% of the total variance in overall secondary enrollment. The slopes were positive, and female secondary enrollment and percentage of GDP spent on education were significant at the p<.01 and p<.05 levels respectively. Table 6 shows that female primary and female tertiary enrollment predicted 63% of the total variance in overall tertiary enrollment. The slopes were positive, and
Table 3
Summary of Regression Analysis for Variables Predicting Life Satisfaction (N=35)
Variable B SE B β
Expectancy years of education .24 .06 .60***
Note. R2=.36 and Adj. R2=.33 (p<.001).
Table 4
Regression Analysis for Variables Predicting Expectancy Years of Education (N=35)
Variable B SE B β
Secondary overall enrollment .06 .01 .60***
Tertiary overall enrollment .05 .01 .41***
Note. R2=.89 and Adj. R2=.88 (p<.001).
Table 5
Regression Analysis for Variables Predicting Secondary Overall Enrollment (N=35)
Variable B SE B β
Secondary female enrollment 142.29 41.58 .50**
Education expenditure based on GDP 6.70 2.86 .34*
Note. R2=.49 and Adj. R2=.46 (p<.001).
Table 6
Regression Analysis for Variables Predicting Tertiary Overall Enrollment (N=35)
Variable B SE B β
Tertiary female enrollment 45.69 9.80 .60***
Primary female enrollment 386.16 150.18 .33*
female primary and tertiary enrollment were significant at the p<.001 and p<.05 levels respectively.
Finally, the percentage of GDP spent on education predicted 15%, 14%, and 34% of the female primary, secondary, and tertiary enrollment respectively. Tables 7, 8, and 9 show the respective results. All three models had positive slopes, and female primary, secondary, and tertiary enrollment were
sig-Table 7
Regression Analysis for Variables Predicting Primary Female Enrollment (N=35)
Variable B SE B β
Education expenditure based on GDP .01 .002 .39*
Note. R2=.15 and Adj. R2=.13 (p<.001).
Table 8
Regression Analysis for Variables Predicting Secondary Female Enrollment (N=35)
Variable B SE B β
Education expenditure based on GDP .03 .01 .38*
Note. R2=.14 and Adj. R2=.11 (p<.001).
Table 9
Regression Analysis for Variables Predicting Tertiary Female Enrollment (N=35)
Variable B SE B β
Education expenditure based on GDP .11 .03 .58***
Note. R2=.34 and Adj. R2=.31 (p<.001).
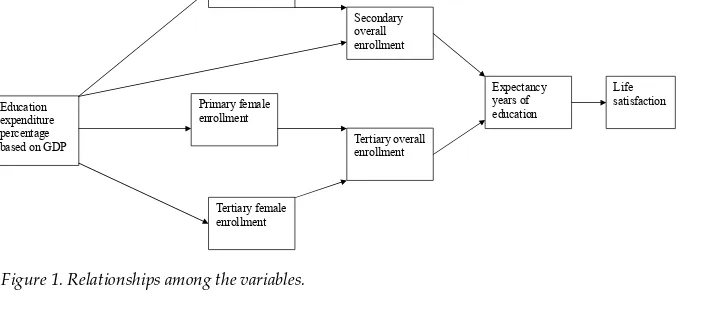
Figure 1. Relationships among the variables.
Education and Life Satisfaction 28
Figure 1
Relationships amongst the Variables
Secondary female enrollment
Primary female enrollment
Tertiary female enrollment
Secondary overall enrollment
Life satisfaction Expectancy
years of education Tertiary overall
enrollment Education
nificant at the p<.05, p<.05, and p<.001 levels respectively. Figure 1 summarizes the relationships between the variables.
Discussion
A regression analysis model of this study shows that expected years of educa-tion seems to be the strongest predictor of life satisfaceduca-tion across the 35 coun-tries. Thus based on this result, it is logical to find that the overall secondary and tertiary enrollments are able to predict the expected years of education. In other words, the longer the time spent in education, the higher is people’s level of life satisfaction. In this section we discuss some of the possible explanations for the effects of education on life satisfaction. According to Maslow’s (1970) Need-Gratification Model of Subjective Well-Being, in which lower needs (such as physiological, safety, and love needs) must be met first, education is considered a higher need. It is believed that the gratification of higher needs produces greater happiness and life satisfaction than the gratification of lower needs (Oishi, Diener, Lucas, & Suh, 1999), but to enjoy more years of education, people’s basic needs must first be met, which will no doubt lead them to feel more satisfied with their lives in some way. Moreover, education or knowledge is important in meeting higher needs such as self-respect, freedom, confidence, and self-actualization (Maslow).
It is interesting that overall primary enrollment did not predict expected years of education, which indicates that the emphasis in terms of life satisfac-tion is on secondary and tertiary educasatisfac-tion levels. The World Declaration on Education for All and the Framework for Action to Meet Basic Learning Needs
(World Bank, 1994) urge governments to universalize primary education and significantly reduce illiteracy before the end of the decade. In addition, under the Dakar Framework for Action, all member countries have committed to several obligations, one of which is to ensure that by 2015 all children, and particularly girls, children in difficult circumstances, and those belonging to ethnic minorities have access to and complete free and compulsory quality primary education (UNESCO, 2000). Governments around the world have been urged to give the highest policy and budgetary priority to improving their education systems so that all children can receive a basic education.
According to Maslow’s (1970) Theory of Needs, academically speaking, primary education is a basic need. Most countries are now monitored by various organizations such as the World Bank and UNESCO to ensure that they offer basic primary education to all children. However, it may be that only well-off countries that respect human rights offer secondary education. People in a given country who are able to obtain more than their basic needs may be more satisfied than those who are able to meet only their basic needs.
Millen-nium Development goals is the achievement of gender parity in primary and secondary education by 2005 and the extension of such parity to all levels of education by 2015. It is, therefore, necessary to achieve the equal participation of girls and boys in all levels of education proportionate to their share in the relevant age groups of the population. However, according to the Global Monitoring Report (UNESCO, 2004), 54 countries are at risk of not achieving this goal based on current trends. More than 56% of children who are not in school are girls, and over two thirds of illiterate people globally are women. In this study the female enrollment rates affected the overall enrollment rates because when more women are enrolled in education, the overall enrollment rate also increases.
Finally, the results of this study also show that the percentage of GDP spent on education significantly predicts the female enrollment rates at all three educational levels. Many studies have shown a positive relationship between education expenditure and enrollment (Gordon, 1982; Leal & Hess, 2000). Similarly, in this study the correlations between percentage of GDP spent on education and the enrollment rate at the various levels of education were significant (ranging from r=.38-.58) except for overall primary enrollment. Whetzel and McDaniel (2006) demonstrate that the knowledge of a population is an important and significant factor that determines differences in wealth and economic growth across countries, and thus the amount that is spent on educa-tion. Therefore, when people study for longer and gain more knowledge as a result, this knowledge will eventually serve to increase the economic growth of their country. Another study has shown that graduates who study on four-year degree courses earn twice as much as graduates with no degree and are able to find jobs more easily, and that even degree-holders who study for only two years have a higher QOL than those with only a high school diploma. The life satisfaction of more educated people may be higher because they enjoy a better standard of living and have a more stable life. Interestingly, it requires more time for first-generation college students to earn as much as other students (Adam, 2006).
We do not wish overinterpret the reasons why education predicts life satis-faction, but to provide some possible reasons for the relationships between the education variables. The principle of the bottom-up approach is that when basic human needs are met, QOL increases. The results of this study are in line with this principle in that greater education expenditure, more years of educa-tion, and higher enrollment rates are found to lead to a higher level of life satisfaction. In conclusion, it may be important to investigate and understand what other affecting factors could influence the nine variables examined in this study. Because education expenditure and policies for primary, secondary, and tertiary enrollments are linked to the decision of countries’ governors and policy-makers, culture may play an important role in this issue.
Limitations and Further Studies
dimensions affect education enrollment, growth in GDP per capita, and life satisfaction across countries, for example, by investigating whether these vari-ables are affected by Hofstede’s cultural dimensions (power distance, in-dividualism, uncertainty avoidance, and masculinity). As every country has its own group of cultural dimensions and it is believed that culture and values are important to all people, this issue merits further examination.
Because countries for which there are no data on the nine variables (life satisfaction; overall primary, secondary, and tertiary enrollment; female primary, secondary, and tertiary enrollment; expected years of education, and percentage of GDP spent on education) were excluded from this study, only 35 countries were analyzed. The results were generated from these 35 countries and therefore cannot be generalized. However, this study is a first step in establishing that the inclusion of more people in education predicts life satis-faction across countries.
Note
Correspondence about this article should be addressed to Hoi Yan Cheung, Department of Applied Social Studies, City University of Hong Kong, Tat Chee Avenue, Kowloon, Hong Kong. E-mail: [email protected]
References
Adam, M. (2006). Does higher education count less? Education Digest, 71(6), 47-51.
Bernheim, J. (1999). How to get serious answers to the serious question: “How have you been?”: Subjective quality of life (QOL) as an individual experiential emergent construct. Bioethics, 13, 3-4.
Bernheim, J., & Buysc, M. (1984). Anamnestic comparative self-assessment (ACSA): A method to measure the subjective quality of life of cancer patients. Journal of Psychosocial Oncology, 1, 25-38.
Benjamin, M., & Hollings, A. (1997). Life satisfaction: Test of an ecology model. Journal of College Student Development, 31, 213-228.
Bramston, P., Chipuer, H., & Pretty, G. (2005). Conceptual principles of quality of life: An empirical exploration. Journal of Intellectual Disability Research, 49, 728-733.
Cheung, H.Y., & Chan, A.W.H. (2008). Relationships amongst cultural dimensions, educational expenditure and class size of different nations. International Journal of Educational Development, 28, 698-707.
Davis, N.C., & Friedrich, D. (2004). Knowledge of aging and life satisfaction among older adults.
International Journal of Aging and Human Development, 59(1), 43-61. Diener, E. (1984). Subjective well-being. Psychological Bulletin, 95, 542-575.
Diener, E. (1994). Assessing subjective well-being: Progress and opportunities. Social Indicators Research, 31, 103-157.
Diener, E., Horwitz, J., & Diener, C. (1995). Factors predicting the subjective well-being of nations. Journal of Personality and Social Psychology, 5, 851-864.
Disch, W.B., Harlow, L.L., Campbell, J.F., Dougan, T.R. (2000). Student functioning, concerns, and socio-personal well-being. Social Indicators Research, 51, 41-74.
Einarson, M.K., & Matier, M.W. (2005). Exploring race differences in correlates of seniors’ satisfaction with undergraduate education. Research in Higher Education, 46, 641-676. Falch, T., & Rattso, J. (1999). Local public choice of school spending: Disaggregating the demand
function for educational services. Economics of Education Review, 18, 361-373.
Frisch, M.B. (2004). Use of the QOLI or quality of life inventory in quality of life therapy and assessment. In M.R. Marusih (Ed.), The use of psychological testing for treatment planning and outcome assessment (pp. 749-798). Englewood Cliffs, NJ: Erlbaum.
Frisch, M.B., Clark, M.P., Rouse, S.V., Rudd, M.D., Paweleck, J.K., Greenstone, A., & Kopplin, D.A. (2005). Predictive and treatment validity of life satisfaction and the quality of life inventory. Assessment, 12(1), 66-78.
Gordon, A. (1982). Resource redemployment in education in the 1980’s: Problems and prospects.
Heylighen, F., & Bernheim, J. (2000). Global progress I: Empirical evidence for ongoing increase in quality-of-life. Journal of Happiness Studies, 1, 323-349.
Hillman, K., & McMillan, J. (2005). Life satisfaction of young Australians: Relationships between further education, training and employment and general and career satisfaction: Longitudinal surveys of Australian youth research report 43. Victoria: Australian Council for Education Research Press. Jones, J.T., & Zimmer, R.W. (2001). Examining the impact of capital on academic achievement.
Economics of Education Review, 20, 577-588.
Kahneman, D. (1999). Objective happiness. In D. Kahneman, E. Diener, & N. Schwarz (Eds.), Well-being (pp. 3-26). New York: Russell Sage Foundation.
Leal, D.L., & Hess, F. (2000). The politics of bilingual education expenditures in urban school districts. Social Science Quarterly, 81, 1064-1072.
Leonardi, F., Spazzafumo, L., & Marcellini, F. (2005). Subjective well-being: The constructionist point of view. A longitudinal study to verify the predictive power of top-down effects and bottom-up processes. Social Indicators Research, 70(1), 52-77.
Lewinsohn, P., Redner, J., & Seeley, J. (1991). The relationship between life satisfaction and psychosocial variables: New perspectives. In F. Strack, M. Argyle, & N. Schwartz (Eds.), Subjective well-being (pp. 141-169). New York: Plenum.
Lyons, G. (2005). The life satisfaction matrix: An instrument and procedure for assessing the subjective quality of life of individuals with profound multiple disabilities. Journal of Intellectual Disability Research, 49, 766-769.
Lyubomirsky, S., King, L., Diener, E. (2005). The benefits of frequent positive affect: Does happiness lead to success? Psychological Bulletin, 131, 803-855.
Maslow, A.H. (1970). Motivation and personality. New York: Harper & Row.
Moore, S.E., Leslie, H.Y., & Lavis, C.A. (2005). Subjective well-being and life satisfaction in the Kingdom of Tonga. Social Indicators Research, 70, 287-311.
Morganti, J.B., Nehrke, M.F., Hulicka, I.M., & Cataldo, J.F. (1988). Life-span differences in life satisfaction, self-concept, and locus of control. International Journal of Aging and Human Development, 26, 45-56.
Nagpal, R., & Sell, H. (1985). Subjective well-being. New Delhi: World Health Organization Regional Office for South East Asia.
Oishi, S., Diener, E.F., Lucas, R.E., & Suh, E.M. (1999). Cross-cultural variations in predictors of life satisfaction: Perspectives from needs and values. Personality and Social Psychology Bulletin, 25, 980-990.
Pavot, W., & Diener, E. (1993). Review of the satisfaction with life scale. Psychological Assessment, 5, 164-172.
Sell, H., & Nagpal, R. (1992). Assessment of subjective well-being: The subjective well-being inventory (SUBI). New Delhi: World Health Organization, Regional Office for South-East Asia. Sousa-Poza, A., & Sousa-Poza, A.A. (2000). Well-being at work: A cross-national analysis of the
levels and determinants of job satisfaction. Journal of Socio-Economics, 29, 517-538. UNDP. (2005). Human development report 2005. New York, Author.
UNESCO. (2000). The Dakar framework for action. Paris: Office of the Assistant Director-General for Education, UNESCO.
UNESCO. (2004). Global monitoring report 2003-2004. Gender and education for all: The leap to equality. Paris: Author.
UNESCO. (2005). World education indicators programme 2005. Paris: Author.
UNESCO. (2006). (2006). Education for all global monitoring report—Literacy for life. Paris: Author. Veenhoven, R.A. (2000). The four qualities of life: Ordering concepts and measures of the good
life. Journal of Happiness Studies, 1, 1-39.
Veenhoven, R. (2006). Average happiness in 91 nations 1995-2005, World database of happiness, RankReport 2006. Retrieved January 8, 2007, from: worlddatabaseofhappiness.eur.nl Ventegodt, S., Flensborg-Madsen, T., Niels, J., Nielsen, M., Mohammed, M., & Merrick, J. (2005).
Global quality of life (QOL), health and ability are primarily determined by our
consciousness: Research findings from Denmark 1991-2004. Social Indicators Research, 71(1-3), 87-122.
Vila, L.E., & Garcia-Mora, B. (2005). Education and the determinants of job satisfaction. Education Economics, 13, 409-425.
Wells, L. Jr. (1998). The effects of ethnicity on the quality of student life: An embedded intergroup analysis. Journal of Applied Behavioral Science, 34, 403-417.
Whetzel, D.L., & McDaniel, M.A. (2006). Prediction of national wealth. Intelligence, 34(5), 449-458. World Bank (1994). World conference on education for all: Meeting basic learning needs. New York:
World Bank. (2006). The world development indicator 2006. New York: Author.